Guest Post: Hiding in Plain Sight by Jim Stuart
Reposted with permission/by request.
One day you finally knew
what you had to do, and began,
though the voices around you
kept shouting
their bad advice – – -
though the whole house
began to tremble
and you felt the old tug
at your ankles.
‘Mend my life!’
each voice cried.
But you didn’t stop.
You knew what you had to do...
From The Journey by Mary Oliver
I honestly think the healthcare system knows what it has to do to deliver quality care at a sustainable cost: replace the fee-for-service payment model with partial and total capitation; use Electronic Health Records throughout the system; coordinate care; make decisions using evidence-based medicine; and always reward quality of treatment, not quantity of procedures performed. Parts of the system are doing all of this, with terrific results: Kaiser Permanente, Mayo Clinic, Cleveland Clinic, Intermountain Health, Geisinger, to name a few. But much of the work these fine organizations do, plus all the work of just about everybody else, is based on fee-for-service, rewarding quantity, not quality.
What to do? As we all know, there are plenty of voices around us shouting their bad advice, and folks tugging at our ankles, saying "Don't go. Don't change." Inertial resistance to change in a system is a huge force. And if change doesn't in some way originate within the system, it will most likely not stick. That's why most of the cost-containing changes to Medicare the ACA introduced are exploratory, not prescriptive. In other words, the Act proposes and supports multiple tests, to see what works, what the system will adopt. There are some prescriptions: reduced payments to Medicare Advantage; reducing the annual Market Basket Pricing Update by a multi factor productivity measure (usually from .6 to 1.0%) each year; putting in place a penalty for Hospital Readmissions. But most initiatives are designed for testing, to see what works, to see what will support the system in moving away from fee-for-service, and towards better care coordination and payment for quality.
Based on trends in per Medicare beneficiary spending since the ACA was approved in 2010, it looks like it might be working:
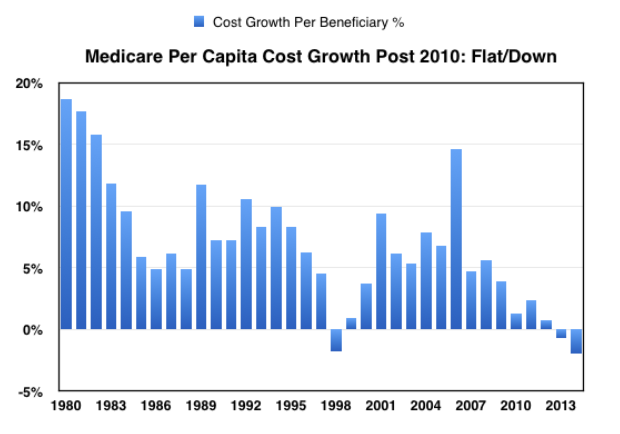
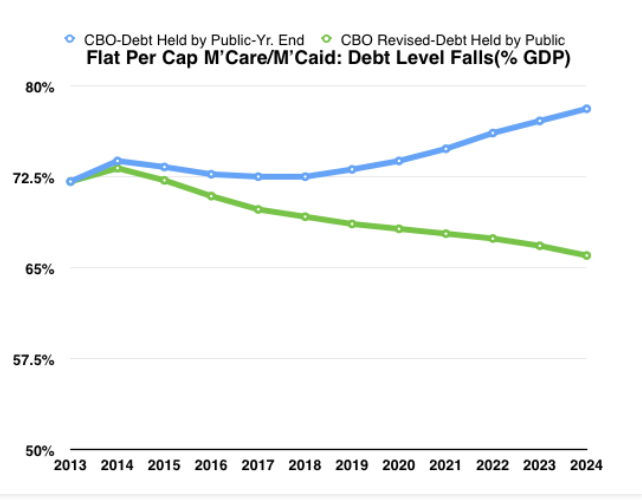
As I pointed out in a recent post, if per capita spending is held flat (i.e., 0% growth), and Medicare (and Medicaid) spending growth is based on enrollment (Baby Boomers turning 65), then the country's budget/entitlement problems are solved, and going forward Debt as a % of GDP will gradually decline:
The problem is that no one has come up with a research-grounded explanation of why per capita Medicare cost growth has flattened. What's worse, almost all of the solid research has focused on the private insurance market, not Medicare or Medicaid, and the generally accepted expert point of view is that most of the slowdown is recession-driven, and cost growth will return (after a lag time) as economic growth picks up (see here). The CBO did a terrific Working Paper in August, 2013, that looked squarely at Medicare, concluded that the recession had nothing to do with the slowdown, and then said that most of the slowdown could not be explained and more research was needed. Here's the key chart:
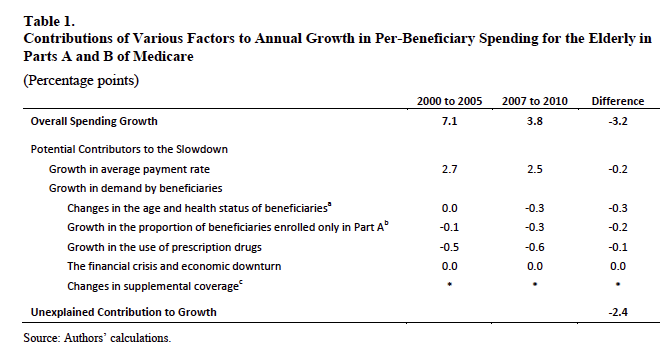
Bringing this chart forward to include more recent data simply increases the Unexplained Contribution to Growth. Average Spending Growth 2010-2014 is .6% (vs. 3.8% above); putting this number in, and leaving other adjustments the same (obviously not accurate/needing further work), widens the unexplained gap to 4.7%. So if it's not the economy, not inflation, and not demographics, what is it? Is structural reform underway? Will this slowdown last?
How can we know if the healthcare system has, as the poet would say it, finally figured out what needed to be done, and has begun doing it? Answer: we can't know for sure; but there is some extremely interesting data indicating that at least part of the Medicare system has figured it out, and is doing the necessary work to keep costs under control. And that data comes from a surprising place: Medicare Advantage.
Until very recently, I knew next to nothing about Medicare Advantage, and what little I knew wasn't very positive. I thought it was an insurance company boondoggle, where they convinced Congress to give a chunk of the Medicare business to private industry, saying they could do it more efficiently than Big Government, but that over the years, with intense lobbying, the benchmark bid targets kept moving up and away from actual Medicare Fee-for-Service per beneficiary costs, with the results that MA was now costing more than normal Medicare.
I knew that the ACA had cut back the bid benchmarks over time, bringing them back much closer to regular Medicare, and generating substantial savings to fund the Bill, with ongoing complaints from MA providers.
What I had not known was that MA is a managed care with capitation model; that the geographic-specific bid price per beneficiary was an "all-in" number (all Part A and B medical costs (Prescription Drugs handled separately), admin expenses and profits included); that the famous rebates were awarded as a percentage of the difference between the bid price and the reference price for that geographic area; that the rebate percent was awarded on a Five Star Provider quality measurement system, with larger rebates going to those with higher rankings; and that rebates had to be used to help beneficiaries lower their premium payments or to give them additional benefits (drug, vision, dental, etc.).
I also had no idea what the per beneficiary cost trends had been, since the information is almost completely hidden. Don't really think CMS is trying to fool or deceive us; I have concluded that the individual claims are not reported with other Part A or Part B spending because MA claims are paid by the MA Plan Payers, not Medicare central.
I searched and googled for a long time. Finally I hit pay dirt: on page 157 of the 2014 CMS Trustees Report, a section began labeled Private Health Plans, and there was the history and all the data, with the key page being 168, reproduced here:
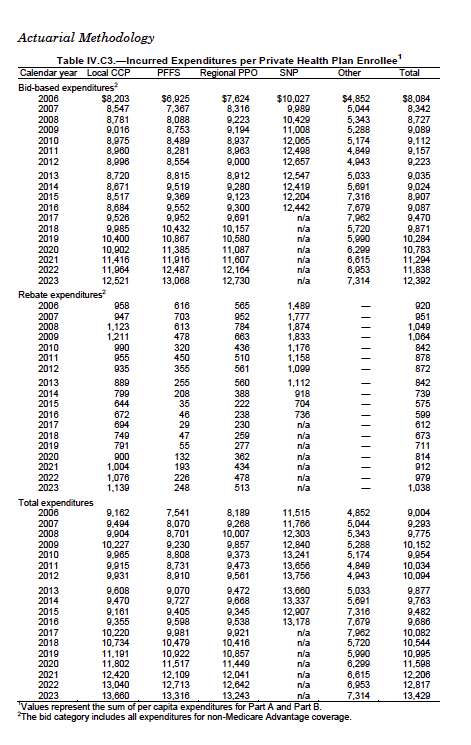
Using info from this Table; focusing only on "Local CCP (Coordinated Care Plan)" which covers the vast bulk of the enrollees; and excluding rebates (marketing, not health dollars), I came up with the following chart showing trends in per beneficiary bids to trends in Part A/B in FFS Medicare:
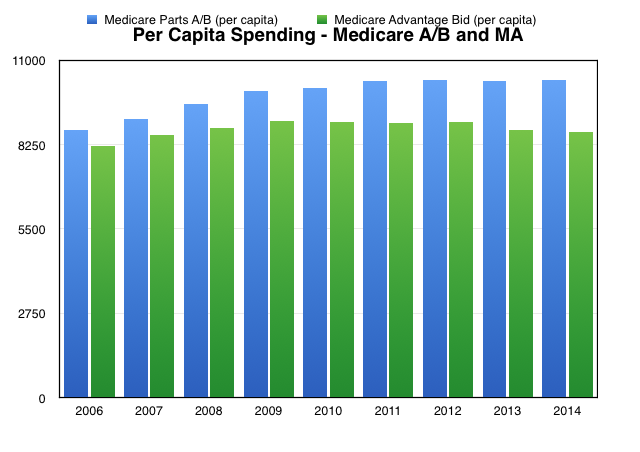
The above tells me that MA delivered all Part A and Part B care in 2014 for an average bid of $8,671 per beneficiary, 16% below the $10,339 average for FFS Medicare; and even adding the $799 MA rebate back in, gives only a $9,470 total, still 8% below Medicare. Per beneficiary MA costs have been gradually declining since 2009, opening up the gap with FFS Medicare - MA 9.5% lower in 2009; now 16% lower.
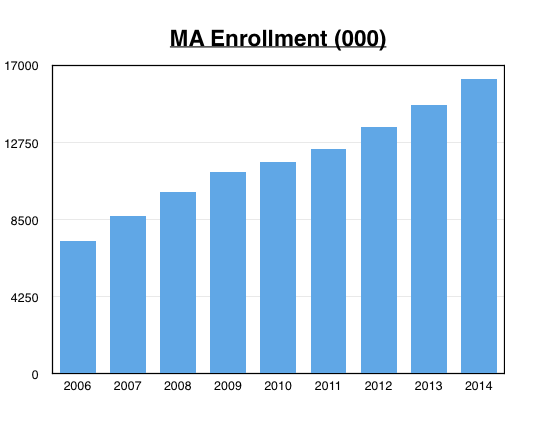
Remember when Managed Care drove healthcare costs down in the mid-90s', until people rebelled against the "Only Say No" rationing mentality of the HMO providers, and the business dried up. Not so now. Take a look at this enrollment chart:
How about quality of care? Take a look at this Boston Consulting Group study, a long, but extraordinary read. BCG analyzed 3 million claims, roughly split between normal FFS Medicare and Medicare Advantage: in almost every example the MA model delivered better quality with less utilization. It certainly looks to me like MA, with its Managed Care delivery system, is consistently giving high quality care at a predictable and managed cost.
And if I'm right about this, then the following chart showing CMS' forward projections (much like CBO's) simply doesn't make sense:
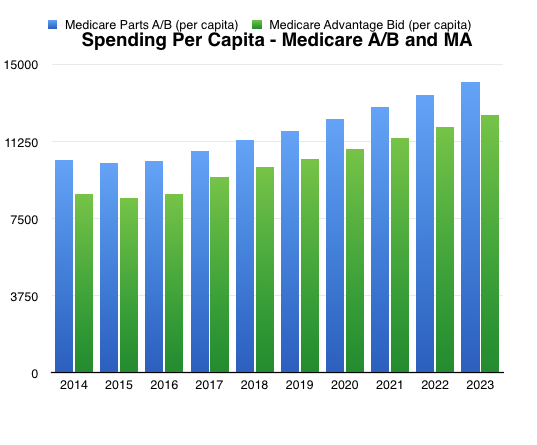
Why will the MA costs move up sharply in 2017? CMS/CBO will say they are tied to the FFS numbers; but MA has already demonstrated an ability to open the gap with FFS spending. The above chart simply doesn't make sense. The flattening of the FFS Medicare numbers from 2010-2014 might be said to be a fluke, a move away from the mean. You cannot say that about MA, where the Bid Offered reflects a commitment to manage their part of the system to that number. It is not a happy accident. It's a Managed Plan.
Medicare Advantage is, I believe, the miracle hiding in plain sight that should give us confidence that the overall Medicare system will slowly work its way to the efficiencies MA has found, and that we have a good chance of holding per beneficiary costs flat, thus accomplishing an extraordinary reversal of our healthcare cost and budget trends.
How to support my healthcare wonkery:
1. Donate via ActBlue or PayPal
2. Subscribe via Substack.
3. Subscribe via Patreon.


