

A First: I'm gonna try to project the state-by-state 4/15 QHP totals!
Thu, 04/17/2014 - 9:39pm
Today was filled with fantastic news across the board. The only bummer is that the actual HHS report for March (and the first half of April?), with the state-by-state breakdown, was not released today.
So, you know what? I'm so geeked about the 4/15 total actually breaking the big 8M mark after all that I'm going to attempt to estimate the state-by-state totals for every state which hasn't published their official 4/15 total yet myself.
This may sound insane, but it's not as difficult as you may think (well, it's not difficult to do; that doesn't mean that I'll be accurate).
First of all, I can obviously eliminate any state which has already released their data through 4/15. That gets rid of California, Colorado, Connecticut, DC, Minnesota, Nevada, New York and Oregon.
I can also eliminated Washington State, since they never participated in the expansion period (they may have a few hundred stragglers via "special case-by-case basis" but that should be about it.
Finally, I'm not going to bother with the states which have issued updates between 4/01 and 4/15; those are only going to be a matter of a couple thousand per state anyway, so any guess I come up with is going to be pretty accurate by default. This eliminates Hawaii, Kentucky, Maryland and Massachusetts from the state exchanges, as well as South Dakota (which is the only Federally-run state which has issued a 4/15 total).
This leaves 35 of the HC.gov states, plus Rhode Island and Vermont, which have been updated through 3/31 but not beyond.
So, let's get started, shall we?
First, RI and VT. They stood at 27,961 and 22,220 respectively as of 3/31.
From 3/31 to 4/15, CA went up 14.2%, CT up 2.8%, CO up 7.2%, DC up 8%, MN up 2.3%, NV up 6.3%, NY up 11.5% and OR up over 14%. It's kind of all over the map, but I'm goingto eliminate CA as an outlier since they did that "triage" thing on the final day. Overall it looks like (population difference notwithstanding), the other 7 states averaged about a 7.5% increase.
Based on this, I'm calling it:
- Rhode Island: 30,058 as of 4/15
- Vermont: 23,886 as of 4/15
OK, next: If you add up all of the 4/15 (or close to it) totals for the 15 state-run exchanges, you get a grand total of 2,584,488, plus another 3,763 for RI and VT. This comes to 2,588,251.
Next, you have to add some amount to cover the week or so missing from HI, KY, MD and MA, which only have data for part of April (ranging from 4/08 - 4/12). Let's say anther 6,000 collectively for those 4 states.
This brings the grand total for the state-run exchanges to 2,594,251.
The total for the state-run exchanges as of 3/01 was 1,621,239, so this means that they shot up an impressive 60% in the final 6 weeks.
NOW, assuming that the grand total thru 4/15 for all 50 states plus DC is 8.03 million, that means:
- The 36 Federally-run states enrolled a total of around 5,435,749 people
- The 3/01 total for the Federally-run states was 2,621,086
- That means that the HC.gov states more than doubled their enrollments in the final 6 weeks...2.07x the 3/01 total, to be precise.
Now, I do realize that this will not apply evenly, but it's the best I have for now, so let's apply that 2.07x factor to the 35 states in question, and see what we get:
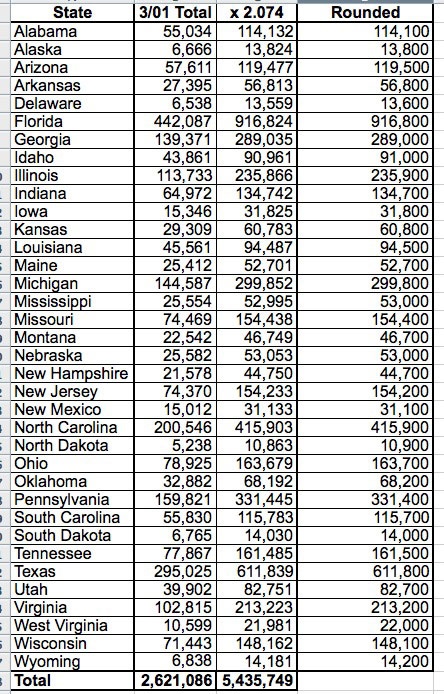
It should be fun to see if I come even remotely close on any of these!
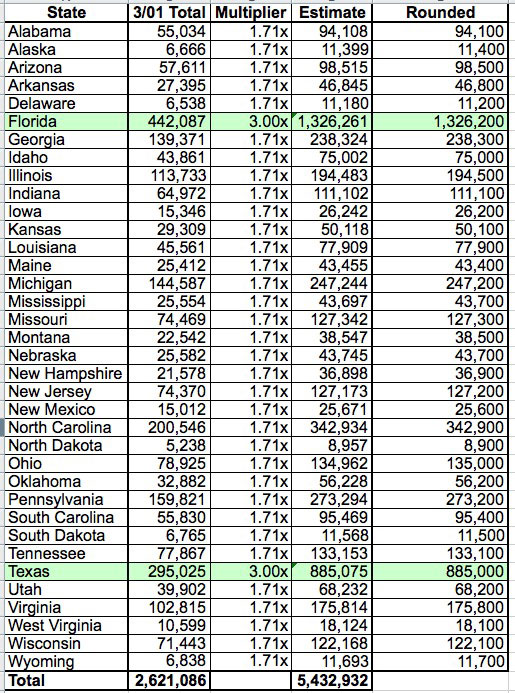
HOWEVER, my guess is that Texas and Florida will actually be much higher (3.0x more than their February totals?), causing the other smaller states to only go up by a smaller amount accordingly (perhaps 70%). Here's what things will look like if that's the case:
Advertisement
