

UPDATE: Feb. private enrollment likely to be down 20% from Jan., for an obvious reason
Sun, 02/16/2014 - 12:11pm
Hat Tip To:
dee
NewA couple of weeks ago I predicted the total January Private QHP enrollment number with accuracy that surprised even myself (I called it at precisely 3.3 million; it came in at 3,299,492).
I also gave airy, back-of-the-napkin predictions for February and March, figuring that February would come in at around 1.14 million in Febuary and between 1.5 - 2.0 million in March, for a final total of roughly 6.0 - 6.5 million enrollments. Note that this does not take into account the "paid vs. unpaid" factor, since some people won't be paid in full until mid- to late-April or beyond.
When I came up with these estimates, I made an off-hand refrence to February being 3 days shorter than January, but I didn't really think about how the HHS reports are generated. The HHS Dept. uses calendar weeks (Sunday - Saturday) for the cut-off dates of their reports instead of the calendar month, which means that the January report was actually five weeks (35 days, from December 29 through February 1st), while the February report will only be four weeks (28 days, February 2nd through March 1st).
As a result, setting aside any other factors which may increase or decrease enrollments, the February report itself is already designed to show a natural 20% drop-off from January's 1.1 million (actually 1,146,071) enrollment tally no matter what, resulting in around 910,000 people.
Now, a submitter called my attention this morning to an article over at Yahoo Finance which quotes Robert Laszewski of of Health Policy and Strategy Associates, who claims that based on his discussions with various health insurance company representatives, there may be a massive drop-off in February enrollments which may result in the February total being as low as 1/2 that of January. The article goes on to cite various reasons for this, including the "unpaid" factor (which I've already tried to address), uninsured people being less likely to sign up than people who were already insured in the first place and so forth. It also features a quote from an employee benefits attorney who states:
Other people who selected plans "get the bills mailed to them ... [and] they didn't think it was going to cost as much as it did," Hamburger said. "Or, they didn't get the bill."
I haven't interviewed any insurance company CEOs, so I have no comment on that. However, I have read quite a few anectdotal stories from people who claim that they want to pay their premiums but either haven't received their first invoice or have made their payment but not had it processed yet (or processed but not acknowledged by the insurance company).
(In fact, this was the case for my own family...we had a pre-ACA policy which was cancelled by BCBSM and replaced it with a HC.gov-based ACA-compliant plan. The exchange worked properly, BCBSM immediately acknowledged our switch from the old policy to the new one...but then proceeded to send us 3 sets of policy cards (one correct one, two wrong ones), as well as messing up our existing Auto-Pay system. We had to straighten this out twice; the end result is that even though we signed up and paid in December, we didn't actually confirm that they had processed and acknowledged our January payment until early February.)
In any event, the article paints a pretty grim picture for February. Since all I have is the actual data, I decided to take a look at the (very limited) data I have since February 1st. 12 states have posted updates since then, ranging from 2/06 to 2/12:
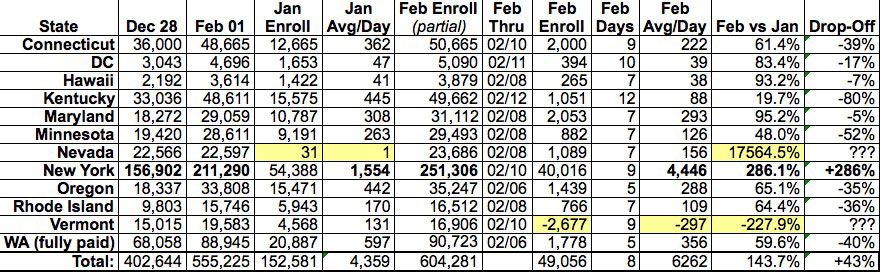
The results are mixed so far. Of the 12 states, 9 of them are showing per-day average drop-offs ranging from -5% (Maryland) to -80% (Kentucky). Pretty grim indeed.
However, of the other 3 states, Nevada and Vermont's numbers were messed up to begin with (Vermont is actually showing a negative enrollment for February so far, a likely data correction from earlier; Nevada shows only 31 people being enrolled in all of January, a likely data correction from December).
Finally, there's another major factor...New York is actually showing a massive enrollment increase in February so far: Over 40,000 from 2/02 - 2/10, or over 4,400/day, which is way up from the 1,500/day that it averaged in January.
Assuming all of the above numbers are correct, (and I can't say that it is, given the obvious weirdness in Vermont and Nevada), New York is single-handedly canceling out all of the other states combined, resulting in a 43% increase in average enrollments per day.
So my conclusion is…I honestly can't say. The only factor I can be sure of is that there's a built-in 20%-drop bias because of the 4 week / 5 week factor.
As a result, until I receive further data or clarification of the existing data, I'm going to assume that the February enrollment report will show around 910,000 people, give or take (and not taking the "paid/unpaid" factor into account). I'll follow up on this in another week or so when I have more data to work with.
UPDATE: The New York thing actually bothers me greatly. I've double-checked the numbers and sure enough, the official HHS number as of 12/28 was 156,902, while the number as of 02/01 was 211,290, or about 1,554 per day. Meanwhile, the most-recent press release states the numbers as of February 10th as 412,221 total: 251K Private, 161K Medicaid. The press release even specifically states that "Over the last week alone, the number of enrolled New Yorkers has increased by more than 31,000."
251,306 - 211,290 = 40,016 between 2/01 - 2/10, or 4,446 people per day, and 31,000/7 = 4,428/day, so these numbers sure as hell seem consistent.
Even if you assume that "31K in 7 days" includes Medicaid, NY has been averaging around 63% Private of the totals, so that would still be over 19,600 divided by 7, or 2,805 per day for the first third of February...vs. 1,554/day for all of January.
Here's the reason it really bothers me, however: If you go back to the November report, you'll see that enrollment in NY as of 11/30 was 45,513. Subtracting that from the 156,902 total enrollments as of 12/28 means that New York averaged 3,978 enrollments per day...in December. That includes the slower first half of the month but also includes the through the roof spike in the 2nd half of the month:
New York:
- October: 10/01 - 11/02: 16,404 / 33 days = 497 per day
- November: 11/03 - 11/30: 45,513 - 16,404 = 29,109 / 28 days = 1,040 per day
- December: 12/01 - 12/28: 156,902 - 45,513 = 111,389 / 28 days = 3,978 per day
- January: 12/29 - 02/01: 211,290 - 156,902 = 54,388 / 28 days = 1,942 per day
- February: 02/02 - 02/10: 251,306 - 211,290 = 40,016 / 9 days = 4,446 per day ???
You know, the massive spike between Christmas & New Years Eve, when everyone was scrambling to enroll before the January-start cut-off?
Yet according ot the above data, after New Year's, New York then dropped off by over 60% in January...only to skyrocket up to an even higher per-day average the first 10 days of February???
I find this very difficult to believe. I'd love to believe that it's true that something changed starting on February 2nd, and if I'm wrong I'm wrong, but this just seems highly unlikely to me.
I'm guessing it's far more likely that the 2/01 number of 211K is too low, but we'll just have to see...
Advertisement
