However, before the actual table breaking out all the carriers by state and how much each owes/is owed, the report includes some other interesting wonky data stuff about 2017 enrollment. Most of it wasn't of much interest to me, but one bar graph caught my eye:
Every summer for the past few years, the CMS division of the HHS Dept. has released a quarterly report stating how many ACA exchange enrollees are still enrolled in effectuated policies as of March 31st of that year.
The precise wording of this is important, because (as Republicans and other ACA detractors have been shouting about since day one), just because someone signus up for a healthcare policy doesn't mean that they actually pay their first month's premium to be enrolled...and even if they do, some of them will then drop their policy a few months later for any number of reasons (new job with benefits, moving to a different state, turning 65 and moving to Medicare, falling on hard times and qualifying for Medicaid or, in some cases...dying).
The first year of ACA Open Enrollment, running from 10/1/13 - 3/31/14, was a bit of a mess, due not only to the technical meltdown at launch but also the whole system being brand-new to everyone on the individual market. A full six months was given for the enrollment period, and even then there was so much pent-up demand at the end of March that an extra 2 weeks was tacked onto the end, for a total Open Enrollment period of 197 days.
In addition, unless I'm mistaken, most of the actual staff...the career employees at CMS/HHS, many of who've been there through more than one administration, will likely remain, and will do their jobs to the best of their ability, including trying to compile and publish data as accurately as possible.
I've written a lot about the negative impact on enrollment this year due to deliberate sabotage efforts on the part of Donald Trump and the Congressional GOP, and I stand by it. I've run the numbers and honestly believe that I've proven pretty conclusively that these efforts--in particular, the last-minute yanking of millions of dollars' worth of HC.gov "Final Deadline!" advertising--had a significant negative impact, to the tune of several hundred thousand "lost" enrollments.
However, I've also repeatedly stressed that there were most definitely other factors as well which can't be pinned on Trump's efforts. Some of these are quantifiable and pretty obvious:
NOTE: I have to attend a field trip with my kid this morning so won't be able to post about the Minnesota results until around noon, but here's an overview:
There are only 2 states which still haven't announced their final 2017 Open Enrollment Period totals: Vermont and Minnesota. Vermont isn't likely to have anything too noteworthy to say (I've confirmed ~29K QHPs...they'll probably top out at ~30K), but Minnesota has a very special situation.
Minnesota confirmed ~106,000 QHP selections as of January 10th, so they probably tacked on another 5K - 10K during the last 3 weeks of open enrollment, for a total of perhaps 115,000. This would be impressive already, since they only enrolled 83.5K people last year.
However, they're also wrapping up (even as I type this) an 8-day Special Enrollment Period piggybacked onto the end of January, and those who enroll during this SEP could receive a 25% discount on their premiums depending on their income. Here's the backstory.
The table below is a slightly-modified version of the one I've been using for my "Trump Sabotage Effect" post. This version ignores all of that and simply presents all 50 states (+DC) together.
A few days ago I assumed the grand total would come in between 12.3 - 12.4 million, but I was misreading California's total based on their previous report which had made it look like they would break 1.6 million. Instead, they came in 44K below that mark, so the national total now stands at exactly 12,227,442 QHP selections, or 3.6% below 2016's final total. There's only 2 states missing data now: Minnesota and Vermont.
A record number of Idahoans signed up for health insurance coverage through the statebased health insurance exchange during the latest open enrollment period, which ended on January 31.
“Over the last three months, more than 105,000 people selected a health insurance plan through the exchange,” said Pat Kelly, executive director of Your Health Idaho. “We have never seen more interest in Your Health Idaho. We know changes are coming to the health insurance marketplace but we want our customers to know our entire team remains committed to serving them and providing them with access to affordable health insurance options.”
In total, 105,977 Idahoans signed up for coverage through Your Health Idaho during the 2017 open enrollment period.
For the past three years, Idaho has been the leader in per-capita enrollments for state-based exchanges. YHI is currently waiting on nationwide enrollment numbers to determine how it ranks for the 2017 open enrollment period.
Oof. Regular readers know that I've compiled plenty of evidence showing that while the 39 states run through the federal exchange (HC.gov) showed a ~5% enrollment drop this year, the state exchanges have been showing an overall net increase of roughly 2% over 2016. Rhode Island, however, is the odd man out on this front, as shown in this email I just received (not up on their website yet):
Despite facing a unique set of challenges this open enrollment, 29,420 individuals selected 2017 coverage through HealthSource RI during open enrollment period (November 1, 2016 – January 31, 2017). As of January 31, 27,395 of those individuals paid, and are therefore confirmed, in 2017 coverage. We do anticipate these number will change as payments are made through the February 23 payment deadline and also as HealthSource RI remedies account issues incurred during the open enrollment period. It is difficult to point to one clear cause for this year-over-year drop in enrollment, but we believe several factors might have played a role:
Over the past few weeks I've compiled increasingly solid evidence (supported by a separate analysis by David Anderson of Balloon Juice) showing that yes, a significant portion of the reduced 2017 ACA exchange enrollment was due specifically to sabotage efforts on the part of Donald Trump and the GOP.
I've mainly focused on the last-minute "ad kill" stunt pulled by the Trump administration, in which they yanked millions of dollars worth of TV ads reminding people fo the deadline during the critical last 5 days, and the evidence is pretty telling: Enrollment across the 39 states run through the federal exchange (HC.gov) dropped by about 5% from last year, while enrollment on the other 12 state exchanges increased by over 2% (there's still final enrollment data to be added from ID, MN, RI & VT).
The reason this is so significant is that the state exchanges have their own marketing budgets, ad campaigns, outreach efforts and most significantly, branding. Ads promoting "Covered California" are gonna have a far bigger impact on enrollment for the residents of CA than ads for "HealthCare.Gov". There's some residual effect, because some people visit HC.gov first and are then redirected to CoveredCA from there, but for the most part, the state exchange branding is completely separate. (As an aside, this can sometimes have negative consequences, as in the case of "kynect" in Kentucky, which did such a bang-up job of isolating their brand from "Obamacare" that most of the state hasn't the foggiest idea that the two were the exact same law, but that's a separate discussion).
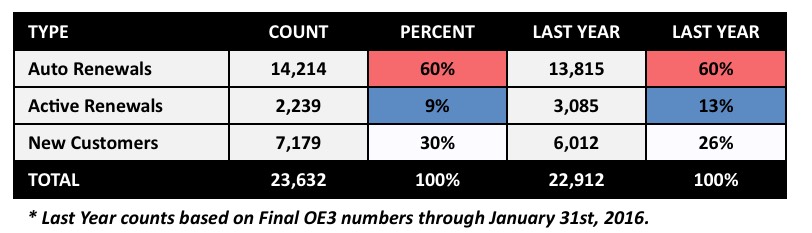
I've been cautioned that these numbers are preliminary, but that's true of all of the "final" enrollment numbers to date; there are often minor clerical corrections and the like before the final numbers are baked in.
Anyway, here's the OE4 QHP enrollment numbers for the DC exchange, which is up about 3.1% over last year.
However, according to the official ASPE report for 2016 Open Enrollment, DC's QHP tally was slightly lower (22,693); since that's the official total used by HHS, that's what I'm going with, which means they've enrolled about 4.1% more this year.