

UPDATED: Want evidence Trump killing HC.gov ads hurt enrollment? Check this out.
Fri, 02/03/2017 - 6:49pm
UPDATE 2/07/17: Over at Balloon Juice, David Anderson (aka 'Richard Mayhew') tackled the "last-minute sabotage" issue from a completely different angle, using actual statistical analysis methodology (remember, I'm not a statistician regardless of what everyone thinks)...and came to the exact same conclusion I did:
2017 using my known flawed data was running .96% behind 2016 on the January 14th inclusive update. 2017 ended up running 5.25% behind 2016 on Healthcare.gov states. The increment (using favorable to the null hypothesis data) slowdown in pace that can be attributed to Trump Administration actions is 5.25-.96 or 4.29% of enrollment was lost due to the executive order and other Trump administration actions such as shutting down some outreach and advertising in the last eleven days of enrollment.
...more aggressive baselines [referring to my own analysis below] can credibly argue that the Trump Administration actively discouraged 6% of the market from signing up.
Ever since November 9th I've been concerned that Trump winning the election might have a severe negative impact on the 2017 Open Enrollment Period numbers, but I had no way of knowing how much or little that might be. For awhile it didn't seem to be having much impact at all; enrollments were coasting along slightly ahead of 2016. As we drew nearer to him actually taking office, however--and especially once the new, GOP-controlled Congress started passing actual (preliminary) legislation to start the ACA repeal process--I accepted the prospect of enrollment being flat vs. last year.
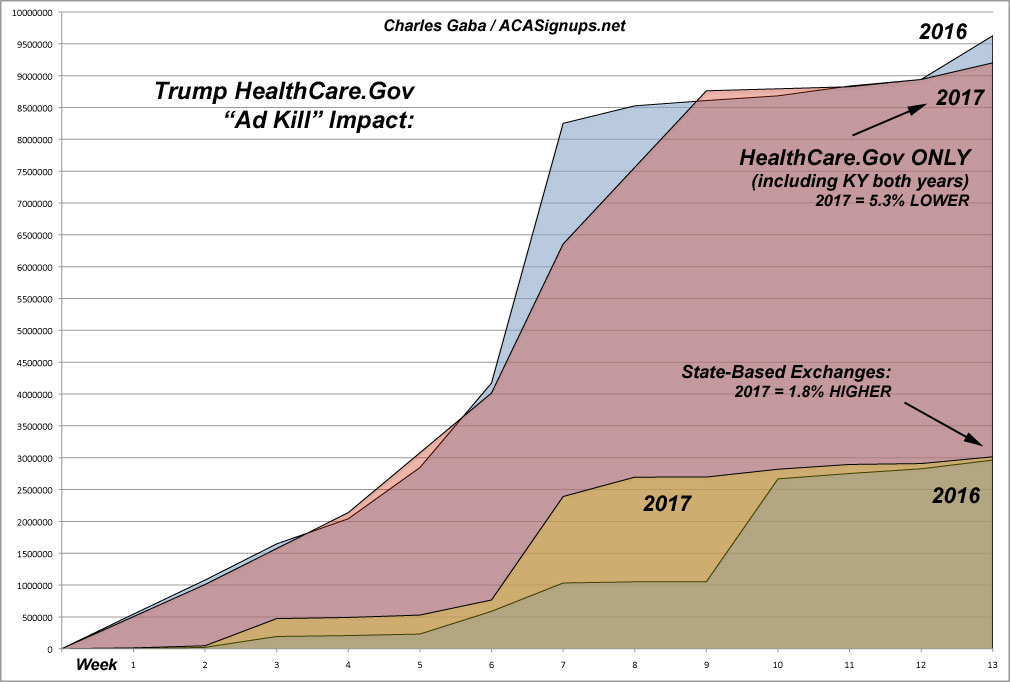
And then, in the final days of the in a one-two punch, Trump actively sabotaged the ACA by first signing an executive order instructing the HHS Dept. to do everything possible to impede the implementation of the law...followed by attempting to kill off the advertising blitz for HealthCare.Gov over the final, critical 5 days of the enrollment period. In the end, enrollment via the federal exchange (HealthCare.Gov) came in several percent LOWER than last year.
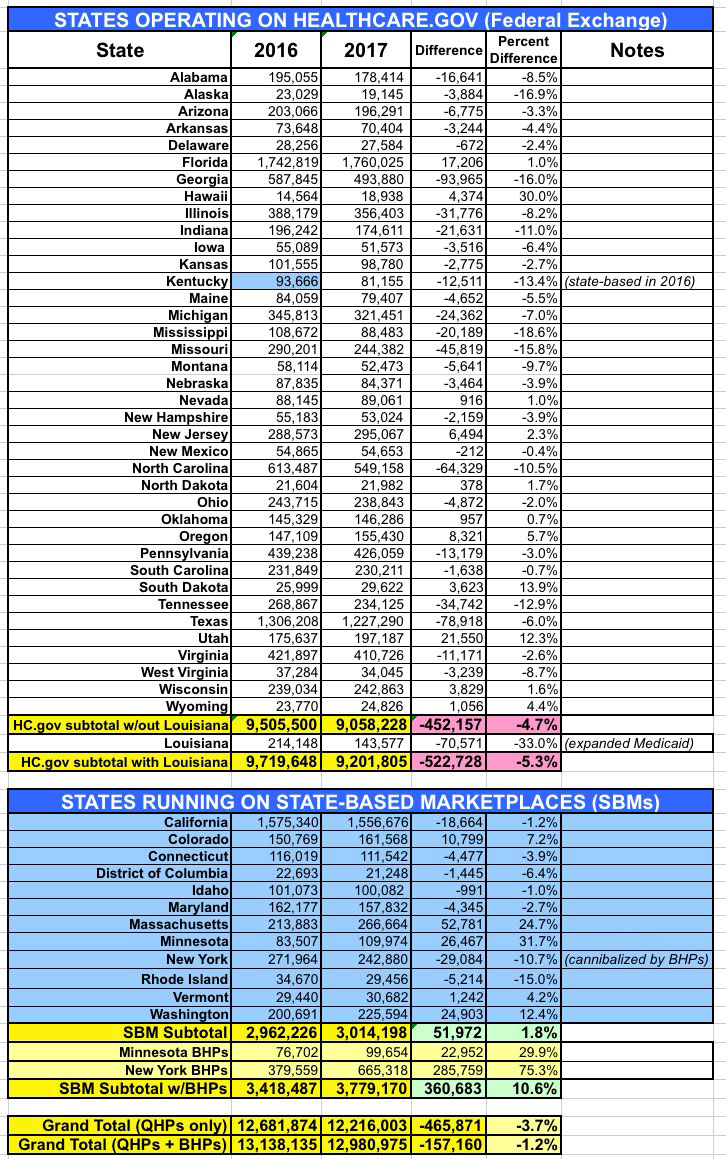
Now, the exact number/percent lower is a little trickier than the raw numbers indicate because of 2 states: Kentucky and Louisiana. Kentucky ran their own exchange (kynect) last year, so wasn't included in the HC.gov numbers...but was moved to HC.gov this year. Any apples to apples comparison needs to include Kentucky for both years.
Louisiana, meanwhile, was on HC.gov both years, but they expanded Medicaid in the middle of the year. Since Medicaid expansion has a huge impact on enrollment numbers (since it cannibalizes those in the 100-138% FPL income range), most of the "blame" for LA's reduction must fall there.
Of course, it's impossible to prove that the Trump executive-order/ad-kill combo was the cause of the numbers petering out at the end of the enrollment period...but I have some pretty strong evidence that it did.
How? Well, remember, the 12 state-based exchanges, which cover around 1/4 of all Qualified Health Plan (QHP) selections nationally, were not hurt by the ads being killed. The executive order might have had some impact, but the actual HC.gov ads being yanked shouldn't have hurt them much since these exchanges have their own, separate branding, marketing budgets and outreach programs.
I therefore decided to compare how the 39 HC.gov states performed relative to the 12 state exchanges...and although I'm still missing the final numbers for 9 state exchanges, the results are pretty telling.
Just as there are 2 "special case" states for HC.gov, there's also 2 special cases on the state exchanges: Minnesota and New York, the only two states which are offering Basic Health Plans. BHPs are sort of a hybrid between Medicaid and QHPs...they offer low-cost high-quality coverage like Medicaid, but they're still private healthcare policies which have to be selected and enrolled in just like QHPs...and, like Medicaid expansion, they tend to "cannibalize" many QHP enrollments since BHP eligibility is from the 133-200% FPL range.
With all of this in mind, the following table paints the picture. I ran the numbers for HC.gov with and without Louisiana, and I ran the state exchanges with and without the BHP numbers.
Either way, the results seem pretty clear to me: The HC.gov states ended up either 4.7% (without LA) or 5.3% (with LA) below last year...while the state exchanges are already 1.8% - 9.5% higher than last year depending on whether you "count" BHPs or not. And remember, the state exchanges are still missing up to 5 weeks worth of enrollment data for some states.
Once the remaining numbers roll in for those 9 states (including California, I might add), it's conceivable that the state exchange total could end up as much as 200,000 QHPs higher still.
UPDATE 2/06/17: Colorado just released their final numbers, and sure enough, they end the season 12% higher than last year. The table and graph below have been updated accordingly. The State Exchanges are now at least 2.4% above last year's tally.
UPDATE 2/06/17: Hmmm...California just released their final numbers...unfortunately, they're a little confusing: CoveredCA either enrolled 0.5% fewer or 2.3% more people this year than last. I've revised the state exchange portion of the table below accordingly. EIther way, the SBMs are still very much in the green zone, so to speak (either 1.6% or 3.1% higher without BHPs, or 9.3% - 10.6% higher with BHPs).
UPDATE 2/06/17: OK, both CO and CA have clarified their numbers...Colorado is actually up 14.3%, while California is actually down about 1.2% year over year. SBMs are still up 1.5%, and when the remaining 7 states are added they'll likely tack on up to 10,000 more, bringing them in about 2% above last year.
UPDATE 2/07/17: I've received the final tally from Massachusetts. They count 264,904 (which includes about 15K who still have until 2/23 to pay their first premium), plus another 5,400 who have a "special status", mainly due to not paying their February premium by the deadline (they may still be able to arrange for March coverage). If I don't include those 5,400, this still bumps the SBMs back up to a 1.7% increase over 2016.
UPDATE 2/07/17: Connecticut has chimed in; they're down 3.9% year over year, but this actually increases the SBM total, which is now 1.9% higher than 2016.
UPDATE 2/07/17: I've received the official (if preliminary) numbers from the DC exchange; they're up 4.1% year over year. That brings the SBMs up to 2.0% higher.
UPDATE 02/08/17: Rhode Island released their final number; unlike most of the state exchanges, it's down significantly (15%), but they apparently had their own unique situation going on.
UPDATE 02/08/17: Idaho has issued their press release: They're up 4.9% over last year. The State-Based Exchanges now stand at a 2.1% increase over last year vs. the 4.7% (or 5.3%) drop on the federal exchange.
I'm now awaiting just 2 states: Minnesota and Vermont. VT has been radio silent all year, so we might not find out their official total for some time, although my guess is it's not gonna be more than a thousand or so higher than the 29K which have already been confirmed as of Christmas Eve.
Minnesota, on the other hand, has scheduled a press conference for tomorrow (2/09), which is unusual...but MN has an unusual situation with their SEP/25% discount arrangement. It's hypothetically possible that they could double their current tally (106K) given the special circumstances, although realistically I would imagine they'll only tack on 5-10,000 or so. We'll see.
UPDATE 02/09/17: OK, Minnesota just held their press conference. I called it pretty well--between the final 3 weeks and the 8-day SEP, they tacked on an additional 8,600 enrollees, for a grand total of 114.6K. The SBMs now stand at 2.4% above 2016. Vermont is still an unknown, but I can't imagine that their final number will increase by more than 1,000 people or so, so 2.4% seems to be where the dust settles. (note: I have conflicting numbers which suggest that Minnesota might have 'only" increased their tally by 34%, but that's not enough to influence the SBM increase by more than a nominal amount; it's still up around 2.4%).
UPDATE 3/16/17: I've updated the tables and chart below with the final, official 2017 Open Enrollment Period numbers from CMS. None of the HC.gov state numbers changed, but some of the state-based exchange numbers have. This lowers the SBM increase to 1.8% without BHP enrollments (which is still dramatically different from HC.gov's 4.7 - 5.3% drop), or a whopping 10.6% increase if you do include them.
Advertisement
