

CMS (mostly) breaks out the over 2.55 million SEP enrollments nationally via SEP; you can still #GetCovered thru 8/15!
Tue, 08/10/2021 - 3:06pm
The previous CMS Special Enrollment Period report put the HC.gov total at 1.52 million via HC.gov as of the end of June. In addition, the press release and Sec. Becerra's comments noted that there were at least 600,000 additional SEP enrollments via the 15 state-based ACA exchanges (SBMs), for a total of at least 2.1 million nationally as of the end of June.
Last week I gave a rough estimate of perhaps another 340K more new enrollees via HC.gov for the month of June along with another ~135K via the 15 SBMs, which would bring the grand total up to around 2.57 million nationally.
As I noted this morning, CMS has confirmed almost exactly this total as of the end of July: Over 1.8 million via HC.gov plus another 723,000 via the SBMs, or over 2.5 million total. In fact, when you read the exact figures in the HC.gov report, it's even closer than that:
Key Highlights of the 2021 Special Enrollment Period (SEP) through July 31:
- Nationwide Marketplace signups: Over 2.5 million Americans have signed up for new health insurance coverage through HealthCare.gov and State-based Marketplaces during the 2021 Marketplace SEP as of July 31, 2021.
HealthCare.gov States:
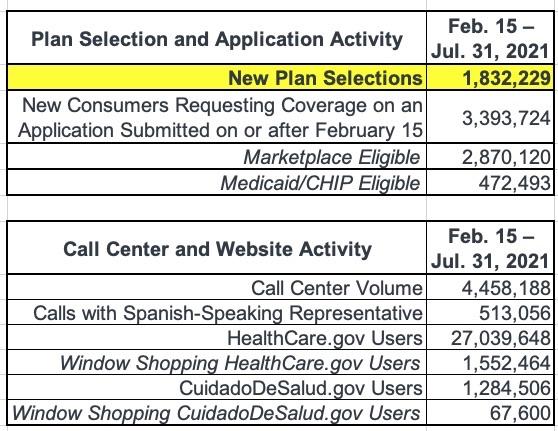
- Cumulative HealthCare.gov signups: Over 1.8 million Americans signed up for new health insurance coverage through HealthCare.gov using the 2021 Marketplace SEP between February 15 and July 31, 2021.
Impacts of the American Rescue Plan Act of 2021 (ARP):
- HealthCare.gov implemented the ARP’s more generous advance payments of premium tax credits (APTC) on April 1, 2021, which has significantly lowered premiums and out-of-pocket costs for consumers. For new consumers selecting plans during the SEP, the average monthly premium after APTC fell by 27 percent, and the median deductible fell by nearly 90 percent.
- In addition, 2.6 million consumers have returned to the Marketplace since April and lowered their monthly premiums after APTC by nearly 40 percent, on average.
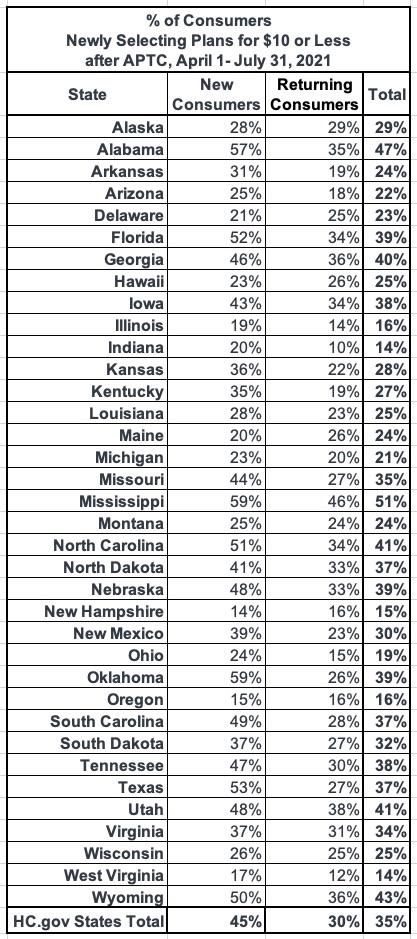
- More than one-third (35 percent) of new and returning consumers have newly selected a plan for $10 or less per month after APTC since April 1.
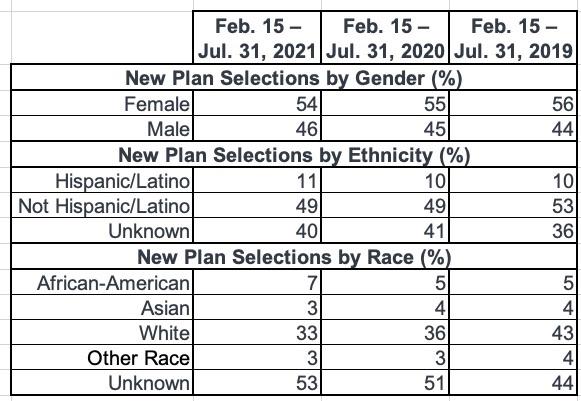
- Demographic Breakdown of 2021 SEP Consumers: This report features demographic breakdowns of plan selections during the 2021 SEP by gender, race and ethnicity.
The Centers for Medicare & Medicaid Services (CMS) reports that over 2.5 million Americans have signed up for health insurance as of July 31, 2021, through HealthCare.gov and State-based Marketplaces (SBMs), combined, since the start of the 2021 SEP made available in all Marketplaces. Consumers in states with an SBM made 723,000 plan selections since the start date of each state’s SEP through July 31, 2021. (See glossary for more information on SBMs.)
In HealthCare.gov states, 1.8 million Americans have signed up for health insurance since the SEP opportunity became available on February 15, 2021, through July 31, 2021; with 404,000 consumers signing up for health insurance in the month of July, alone.1
As I've noted before, it's important to note that CMS is reporting the net number of new enrollees after subtracting those who either never actually pay their first premium or who have their policies terminated for other reasons (inability to prove legal U.S. residency, etc.). The exact total as of 6/30 was 1,522,283; as of 7/31 it stood at 1,832,229, a difference of 309,946. This means roughly 94,000 more people who selected Qualified Health Plans (QHPs) between 2/15 - 7/31 were purged from the total. It's a good thing that CMS is doing this when possible, as it makes for a more accurate measure of how many people are enrolling in ACA policies.
Cumulatively throughout the 2021 SEP, this purging looks like so:
- February 15 - 28: 206,236 net
- March 1 - 31: 321,769 net (no purge)
- April 1 - 30: ~469,000 total minus ~57,430 = 411,570 net
- May 1 - 31: ~376,000 total minus ~74,639 = 301,361 net
- June 1 - 30: ~373,000 total minus ~91,653 = 281,347 net
- July 1 - 31: ~404,000 total minus ~94,054 = 309,946 net
All told, that's roughly 318,000 QHP selections "purged" out of 2.15 million total from 2/15 - 7/21, or about 14.8%. Typically around 10% of those who select QHPs never end up paying their first premium in the first place, and there's always some net attrition as enrollees move off of exchange plans by aging onto Medicare, having an income drop and moving to Medicaid, or (in the case of the current economic recovery) shifting back to employer-sponsored healthcare coverage, which is where a lot of these folks came to the ACA exchange from in the first place.
In other words, this is perfectly in line with expectations.
As for the daily average, here's what that looks like (after subtracting the purged QHP selections):
- February: 14,731/day
- March: 10,379/day
- April: 13,719/day
- May: 9,721/day
- June: 9,378/day
- July: 9,998/day
As I expected, there was a slight uptick in the final full month, likely due primarily to the ARP's Unemployment Benefit finally going live at HC.gov.
Remember, most states still have another 5 days to sign up for the Special Enrollment Period to get covered for the rest of 2021!
The number of new plan selections through HealthCare.gov, from the start of the SEP on February 15, 2021 through July 31, 2021, represents a substantial increase in enrollment from the same period in 2020 and 2019, when 713,000 and 521,000 consumers signed up for Marketplace coverage, respectively.2 In previous years, SEPs were available primarily only for qualifying life events, whereas this year the Biden-Harris Administration opened a SEP available on HealthCare.gov, in response to the COVID-19 Public Health Emergency.
This is broken out by state below, as always.
Under the American Rescue Plan Act of 2021 (ARP), most consumers are now eligible for more generous APTC, which further reduce the portion of monthly premiums paid by consumers. Since HealthCare.gov implemented the expanded APTC amounts on April 1, 2021, 2.6 million consumers have returned to the Marketplace and reduced their monthly premiums after APTC by 39 percent, from $105 to $63, on average, and 30 percent (784,000) of returning consumers newly selected plans for $10 or less per month after APTC.
The ARP also makes it more affordable for new consumers to purchase and use Marketplace coverage. For new consumers selecting plans through HealthCare.gov under the SEP, the average monthly premium after APTC fell by 27 percent, from $117 for those enrolling from February 15, 2021 through March 31 2021, to $85 for those enrolling from April 1, 2021, through July 31, 2021. Additionally, 45 percent (654,000) of new consumers since April 1, 2021, selected plans for $10 or less after APTC. The ARP also helped to lower out of pocket costs for many new consumers. The median deductible for new consumers during the SEP fell by nearly 90 percent, from $450 prior to April 1, 2021, to $50 for new consumers enrolling from April 1, 2021 through July 31, 2021.
The tables below provide additional details on SEP activity and plan selections in HealthCare.gov states:
Yes, that's right: When you add 1,832,229 via HC.gov + 723,000 for the state-based exchanges, you get 2,555,229 QHPs...or just 0.6% short of my 2.57 million guesstimate.
I've reposted the HC.gov state-by-state breakout below, with the additional columns showing the percent increase in SEP enrollment over the same time period from 2019 & 2020. As always, 2019 is really the best "apples to apples" comparison, since that was completely pre-COVID:
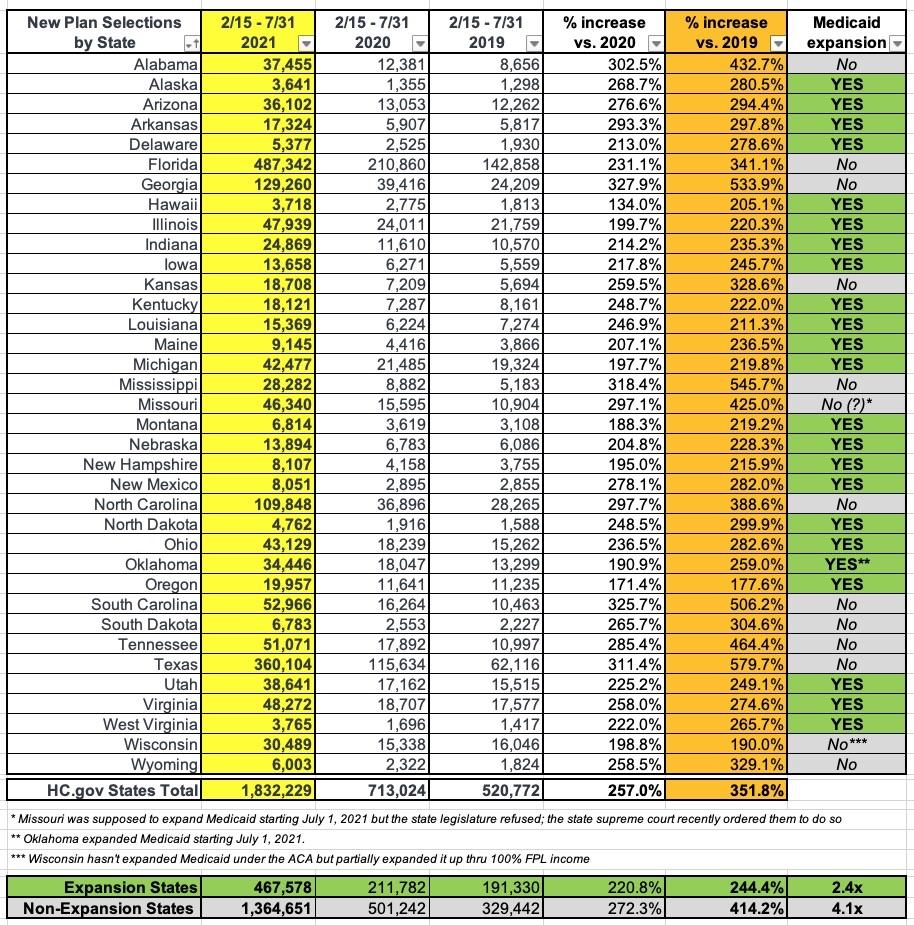
Across all 36 states, SEP enrollment is 3.5x higher than for the same period in 2019, and 2.6x higher than in 2020, showing the power of re-opening enrollment but mostly of the massively expanded/enhanced premium subsidies under the American Rescue Plan.
On average, states which have expanded Medicaid have seen SEP enrollment rates 2.4x higher than they were for the same time period in 2019, while non-expansion states are up more than 4.1x over 2019. The reason for this is the 100 - 138% FPL "overlap" population: In expansion states, those earning up to 138% FPL are shifted over to Medicaid instead, but in non-expansion states, those earning more than 100% FPL are eligible for $0 premium ACA exchange plans (again, thanks to the ARP).
As for the 723,000 state-based exchange enrollees, the press release doesn't break these out by state (unfortunately), and it also clarifies that the starting and ending dates don't necessarily quite match up with when some states started their own Special Enrollment Periods:
State-based Marketplace (SBM) States: This report refers to the 15 states with that use their own platforms for the 2021 coverage year. With some exceptions, SBMs reported new plan selection data to CMS on the number of unique consumers who didn’t have an active enrollment as of the start of the SBM’s SEP, and made a plan selection on or after the SBM’s SEP, that is active as of the end of the reporting period. Idaho’s data is reported from March 1 to April 30, 2021 and Massachusetts’s data is reported from February 1 to July 23, 2021. The end dates for both these states represent the closing date of their SEPs. In addition, some SBMs had SEP start dates prior to 2/1 for which this data does not account. Please contact the SBMs for additional information on this data metric.
I should note that I've personally confirmed at least 367,000 of the 723,000 total through 7/31 (or thru 4/30 or 7/23 in the case of Idaho and Massachusetts):
- At least 246,640 in California
- At least 20,050 in Colorado
- At least 8,670 in Connecticut
- At least 672 in the District of Columbia
- At least 3,600 in Idaho
- At least 15,150 in Maryland
- At least 12,700 in Minnesota
- At least 6,908 in Nevada
- At least 5,635 in New York
- At least 38,946 in Pennsylvania
- At least 7,824 in Washington State
That leaves nearly half the SBM total (~356,000) unaccounted for, though I assume most of that is in California and New York, with the rest scattered throughout the other SBM states.
So, what does this mean for the final SEP push (again, it runs through 8/15 in most states)?
Well, it's hard to say, but I'd imagine it'll be a bit higher than the last week of July. That would mean something like ~220,000 more QHP selections via HC.gov states, and perhaps another 85,000 or so via the state-based exchanges (assuming they still make up roughly 28% of the national total). If so, that would put the final 8/15 tally at around 2.86 million new enrollees during the 2021 COVID SEP nationally (~2.05 million via HC.gov, ~808K via the SBMs).
Advertisement
