

Boom: HC.gov announces 206K QHPs in first 2 weeks of #COVID19 Enrollment Period, over 3x traditional SEP enrollment so far
Wed, 03/03/2021 - 10:20am
Back in late January, when it became clear that the Biden Administration was planning on announcing some sort of "no excuse needed" COVID Special Enrollment Period for the federal ACA exchange, I did a little back-of-the-envelope math to try and get an idea of how many additional people might enroll via HealthCare.Gov than you'd normally see via "standard" Special Enrollment Periods.
At the time, I concluded that for a 60-day SEP of this nature (that is, one completely open to all comers regardless of whether they had a Qualifying Life Experience (QLE)or not), you might be looking at perhaps an extra 400,000 people. selecting plans during that time period. This would be on top of the 4,200/day who enrolled thru HC.gov between the end of Open Enrollment and the end of May via SEPs over the past couple of years, which would be roughly 254,000 for a 60-day period.
I freely admitted at the time that this was an extremely crude spitball estimate, based on partial data from a handful of state exchanges which did open COVID SEPs last spring/summer, and that I could be way ooff.
Sure enough, last week, Health Sherpa, one of the most popular Enhanced Direct Enrollment ACA partners (basically,private 3rd-party health insurance websites authorized to sell on-exchange ACA policies) announced that they had enrolled over 40,000 people in the first week of the COVID SEP, and that this represented "more than triple the volume" of normal SEP enrollment for them.
I used this data to estimate that, extrapolated out, total COVID SEP enrollment was likely somewhere between 160K - 250K nationally in the first week. Assuming ~72% of that is via the 36 HealthCare.Gov states, that'd be around 115K - 180K via the federal exchange for Week 1.
Well, CMS didn't release data for the first week by itself, but this morning they did release a TWO-week HC.gov COVID SEP enrollment report.
via the Centers for Medicare & Medicaid:
February 15 – February 28, 2021
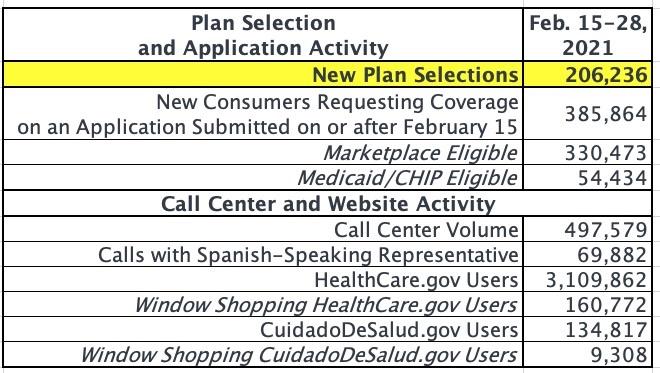
The Centers for Medicare & Medicaid Services (CMS) report that more than 206,000 Americans signed up for health insurance plans during the first two weeks of the 2021 Marketplace Special Enrollment Period (SEP) for consumers in HealthCare.gov States.
The number of new plan selections from the start of the SEP opportunity on February 15 through February 28 represents an increase from 76,000 and 60,000 consumers signing up for health insurance during the same period in 2020 and 2019, respectively.[1]In previous years, SEPs were available only for qualifying life events, whereas this year the Biden-Harris Administration opened an SEP to all Americans in response to the COVID-19 Public Health Emergency.
CMS plans to release a report on new plan selections for each month of the 2021 SEP.New plan selections are a count of unique consumers who didn’t have an active Marketplace plan as of February 14 and made a plan selection on or after February 15.
Definitions and details on the data are included in the glossary at the end of the report.

There's several important things to note here:
- First: The report clearly states that this represents new enrollees only, not current enrollees switching from one plan to another (10 of the state-based exchanges aren't allowing current enrollees to do that anyway).
- Second: 206K is 2.7x higher than the same period last year, but it's 2.9x higher when you account for the extra day (2020 was a Leap Year). And really, since the pre-COVID SEP environment was pretty much the same in both 2019 and 2020, comparing against an average of both years makes more sense. On that basis, the 206K figure is actually more than 3x higher...just as Health Sherpa suggested.
- In the normal, pre-COVID environment, HC.gov enrolled around 4,700 people per day during the off-season. This is higher than the 4,200/day mentioned above, but again, that included a much longer time period, starting on 12/15 and running through 5/31. Basically, SEP enrollment ebbs and flows at different points during the year.
- Update: it's also worth noting that only 54,000 people even applied for Medicaid or CHIP via HC.gov during the 2 weeks in question. This is partly due to 12 of the 36 states not having expanded Medicaid (see below), but mainly because most Medicaid/CHIP enrollment simply doesn't happen via ACA exchanges.
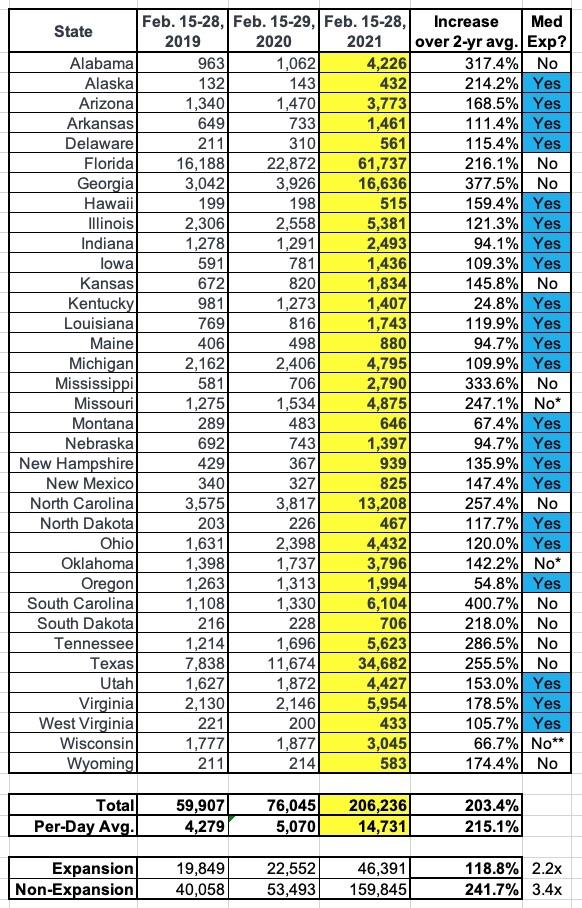
Here's the state-by-state breakout. I've included a column which compares the first 2 weeks of the COVID SEP against the average 2-week SEP enrollment from 2019 and 2020. Sure enough, it comes in at over 3x the daily average vsthe two prior years:
I should note that the only state-based exchange which has released any COVID SEP data is Washington, which reported 1,700 SEP enrollments in the first 9 days. Without knowing how many SEP enrollees they had for that period in 2019 & 2020, however, I can't really add them into the table above.
Kentucky has seen the smallest average increase (25%); South Carolina has had the largest (400%). Of course, this could be backwards: It's possible that Kentucky had higher than average and South Carolina had lower than average SEP enrollments in prior years for whatever reason, thus resulting in the increases seeming lower/higher than the norm. I'd have to compare each state in more detail to figure that out.
UPDATE: I've updated the table above after Andrew Sprung of Xpostfactoid once again reminded me that Medicaid expansion is the obvious source of the discrepancy. Kentucky expanded Medicaid under the ACA; South Carolina didn't. When you group Expansion vs. Nonexpansion states together, the difference is clear: Expansion states saw SEP enrollments increase by 2.2x on average, while Nonexpansion states saw a 3.4x increase.
When you subtract those who would have enrolled via "normal" SEPs anyway, that leaves nearly 141,000 COVID SEP-specific enrollees in the first two weeks, or around 10,000/day via HC.gov.
Assuming that HC.gov enrollment represents the same 72% of national enrollment that it did during the official Open Enrollment Period, that suggests around 286,000 total QHP selections nationally (~20,400/day), or around 196,000 more than you'd normally expect (~14,000/day).
Assuming this pace were to hold steady for the full 93-day COVID SEP (which is unlikely; again, it will probably ebb and flow as time goes on), that would translate into something like:
- HC.gov: 1.37 million (937,000 more than normal)
- National: 1.90 million (1.3 million more than normal)
Of course, all of this is BEFORE the American Rescue Plan is passed and signed into law, with significantly beefed-up and expanded subsidies; once/assuming that happens, the numbers could increase substantially further. Stay tuned...
Update: As noted above, Medicaid expansion states have only increased average SEP enrollment by around 2/3 as much as Non-expansion states. Since all 15 state-based exchanges have expanded Medicaid, this suggests that the 206K via HC.gov probably represents more like 80% of the total, meaning perhaps 258,000 nationally (~168,000 more than average).
If so and if the pace continued at that rate, that would mean something like 1.71 million by 5/15, or 1.1 million more than average.
Advertisement
