ACA Repeal Impact

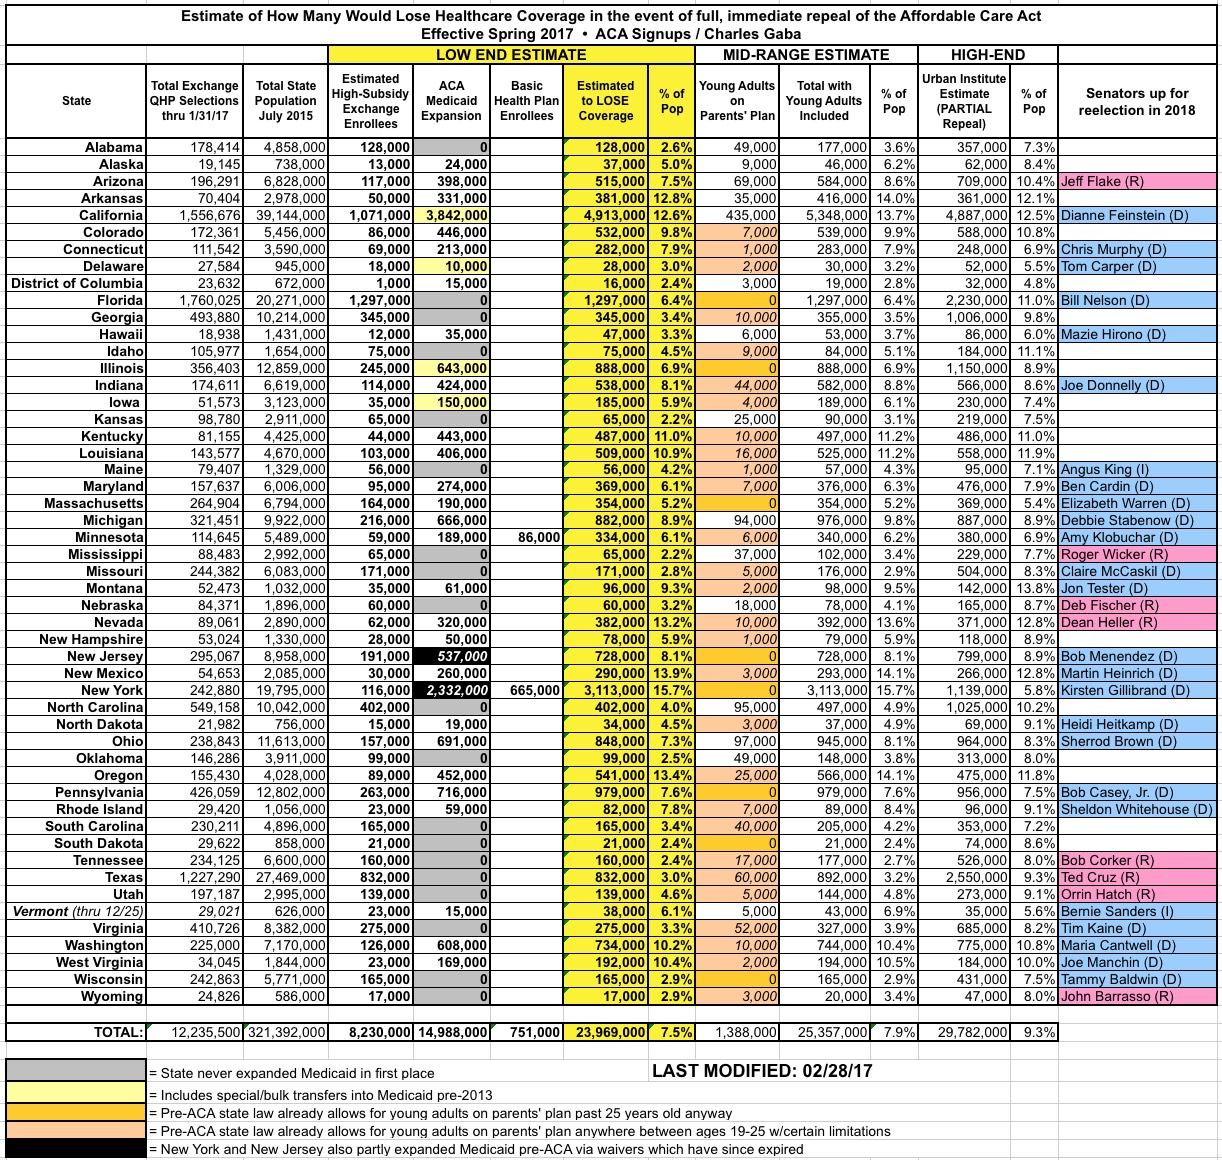
UPDATE 1/17/16: This morning the Congressional Budget Office released their projections of how many people would likely lose healthcare coverage if the GOP proceeds with a partial repeal of the Affordable Care Act. My state- and county-level estimates assume a full repeal (including wiping out regulations like guaranteed issue, community rating and so forth), which I estimate would add up to around 24 million people without including "Young Adults on Parents' Plans", or around 25.3 million with them included.

The CBO's projection, however, like the Urban Institute's, assumes a partial repeal, which would remove Medicaid expansion, federal subsidies and the individual/employer mandate penalties...but would leave the rest in place. This would actually have a more devastating impact, as it would decimate the off-exchange (full-price) individual market as well. They project around 32 million people losing coverage by 2026 under this scenario...or roughly 8 million more individual market enrollees than the 8.9 million I'm estimating under the full repeal scenario.

Of course, the number of off-exchange indy plan enrollees varies widely from state to state and even county to county, but if you want to get an idea of how the state/county-level numbers would look under the CBO "partial repeal" projection, simply double the number of individual market enrollees to each state/county.

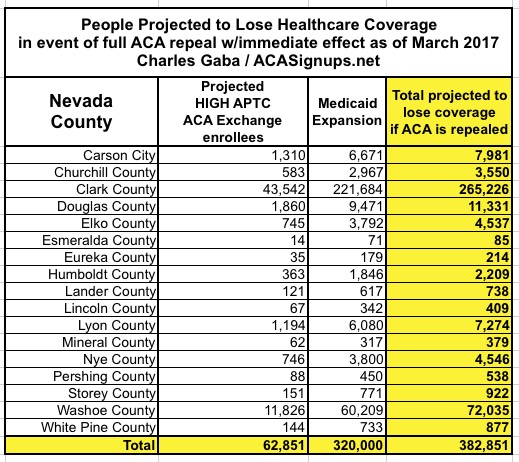
For instance, in Oakland County, Michigan, my estimate is ~35,000 highly-subsidized exchange enrollees and ~53,000 Medicaid expansion enrollees, or around 88,000 total. Under the CBO's projection, I'd add roughly 35,000 more off-exchange and unsubsidized on-exchange enrollees, for a total of ~123,000 people losing coverage.

Alternately, you could just increase the TOTAL number for each state by around 1/3 to get a rough idea of the maximum possible devastation.

I've pulled together all of my state/county-level breakout entries into a single location (scroll down for links to individual states). This way people can look up specific states to see what the potential impact of the ACA being repealed would be in terms of people losing their healthcare coverage. I even added this link to the main menu above.

Remember: I'm only including those who I expect could lose their coverage, not the impact to Medicare, pre-ACA Medicaid, Group Coverage and so on.

Some important caveats which apply to all county-by-county breakouts, and a few which only apply to specific states:

YOUNG ADULTS ON PARENTS' PLANS:

  • In the full 50-state summary, I include an extra column for "Young Adults on their Parents' Plan"; there's around 3.1 million of these folks nationally. I only estimate around 1.4 million of them are actually at risk of losing their current policy coverage because about 2/3 of the states already had a similiar law on the books at the state level prior to the ACA, though the specific provisons and cut-off ages varied. I've taken my best guess at how many wouldn't be protected by pre-existing (hah!) laws.
  • In addition, I have no county-level data whatsoever for the "Young Adult" numbers. Since this is probably the most likely part of the ACA to survive any repeal/replacement anyway, I've chosen to leave this category off of the individual state tables altogether.

MEDICAID EXPANSION:

  • In nearly all ACA Medicaid expansion states, these are hard numbers taken directly from the state public health department websites, quarterly/monthly reports and so on. The "as of" date varies from state to state, but all are within the past year.
  • For Arizona, the county-level Medicaid data wasn't split between "traditional" and "ACA expanded", but statewide, expansion enrollees make up about 21% of the total, so I'm assuming 21% of each county's Medicaid enrollees are expansion-specific.
  • Louisiana just launched ACA expansion in July, and has already signed up 374,000 people...who might be kicked right back off again.
  • New York and New Jersey's ACA expansion numbers are a bit complicated: Both states had already partly expanded Medicaid before the ACA using a waiver arrangement with the federal government. Then the ACA expanded Medicaid a bit further in each state. Then the original waiver expired...but no one bothered renewing them since the ACA made it moot anyway. This means that if the ACA actually is repealed, not only would those made eligible for Medicaid in each state be kicked off, but so would everyone enrolled via the now-expired waiver.

PRIVATE PLANS VIA THE ACA EXCHANGES:

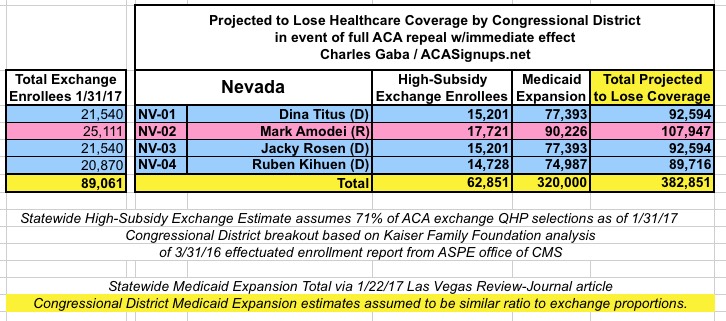
  • The Centers for Medicare & Medicaid provided a handy county-level ACA exchange enrollment breakout for the 38 states which were handled by HealthCare.Gov last year. This includes the total number of people who selected Qualified Health Plans (QHPs) via HC.gov as of 2/01/16. For each county, I start with that number, then modify it via several steps:
  1. First, I multiply it by the projected increase (or in some cases, decrease) in total QHP selections by the end of January.
  2. I then take the percentage in each county expected to receive Advance Premium Tax Credits (APTC) (ie, federal subsidies), since those paying full price now are unlikely to lose their coverage (Note: I'm assuming the entire individual market won't collapse, which is also a distinct possibility)
  3. I then lop 10% off of that number to account for those who simply never end up paying their first month's premium to begin with, and are thus never enrolled in the first place
  4. Finally, I reduce that number by another 10% to remove those who are only receiving nominal subsidies, and who therefore would likely be able to suck it up and hold onto their policies.

For example: Let's suppose that in a given county, 10,000 people selected QHPs during open enrollment last year, of which 85% received subsidies, in a state where I expect about 5% growth this year.

My estimate would be: 10,000 x 1.05 x 0.85 x 0.90 x 0.90 = 7,229 people enrolled, effectuated & receiving subsidies high enough that they'd be seriously screwed if taken way.

  • I've found county breakouts for some of the remaining 12 states, but not others; like the Medicaid numbers, some are elusive.

Finally, there's no need to "break out" the District of Columbia numbers; I assume the whole District is basically considered a single county.

Over the past month or so, I've been tallying up the number of people who would lose their healthcare coverage if and when the GOP actually does proceed with repealing the Affordable Care Act, breaking the totals out by both County and Congressional District in every state.

While this project has received high praise as a useful resource, one problem with it is that the numbers aren't static--between the high churn rate of the individual market and Medicaid, as well as the fact there's no limited enrollment period for Medicaid (you can sign up year-round), the enrollment figures are constantly changing.

Case in point: As of January 20th,, roughly 706.000 Pennsylvanians were enrolled in ACA Medicaid expansion. As of February 17th that number had increased to over 716,000.

I don't have a county-level breakout of the updated number, but I'm assuming that each county/congressional district has increased roughly proportionately:

Over the past month or so, I've been tallying up the number of people who would lose their healthcare coverage if and when the GOP actually does proceed with repealing the Affordable Care Act, breaking the totals out by both County and Congressional District in every state.

While this project has received high praise as a useful resource, one problem with it is that the numbers aren't static--between the high churn rate of the individual market and Medicaid, as well as the fact there's no limited enrollment period for Medicaid (you can sign up year-round), the enrollment figures are constantly changing.

Case in point: Just two weeks ago, roughly 400.000 Louisianans were enrolled in ACA Medicaid expansion. As of yesterday that number had increased to nearly 406,000.

I'm updating the spreadsheet versions now, but in the meantime, here's the latest county-level breakout:

Massachusetts is, in many ways, the birthplace of the Affordable Care Act (Obamacare), which was largely based on "RomneyCare"...the healthcare reform system established by GOP Governor Mitt Romney back in 2006. It is therefore either completely fitting or highly ironic that Massachusetts is also the last state that I've analyzed to figure out just how many people would likely lose healthcare coverage if and when the ACA is indeed fully repealed without a reasonable replacement policy immediately in place.

Nevada's Medicaid expansion data has been tricky to track down; the most recent hard number I had until now was 187,000 people statewide, and that was as of September 2015. According to this January 2017 article in the Las Vegas Review-Journal, however, that number has since grown to around 320,000 Nevadans.

In Nevada, , 89,000 people enrolled in exchange policies as of the end of January. Of these, I estimate around 62,000 of them would be forced off of their private policy upon an immediate-effect full ACA repeal, plus the additional 320,000 enrolled in Medicaid expansion, for a total of 382,000 Nevadans kicked to the curb.

The last official ACA Medicaid expansion enrollment number I have recorded for Indiana (via their modified "Healthy Indiana 2.0" program) was 290,000 people way back in July 2015. At the time, the maximum potential HIP 2.0 enrollment total was 680,000 Hoosiers, made up of 350,000 newly covered plus another 330,000 being transferred over from the HIP 1.0 program.

This NPR article from a couple of weeks ago states that as of January, "the Healthy Indiana Plan that he established in 2015 as the state's governor has brought Medicaid coverage to more than 350,000 people." However, that number is a bit confusing given that they were also supposedly transferring the other 330K over from the other program as well. I'm not sure if 350K refers to total HIP 2.0 enrollment or only those who were previously uninsured.

UPDATED 2/19/17 with more recent data (final OE4 exchange enrollment data & February 2017 Medicaid expansion data):

Louisiana just expanded Medicaid via the Affordable Care Act last July, and as of Februay 16th had over 400,000 residents enrolled in the expansion program. All of those people would be kicked right back off of that coverage again if the ACA is repealed. In just 7 1/2 months...

  • 58,713​ Adults have received preventive healthcare or new patient services

In Connecticut111,541 people selected Qualified Health Plans during the 2017 Open Enrollment Period. Of these, 76% are receiving financial assistance; of those, I estimate around 69,000 will actually pay their premiums and receive significant tax credits. In addition, the CT Dept. of Social Services just confirmed 213,000 CT residents enrolled in Medicaid via ACA expansion. That's a total of 282,000 CT residents who would likely lose coverage if the ACA is fully repealed without a reasonable replacement on hand.

For the individual market, my standard methodology applies:

IMPORTANT: This is my county-level estimate for California. The congressional district breakout will be following soon.

Update 2/17/17: (SEE BELOW: CONGRESSIONAL DISTRICT BREAKOUT ADDED!!)

Regular readers know that I started out the "How Many Could Lose Coverage..." project at the state level, then moved into analyzing the county-level data, before finally tackling the hardest challenge: Breaking them out by Congressional District.

The state level table includes all 50 states (+DC), while I managed to break out the county level data for 34 states so far before moving into the Congressional District analysis by popular demand. There, I've managed to crunch the numbers for 43 states so far.

MAJOR UPDATE 3/22/17: As I've noted repeatedly, my estimates of how many people are at risk of losing their coverage has always been based on the assumption of full repeal with immediate effect and, most importantly, no replacement healthcare policy whatsoever. I had to do it this way at first because there was no Republican replacement plan available until a couple of weeks ago. Then, when the AHCA plan was released, I didn't have the time or expertise to properly overhaul my projections accordingly.

Fortunately, the Center for American Progress does have the time, manpower and expertise to do exactly this. They crunched the numbers and, based in part on the recent Congressional Budget Office scoring of the AHCA, put together their own fully-detailed analysis of what impact partially repealing the ACA by passing the AHCA would have on coverage losses.

In light of this, at this point you can pretty much ignore everything below, as it no longer applies; the question is no longer "what happens if the ACA is repealed without anything replacing it?" but rather "what happens if the ACA is partially gutted and replaced with the AHCA?"

The amazing thing is that the grand total number losing their coverage would be virtually identical in either scenario! The numbers vary widely from state to state and district to district, but when you add it all up, it still comes in at around 24 million people either way!

Anyway, I've put together SIDE BY SIDE COMPARISON TABLES for each state here.

Unfortunately, due to the sheer amount of time it would take to do so, and the fact that the House is voting on the AHCA tomorrow (Thursday, 3/23), I don't have time to completely update/overhaul the Google Docs version of this data.

In Arkansas70,404 people enroll in private exchange policies as of the end of January. I estimate around 50,000 of them would be forced off of their private policy upon an immediate-effect full ACA repeal, plus another 331,000 enrolled in Arkansas' "Private Option" ACA Medicaid expansion program for a total of 380,000 residents kicked to the curb.

As for the individual market, my standard methodology applies:

  • Plug in the 2/01/16 QHP selections by county (hard numbers via CMS)
  • Adjust for 1/31/17 QHP selections based on hard CMS data.
  • Knock 10% off those numbers to account for those who never end up paying their premiums
  • Multiply the projected effectuated enrollees as of March by the percent expected to receive APTC subsidies
  • Then knock another 10% off of that number to account for those only receiving nominal subsidies
  • Whatever's left after that are the number of people in each county who wouldn't be able to afford their policy without tax credits.

The Medicaid expansion data comes directly from state data.

Pages

Advertisement