

GET YOUR DATA GEEK ON: Final OE3 ASPE Report released (PART ONE)
Fri, 03/11/2016 - 2:13pm
A couple of weeks ago, I noted that the final, official ASPE report for the 2016 Open Enrollment Period was running quite a bit later than it did the first two years: In 2014 it was released either 12 or 16 days after open enrollment ended (OE1 ended on 4/15 but the report covered an additional 4 days), while last year it was also released 16 days after the end of the 2015 season.
For whatever reason, it took a full 40 days for the ASPE report to be released this year, but whatever; let's dig in!
First, it's worth remembering that the HHS Dept. included 1 extra day this year (Feb. 1st) for HC.gov as well as 4 of the state exchanges to account for some "in line by midnight" enrollees:
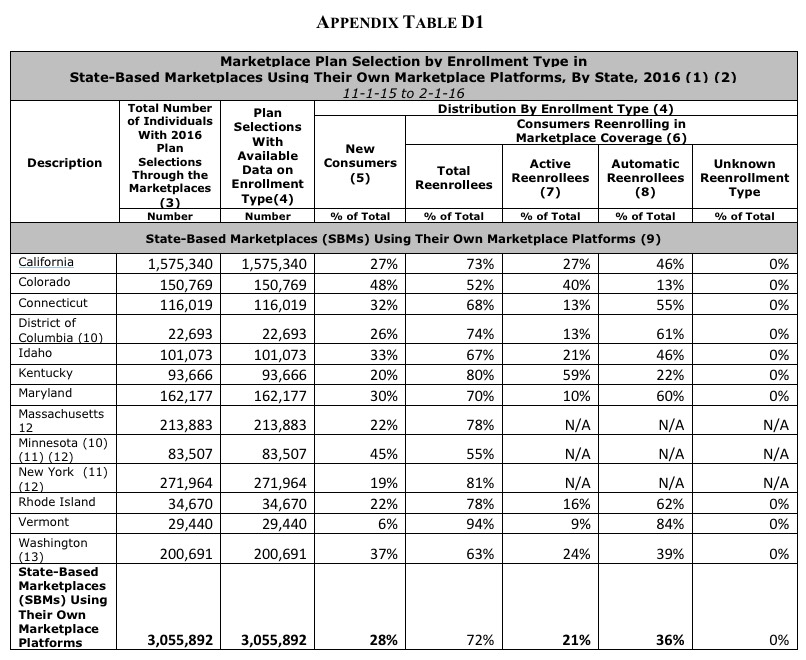
For purposes of this Enrollment Report, an effort was made to align the reporting periods for the HealthCare.gov states and SBMs using their own Marketplace platforms with the reporting periods for the data that were included in the Week 13 CMS Marketplace Enrollment Snapshot (which can be accessed here). Most of the data in this report are for the 11-1-15 to 2-1-16 reporting period with the following exception: the data for 9 SBMs that are using their own Marketplace platforms (California, District of Columbia, Idaho, Kentucky, Maryland, New York, Rhode Island, Vermont, and Washington) are for the 11-1-15 to 1-31-16 reporting period.
Having said that, the biggest top-line data point, of course, is the grand total: 12,681,874 QHP Selections
...which happens to be almost identical to the number that I had as of this morning: 12,668,585.
So, where did the additional 13,289 end up? Unfortunately, the ASPE report doesn't seem to actually break out the state-based exchange numbers, only the 38 states on the federal exchange (FFM). I'll have to look into that some more in a bit, although I'm guessing about 5,000 of it should be found in Vermont since they're the only state which hasn't had any numbers released since late December.
2:52pm: OK, hold on, I've just been sent the link to the supplemental ASPE report which includes the state exchange breakout as well:
OK, the numbers in Connecticut, New York and Rhode Island match up with what I already had, but here's where the differences are:
- CA: I had 1,572,074; official number: 1,575,340 (3,266 higher)
- CO: I had 153,583; official number: 150,769 (2,814 lower)
- DC: I had 22,912; official number: 22,693 (219 lower)
- ID: I had 102,353; official number: 101,073 (1,280 lower)
- KY: I had 93,687; official number: 93,666 (21 lower)
- MD: I had 165,123; official number: 162,177 (2,946 lower)
- MA: I had 196,554; official number: 213,883 (17,329 higher)
- MN: I had 85,390; official number: 83,507 (1,883 lower)
- VT: I had no idea, since they've never released any data this year; actual number was 29,440
- WA: I had 200,000 even (rounded); official number: 200,691 (691 higher)
There are any number of reasons for most of these discrepancies; clerical errors, slight variances in the reporting dates of the state exchange reports vs. the ASPE report and so on, but the practically all of the difference can be found in Massachusetts, where the official number came in over 17,000 higher than I had thought, more than cancelling out all of the other states combined.
I'll be plugging the official, final numbers in the updated state-by-state tables soon, but one thing which jumps out at me immediately is that in the end Vermont actually enrolled fewer people in exchange policies than they did last year...which in turn was fewer than they had enrolled in 2014. VT is the only state which has enrolled fewer people two years in a row, which many will no doubt find ironic given their failed attempt at moving to single payer last year.
Meanwhile, in these big reports, the footnotes are often very important. For instance:
2 Minnesota and New York have begun enrolling individuals in a Basic Health Plan. These individuals are not included in reports of total Marketplace plan selections for these states.
Yup. About 33,000 people in Minnesota and 380,000 New Yorkers enrolled in the BHP program, which is sort of halfway between Medicaid and the Qualified Health Plan, so if you want to include them with the total, it's more like 13.1 million this year. That's a matter of perspective, of course.
3 The data in this report reflect the total number of plan selections cumulatively from the beginning of Open Enrollment to the end of the reporting period, net of any cancellations from a consumer or cancellations from an insurer during that time. Because of further automation in communication with issuers, the number of net plan selections reported this year account for issuer initiated plan cancellations that occur before the end of Open Enrollment for reasons such as non-payment of premiums. This change will result in a larger number of cancellations being accounted for during Open Enrollment than last year. Last year, these cancellations were reflected only in reports on effectuated enrollment (the number of people who have paid monthly premiums to the insurer) after the end of Open Enrollment.
As I noted repeatedly during OE3, this is incredilbly important: In 2014 and 2015, the Grand Total included every QHP Selection regardless of whether the enrollee actually went on to pay their first premium or otherwise had their policy cancelled before coverage even started. That's why you saw such a dramatic drop last year from the 11.7 million official number on 2/22/15 to just 10.2 million actually effectuated as of 3/31/15, a mere 5 weeks later. This made it appear as though a whopping 1.5 million people dropped their exchange policies all at once in March, when in fact a good portion of them had actually already been cancelled/voided/purged/whatever back in December (before their coverage had even started).
This year, at least on the federal exchange, they've managed to improve their APIs/data sharing with the insurance carriers to the point that they were able to subtract at least some of the "pre-purged" policies during open enrollment instead of including them until after the dust settled...to the tune of at least 300,000 people across the 38 HC.gov states.
In other words, an apples to apples comparison between OE3 and OE2 (including BHP enrollees for both years) would actually be:
- 12,681,874 QHP selections, plus
- 379,559 BHP enrollees in New York, plus
- 33,333 BHP enrollees in Minnesota, plus
- 288,053 "pre-purged" QHP selections via HC.gov
- = 13,382,819 for 2016
...versus 11,688,074 QHP selections + 26,891 BHP enrollees in Minnesota = 11,714,965 for 2015.
That means that 1,667,854 more people actually selected QHPs or BHPs during open enrollment this year than last year.
What does this mean for the upcoming 3/31/16 effectuated enrollment number? Well, again, last year around 1.5 million of those 11.7 million were scrubbed from the total by the end of March. This year, assuming a similar 13% drop, there should be right around 11.2 million people still enrolled as of March 31st. Anything higher than that would be outperforming last year; anything below that would be underperforming.
Which brings me to...
4 This report does not include data on effectuated enrollment. The Centers for Medicare & Medicaid Services (CMS) will be publishing data on effectuated enrollment for the 2016 coverage year separately. The most recent CMS quarterly snapshot on effectuated enrollment in the Marketplaces is available at https://www.cms.gov/Newsroom/MediaReleaseDatabase/Factsheets/2016-Fact-s....
HELLO! Yes, that's right, CMS is doing a massive data dump today; they've also released the December 31st effectuated enrollment report, which I'll be looking at a little later.
OK, moving on...here are the key highlights according to HHS itself:
- About 12.7 million individuals selected, or were automatically reenrolled into, a 2016 Marketplace plan (including 4.9 million new consumers and 7.8 million that reenrolled) as of 2-1-16.
OK, so now we have the answer: 7.8 million renewals + 4.9 million new additions. Here's how this compares with my own estimates and those of HHS:
- Renewals: I assumed 9.0 million; HHS had a mid-range of 8.1 million. Actual: 7.8 million.
- New Additions: I assumed 5.7 million; HHS had a mid-range of 4.5 million. Actual: 4.9 million.
As I've noted before, after two years of nailing practically every metric accurately to within a few percent, the HHS Dept. has finally gotten more accurate than I am at making enrollment projections. They overshot on renewals and underestimated on new additions, but overall they nailed it (12.6 million vs. 12.7 million), while I overshot by about 1.7 million when you take the "pre-purge" factor into account. Kudos to them.
- More than 3.5 million individuals who selected, or were automatically reenrolled in, a 2016 Marketplace plan are ages 18 - 34 (28 percent of total plan selections).
Well, this answers my question from back in January: No, the Young Invincibles didn't come to the rescue risk pool wise. 28% of enrollees were in the 18-34 range in 2014, 28% in 2015 and, yes, 28% in 2016 as well. It seems that 28% is the magic number, like it or not, unless something changes dramatically in the future.
- Almost 10.5 million individuals who selected, or were automatically reenrolled in a 2016 Marketplace plan qualify for the advance premium tax credit (tax credit or APTC) to make coverage more affordable.
Again, that's around 83% of the total nationally. This has been pretty consistent for 3 years running, with anywhere from 82 - 85% of exchange enrollees receiving APTC assistance.
For the 38 states using the HealthCare.gov eligibility and enrollment platform:
- More than 8 in 10 individuals (more than 8.1 million, or 85 percent) who selected or were automatically enrolled in a 2016 Marketplace plan qualify for an advance premium tax credit9 with an average value of $290 per person per month.
- The average advance premium tax credit covers about 73 percent of the gross premium for individuals who qualify for an average advance premium tax credit.
- The average net premium after advance premium tax credit is $106 per month among individuals with 2016 plan selections through the Marketplaces in the HealthCare.gov states who qualify for an advance premium tax credit.
- Nearly 7 in 10 of the consumers who selected, or were automatically enrolled into, a plan in the HealthCare.gov states had the option of selecting a 2016 Marketplace plan with a net premium of $75 or less per month after the advance premium tax credit.
- HealthCare.gov users are actively shopping and saving money. More than 3.9 million people (or 70 percent) who reenrolled actively selected a plan. Of those actively reenrolling, 61 percent switched to a different plan than they had in 2015.
- More consumers switched issuers than metal level. Specifically, 64 percent of the 5.6 million switchers changed issuers during the 2016 OEP (with or without changing their metal level), while only 31 percent of switchers changed metal level (with or without changing their issuer).
This last data point is a bit silly to make hay of in my opinion. Part of the reason so many people "changed issuers", of course, is because a dozen Co-Ops melted down and were no longer on the exchanges, meaning that a good 800,000 people (or 10.2% of all 7.8 million renewing) had to switch issuers, assuming every one of them stayed on the exchange (not all did, of course).
As for the HC.gov / State Exchange ratio, it stayed almost identical to last year, 76% / 24%:
- More than 9.6 million individuals selected or were automatically reenrolled in 2016 plans through the Marketplaces in the 38 states that are using the HealthCare.gov eligibility and enrollment platform (see Table 1).
- About 3.1 million individuals selected or were automatically reenrolled into 2016 plans through the Marketplaces in the 13 states (including DC) that are using their own Marketplace platforms.
The only shift this year was Hawaii moving to HC.gov, but it's such a tiny state that it didn't make any difference. Next year, Kentucky moving to HC.gov will bump the federal exchange's percentage up slightly, to perhaps 77%, but that's about it. Overall it's still roughly a 3:1 split.
"Figure 1" on Page 7 of the ASPE report should look pretty familiar to those familiar with this site:
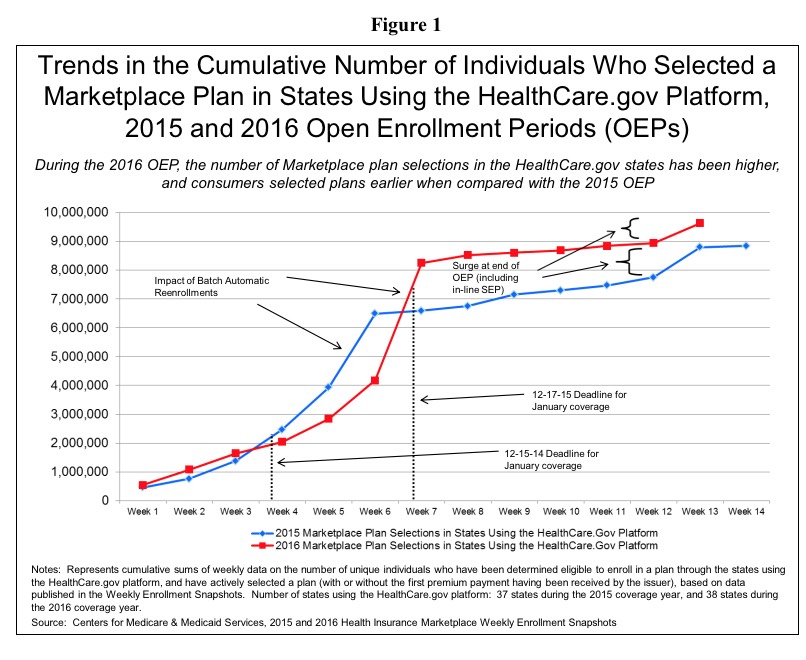
As ASPE and myself have noted, with more people renewing each year, the percentage of the total enrollment which is coming in before January keeps increasing:
The proportion of consumers who selected or were automatically reenrolled in a Marketplace plan during the early part of the OEP was higher during the 2016 OEP (86 percent) when compared to the 2015 OEP (73 percent)16 (see Figure 2).
This is actually fine, although only if the total number keeps increasing as well. This is one of the main reasons why, starting in 2019, Open Enrollment will be shortened even further, to November 1st - December 15th. HHS figures that after 5 years of going through the process, Americans will finally have become familiar/comfortable enough with the process to cut the period down to the same 6-week period typical of open enrollment at most large corporations now.
OK, that's it for now...gotta make some phone calls and eat something...look for Part 2 later on this evening...
UPDATE: Obviously I didn't get around to Part Two over the weekend...I hope to have it done later on today (Monday)...
Advertisement
