Since I've been neglecting other ACA/healthcare posts the past couple of weeks, I figured I should at least provide regular updates on why I've been mostly absent.
I've made major progress in updating and revising my breakout of COVID-19 cases and fatalities at not just the state level but the county level. Again, I've separates the states into two separate spreadsheets:
My county-level tracking project continues. I've now plugged in confirmed/official COVID-19 cases and fatalities across 26 states and hope to bring the remaining 24 states (plus the U.S. territories) up to date within the next few days.
Meanwhile, here's how cases have spread on a per capita basis across those 26 states from March 20th until May 23rd. At the high end, I haven't gotten to the worst-hit states yet (New York, New Jersey, Massachusetts & Rhode Island), which wouldn't fit on this chart anyway; at the lower end, once you get below Alabama, there's a cluster of states which are difficult to separate out at this level as they're running so close together.
Just as important as the infection rate itself, of course, is the curve of the line. Louisiana and Michigan were hit hard early on, but seem to be flattening their curves, while states like Minnesota, Iowa and Alabama, which were hit later, are starting to curve upwards now, definitely the wrong direction.
I've made major progress in updating and revising my breakout of COVID-19 cases and fatalities at not just the state level but the county level. Again, I've separates the states into two separate spreadsheets:
Most of the data comes from either the GitHub data repositories of either Johns Hopkins University or the New York Times. Some of the data comes directly from state health department websites.
I hope to fill in the back-data for every state within the next few days, bringing them all up to date. This should allow for plenty of interesting analysis of trends and counties to keep an eye on. It will also allow me to get back to posting more regular ACA policy updates/etc.
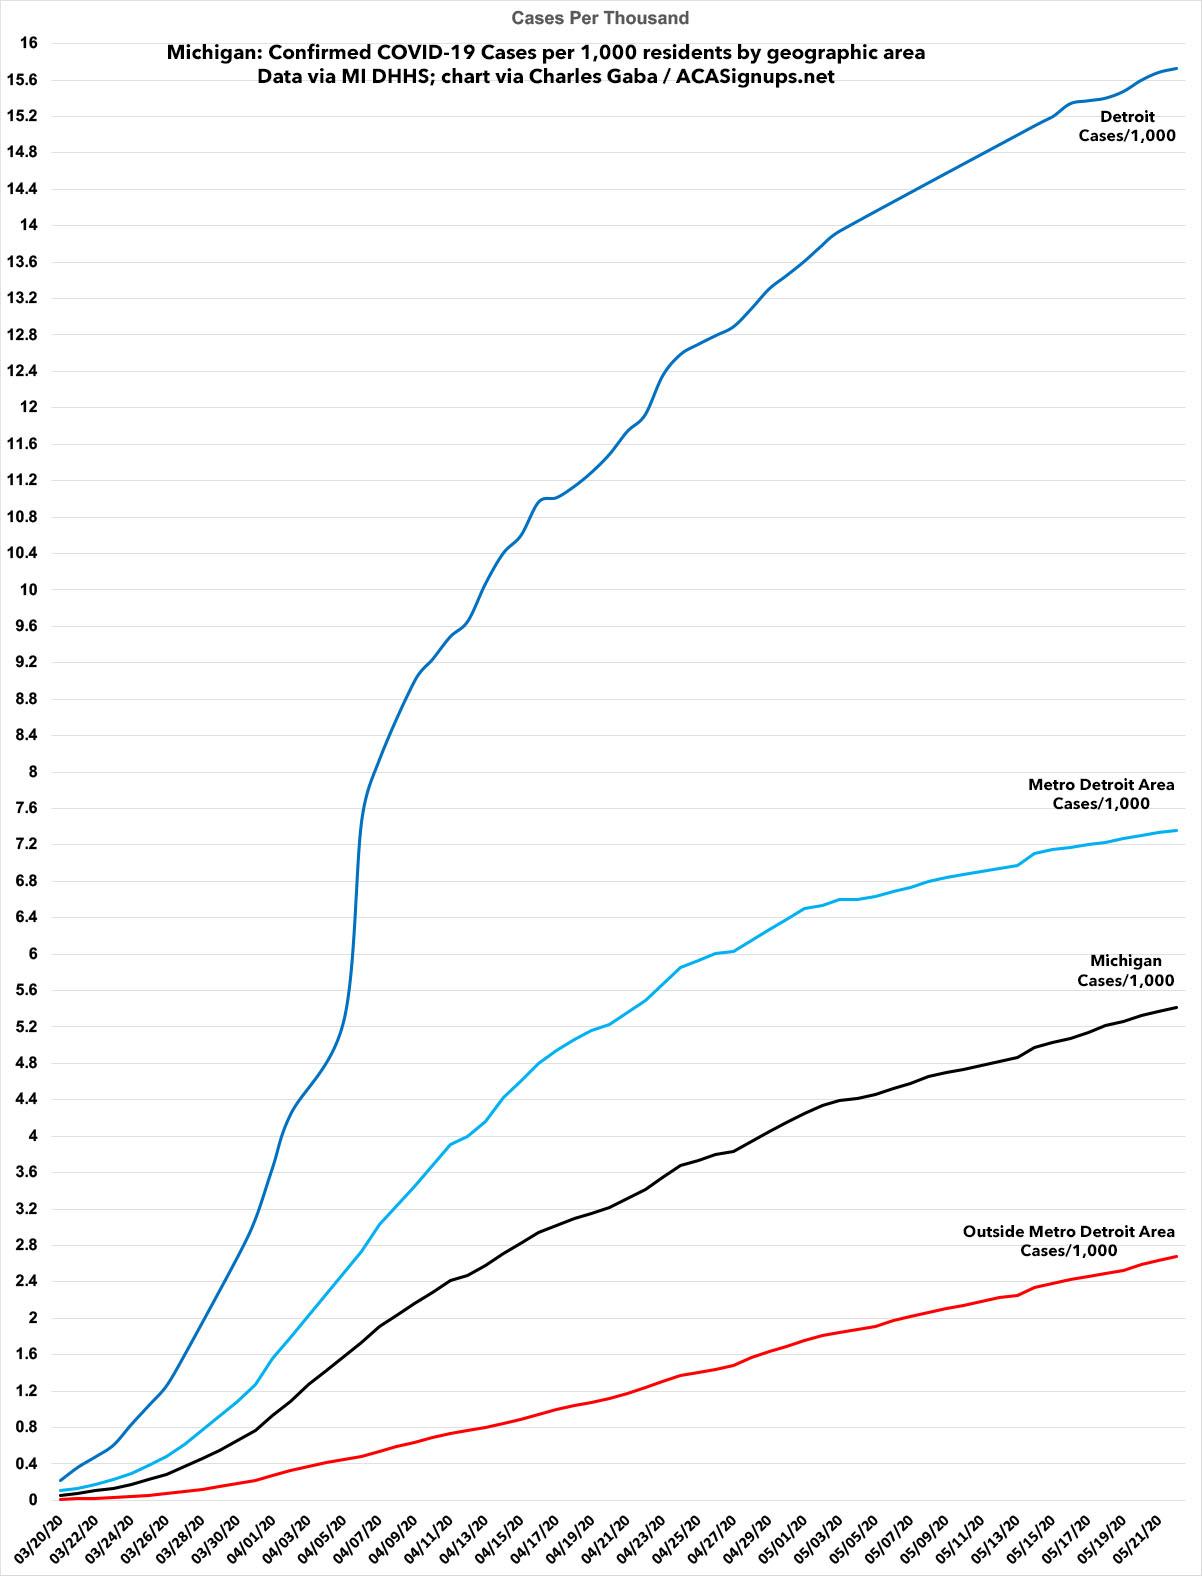
As a follow-up to my prior posts about the urban/rural divide of how COVID-19 has spread throughout Michigan, here's a graph which shows how it's spread in Detroit, the larger Metro Detroit area and the rest of the state on a per capita basis over time.
Obviously the probem is still far worse in Detroit and the Metro Detroit area overall...but the case trendlines are starting to flatten in Detroit and Metro Detroit, while it's still increasing at the same rate or higher in the rest of the state.
Massachusetts Health Connector continues extended enrollment as nearly 45,000 people enroll in new plans, update current coverage
April 28, 2020 – The Massachusetts Health Connector continues to help people who need health insurance after losing coverage or income due to the coronavirus, with a May 23 deadline ahead for June 1 coverage.
Silver State Health Insurance Exchange enrolls 5,479 during Exceptional Circumstance Special Enrollment Period in Response to COVID-19
Carson City, Nev. – The Silver State Health Insurance Exchange (Exchange), Nevada’s state agency that helps individuals secure budget-appropriate health coverage through the online marketplace and State Based Exchange (SBE) platform, Nevada Health Link, enrolled 6,017 Nevadans during its limited-time Exceptional Circumstance Special Enrollment Period (SEP), March 17 – May 15, including 5,479 new consumer enrollments related to the Exceptional Circumstance Special Enrollment Period, and 538 enrollments due to loss of Minimum Essential Coverage (MEC).
In response to Governor Sisolak’s March 12 Emergency Declaration, the SEP was opened to allow qualified Nevadans who missed OEP to secure health care coverage. Consumers who enrolled on or before April 30 received coverage effective May 1, and consumers who enrolled between May 1 and 15 will have coverage effective June 1, 2020.
Since I've been neglecting other ACA/healthcare posts the past couple of weeks, I figured I should at least provide regular updates on why I've been mostly absent.
I've made major progress in updating and revising my breakout of COVID-19 cases and fatalities at not just the state level but the county level. Again, I've separates the states into two separate spreadsheets:
On May 21, 2020, the Health Connector announced in an Administrative Bulletin an extension to the extended enrollment period in response to the coronavirus (COVID-19) emergency through June 23, 2020 to assist uninsured Massachusetts residents seeking health coverage. (The extended enrollment period was previously set to end May 25.)
If you apply coverage under this special enrollment, the deadlines to complete enrollment are as follows:
Coverage Start DateEnrollment Deadline
Coverage Start Date: June 1st: Enrollment Deadline: May 23rd
Coverage Start Date: July 1st: Enrollment Deadline: June 23rd
Please note that if you are eligible to enroll due to normal special enrollment period rules, you can select the one that applies when you complete your application.
I've been spending a lot of time working on my county-level COVID-19 tracking project the past few weeks. I'm happy to report that I've managed to plug in the county-level case and fatality data for every thirteen states so far, so I figured this would be a good time to post a visual showing how the virus has spread over time across them in cases per capita (actually cases per thousand residents).
This is a much more useful measure than the raw number of cases since the population of each state (and county) varies so widely.
The states I've completed don't follow any particular pattern...aside from Michigan (which I started with because I live here, of course), the others are simply the states which I was able to get ahold of historic case/death toll data for from March 20th until today. Other states will follow as I complete backdating the data into the spreadsheets.