

North Carolina: Trump wants the RNC to go on in North Carolina, #COVID19 be damned. Let's take a look.
Tue, 05/26/2020 - 4:56pm
My obsession with tracking COVD-19 cases and fatalities at the county level including the partisan divide continues (and before anyone gets on my case about that, the New York Times just did a massive feature on this exact political angle yesterday, which I'll be writing about tomorrow).
I took a look at North Carolina several weeks ago, but the data is obviously completely out of date by now, and it was only partial even then. Today I have confirmed case and fatality data for every county in North Carolina from March 20th through yesterday (May 25th)...and the state is very much in the news today because Donald Trump has apparently declared that the Republican National Convention, currently scheduled to happen in Charlotte, NC, must go on...and it must go on in person, with up to 20,000 Trump supporters crammed into an indoor convention center in the middle of a global pandemic.
Welp.
With that in mind, let's take a look at how North Carolina is doing in terms of the COVID-19 crisis. Here's three graphs which paint the picture.
Frist, let's take a look at how many confirmed cases NC has per capita. The per capita caveat is vitally important, since it's meaningless to compare the raw number of cases in one state vs. another when they have widely different populations. In the first graph I compare both North Carolina as a whole and Mecklenburg County (which is where Charlotte is located) to 8 other states to give a feel for how they're doing. Note that I haven't included any of the states with truly ugly numbers (New York, New Jersey, Massachusetts, Rhode Island, Louisiana) in the interst of space...they wouldn't fit on this chart at all:

As you can see, comparatively speaking, NC (and Mecklenburg County itself) isn't doing too badly yet overall, but the curve is going in the wrong direction. Instead of curving downwards ("flattening the curve") like Michigan and Washington State are doing, or even holding at a steady rate as Texas, Wyoming or Pennsylvania are, North Carolina/Mecklenburg seem to be curving upwards, at roughly the same pace as Wisconsin. This isn't as bad as Minnesota, but it's still not good.
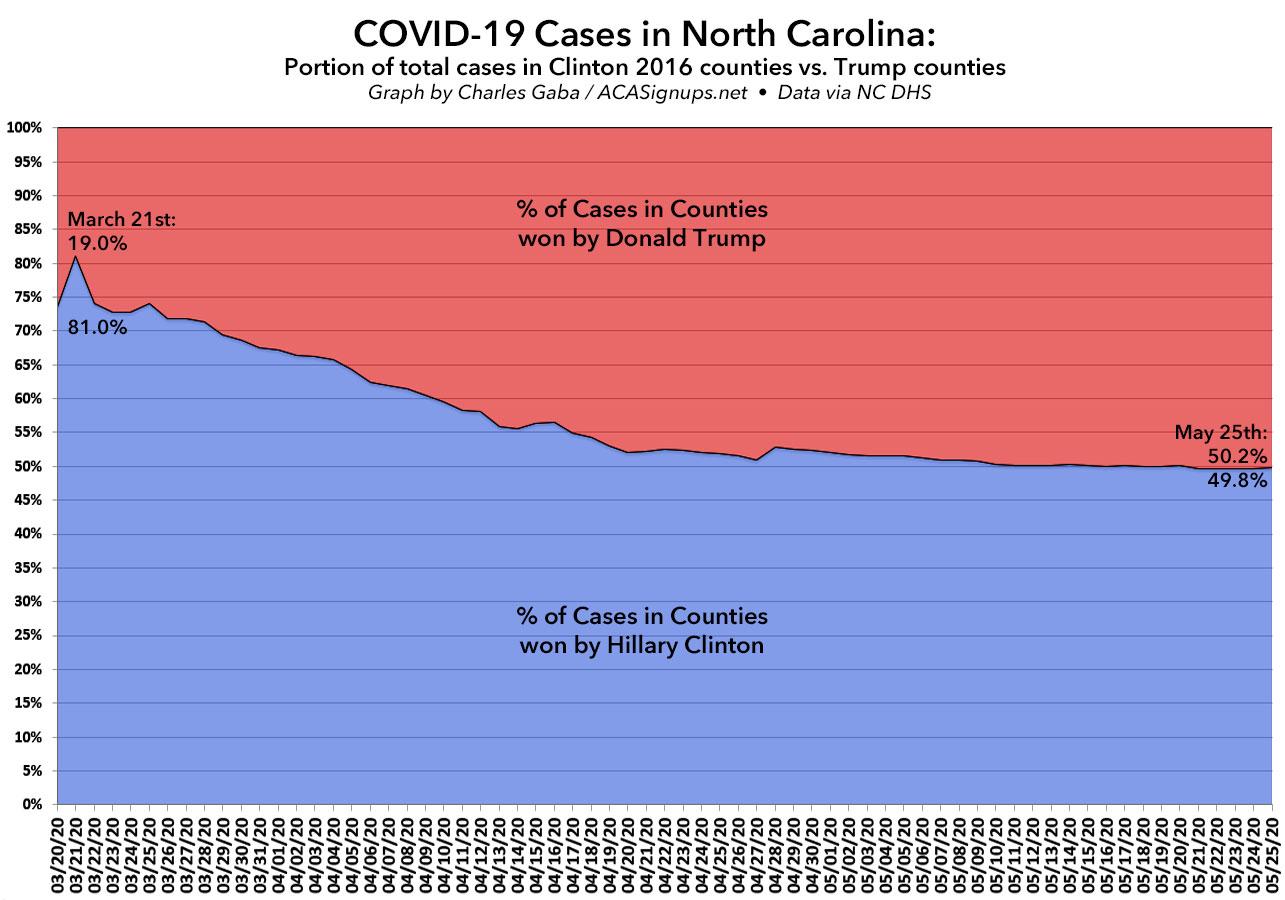
Next, let's look at the partisan shift. As I've noted before, like Michigan, Wisconsin and Minnesota, after starting out as almost exclusively a "blue county" problem (over 80% of all early cases were found in counties won by Hillary Clinton in 2016), the virus has spread to Trump counties, and has been holding steady at roughly 50/50 for several weeks now:
However, that only tells part of the story. What's more relevant is the ratio between the per capita rates. In late March, the blue counties had 3x as many cases per capita than the red counties...but as of today, this discrepancy has also narrowed to nearly a 1:1 ratio, with the blue counties only having 10% more cases per capita than the red ones.
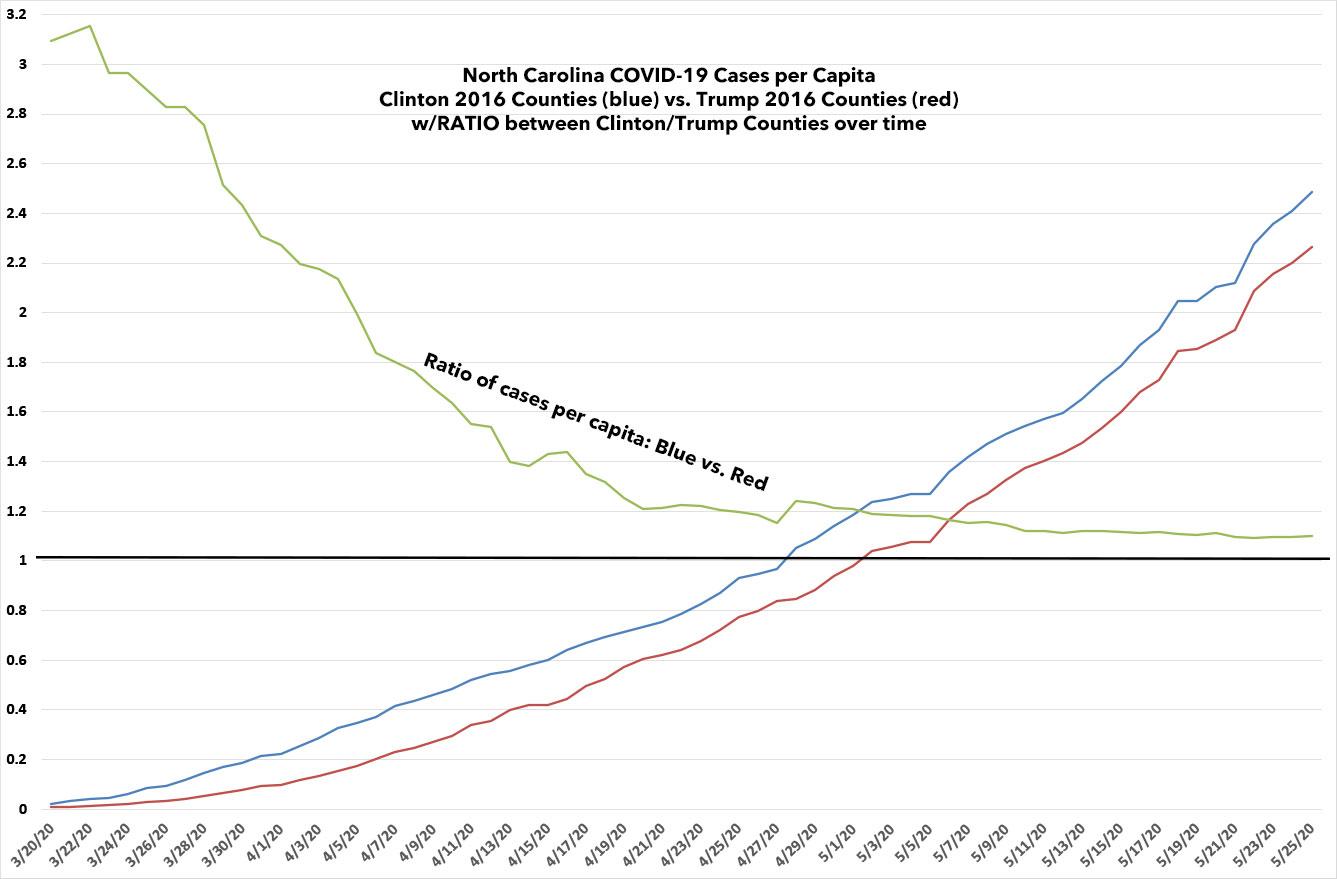
If and when this ratio ever falls below 1.0, it'll be interesting to see what happens among NC Republican polticians. Then again, Mecklenberg itself is a solid blue county (it voted for Clinton 62% to 33%), so it's hard to say...
Advertisement
