Now that I've brought all 50 states (+DC & the U.S. territories) up to date, I'm going to be posting a weekly ranking of the 40 U.S. counties (or county equivalents) with the highest per capita official COVID-19 cases and fatalities.
Again, I've separates the states into two separate spreadsheets:
Most of the data comes from either the GitHub data repositories of either Johns Hopkins University or the New York Times. Some of the data comes directly from state health department websites.
Here's the top 40 counties ranked by per capita COVID-19 cases as of Sunday, June 14th:
As promised, here's my weekly update of the spread of COVID-19 across all 50 states, DC & PR over time, from March 20th through June 14th, 2020, in official cases per thousand residents.
I've given up trying to tie every trend line to the state name; it simply gets too crowded near the bottom even with a small font size, so I've grouped some of them together where necessary.
Note that this graph doesn't take into account any of the rumored undercounts in Florida, Georgia etc...these are based on the official reports from the various state health departments. If and when those are ever modified retroactively I'll update the data accordingly.
Click the image itself for a high-resolution version.
Note: The sudden jumps in New York, Massachusetts and Michigan all reflect reporting methodology changes; MA & MI started including probable COVID-19 cases, while New York added a batch of 15,000 positive antibody tests results they hadn't been previously including.
On April 14th, Covered California reported that 58,000 residents had enrolled in ACA exchange coverage during their COVID-19 Special Enrollment Period, of which roughly 20,000 did so via standard SEPs (losing coverage, moving, getting married/divorced, etc), while an additional 38,000 took advantage of the COVID-specific SEP.
NEARLY 40,000 MARYLANDERS HAVE ENROLLED DURING CORONAVIRUS EMERGENCY SPECIAL ENROLLMENT PERIOD
Less than a week left for uninsured residents to get marketplace coverage
BALTIMORE, MD – The Maryland Health Benefit Exchange today is urging uninsured Marylanders to enroll in coverage before the June 15 deadline through the state’s health insurance marketplace, Maryland Health Connection, under the Coronavirus Emergency Special Enrollment Period. To date, nearly 40,000 residents have received health coverage during this special enrollment period that began in March with Gov. Larry Hogan’s announcement of a State of Emergency in Maryland.
Now that I've brought all 50 states (+DC & the U.S. territories) up to date, I'm going to be posting a weekly ranking of the 40 U.S. counties (or county equivalents) with the highest per capita official COVID-19 cases and fatalities.
Again, I've separates the states into two separate spreadsheets:
Most of the data comes from either the GitHub data repositories of either Johns Hopkins University or the New York Times. Some of the data comes directly from state health department websites.
Here's the top 40 counties ranked by per capita COVID-19 cases as of Saturday, June 6th:
At long last, after many hours of data entry, here it is: The spread of COVID-19 across all 50 states over time, from March 20th through June 3rd, 2020, in official cases per capita.
I decided to only use every 3rd day (3/20, 3/23, 3/26, etc) in order to avoid as many one-day data reporting issues as possible (i.e., there were some cases where a state didn't update their numbers for 2 days in a row). I also gave up trying to tie every trend line to the state name; it simply gets too crowded near the bottom even with a small font size, so I've grouped some of them together where necessary.
I still hope to add the District of Columbia and U.S. territories (Guam, Puerto Rico, etc) but otherwise I should have everything fully up to date now, and should only have to plug in one day at a time going forward. I'll update this chart once a week if possible.
Since I've been neglecting other ACA/healthcare posts the past couple of weeks, I figured I should at least provide regular updates on why I've been mostly absent.
I've made major progress in updating and revising my breakout of COVID-19 cases and fatalities at not just the state level but the county level. Again, I've separates the states into two separate spreadsheets:
30,000+ MARYLANDERS HAVE ENROLLED DURING THE CORONAVIRUS EMERGENCY SPECIAL ENROLLMENT PERIOD
Remaining uninsured residents have less than a month to get marketplace coverage
BALTIMORE, MD – The Maryland Health Benefit Exchange today reminded uninsured Marylanders that they have until June 15 to enroll in coverage through the state’s health insurance marketplace, Maryland Health Connection, under the Coronavirus Emergency Special Enrollment Period. As of May 15, nearly 31,000 residents across the state have taken advantage of this special enrollment period that began in March with Gov. Larry Hogan’s announcement of a State of Emergency in Maryland.
I've made major progress in updating and revising my breakout of COVID-19 cases and fatalities at not just the state level but the county level. Again, I've separates the states into two separate spreadsheets:
Most of the data comes from either the GitHub data repositories of either Johns Hopkins University or the New York Times. Some of the data comes directly from state health department websites.
I hope to fill in the back-data for every state within the next few days, bringing them all up to date. This should allow for plenty of interesting analysis of trends and counties to keep an eye on. It will also allow me to get back to posting more regular ACA policy updates/etc.
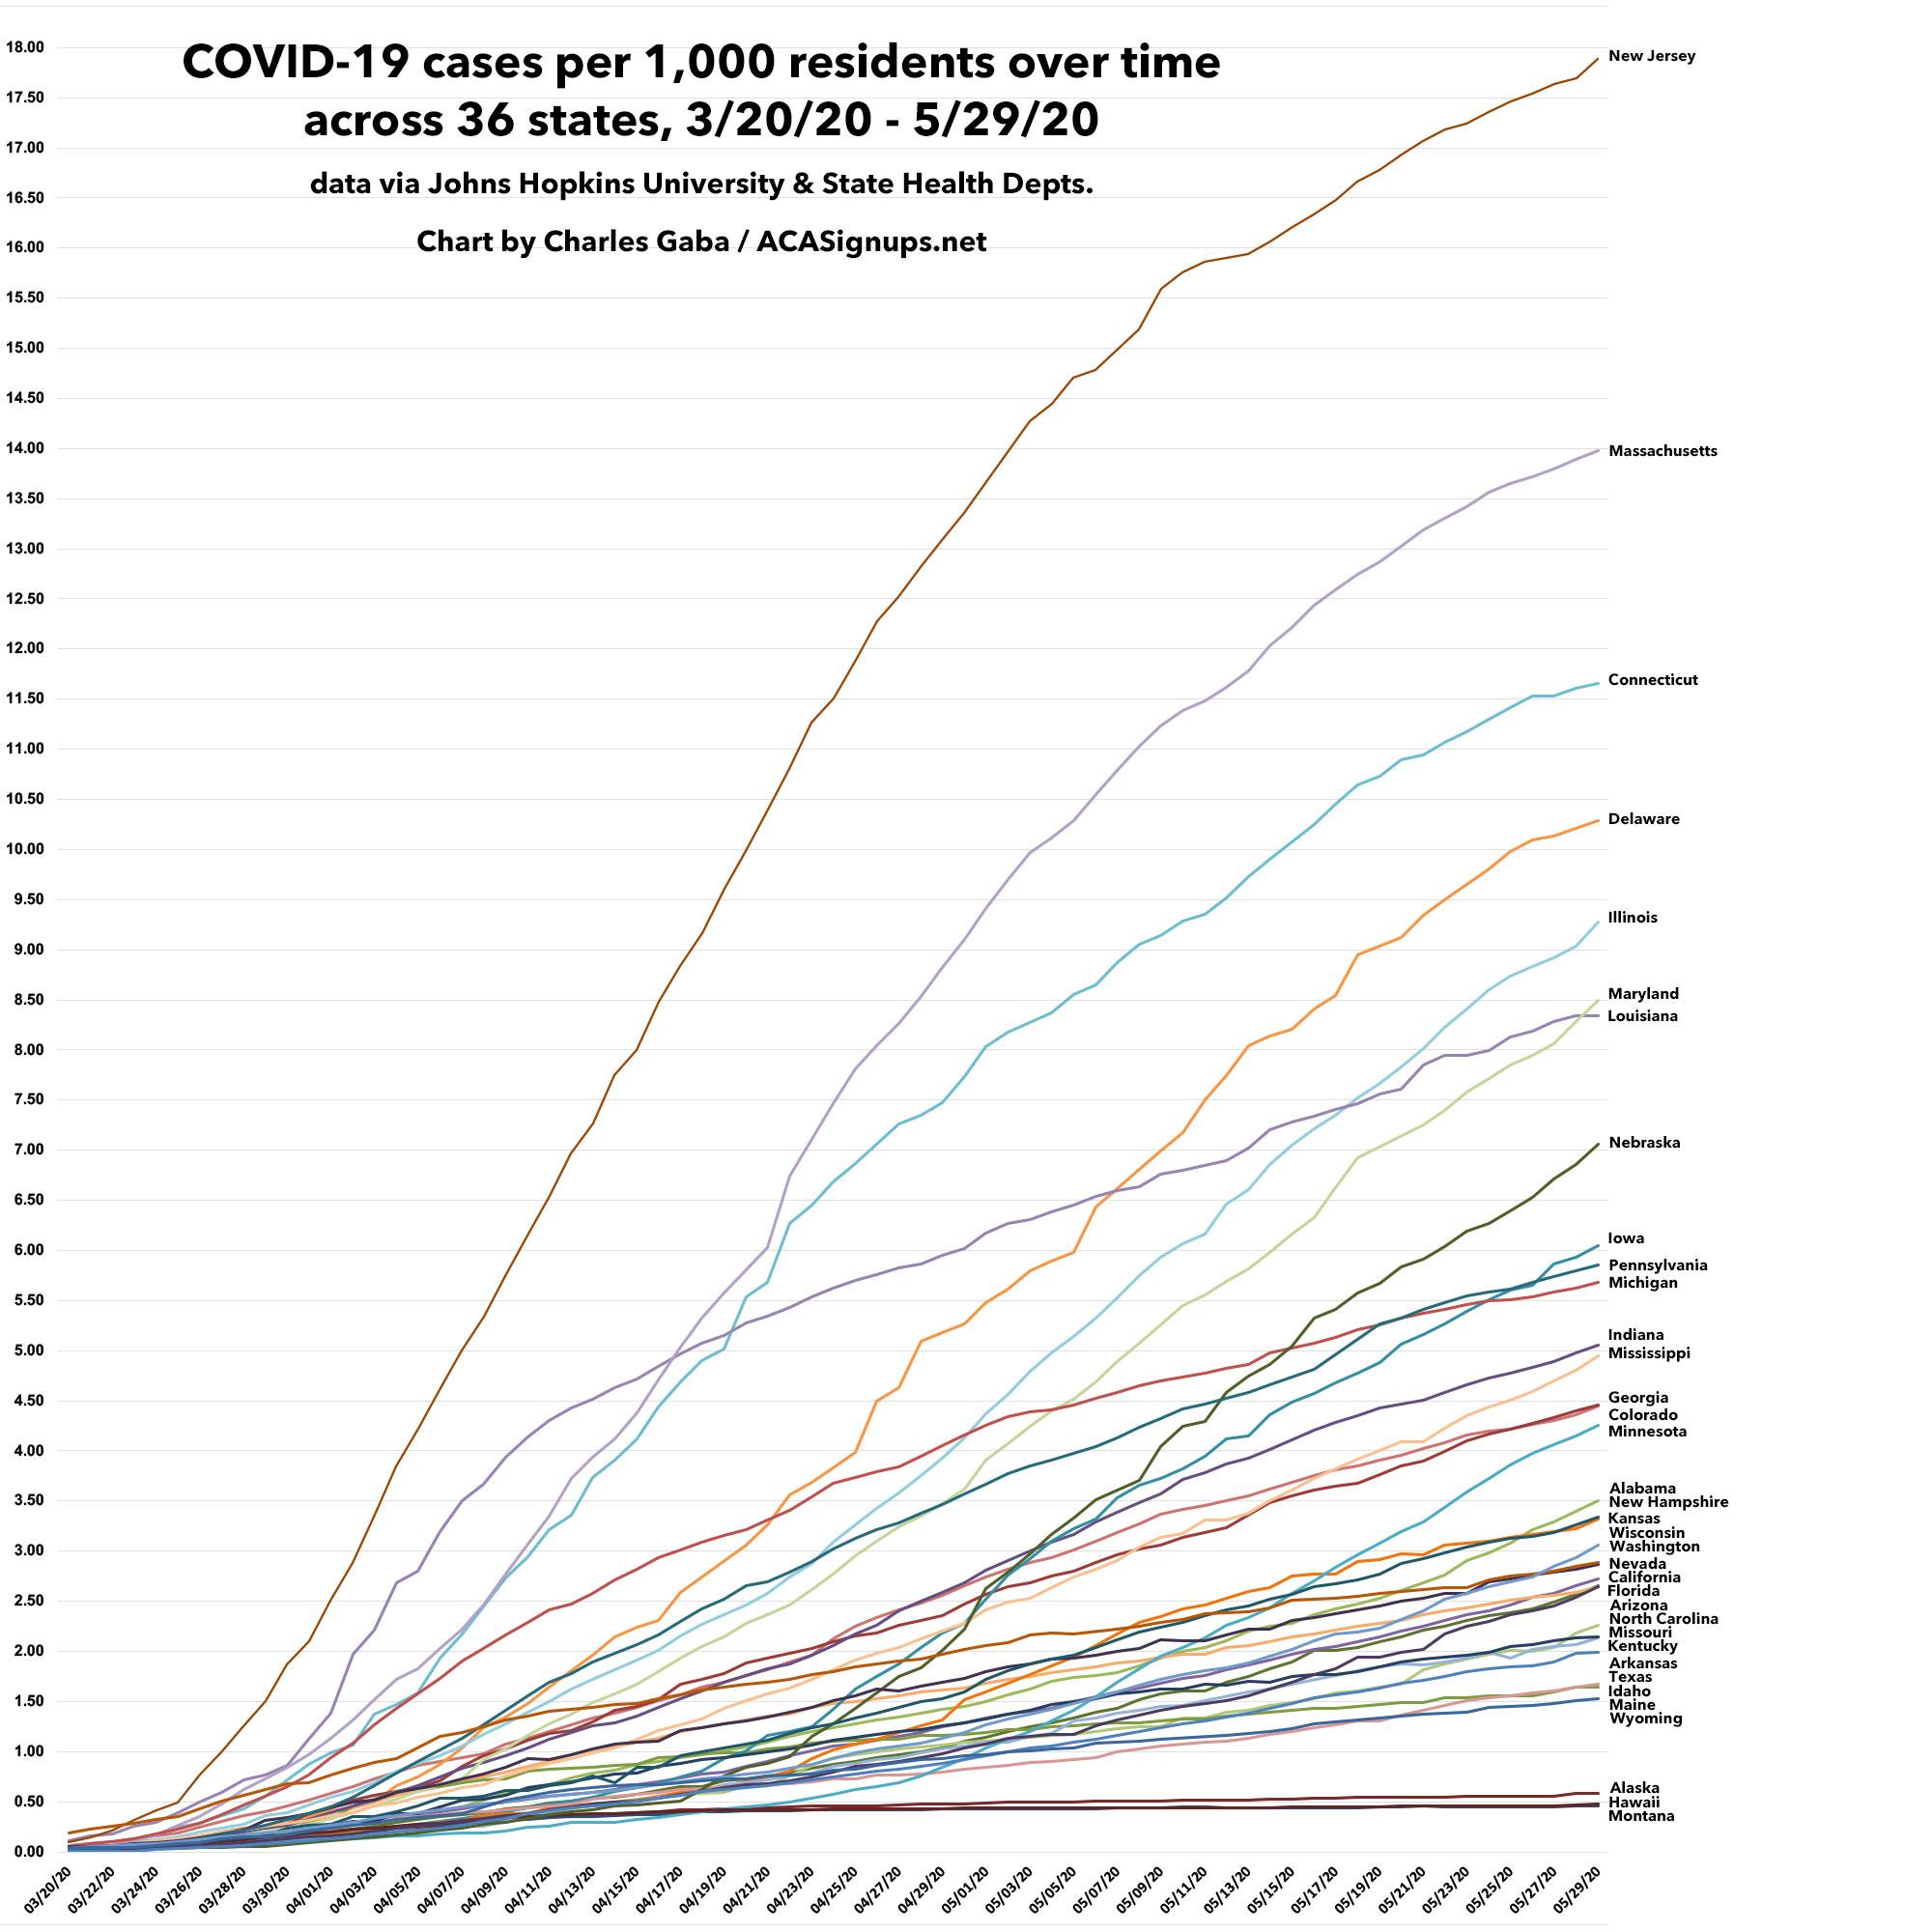
My county-level tracking project continues. I've now plugged in confirmed/official COVID-19 cases and fatalities across 36 states and hope to bring the remaining 14 states (plus the U.S. territories) up to date within the next few days.
Meanwhile, here's how cases have spread on a per capita basis across those 26 states from March 20th until May 29th. At the high end, I haven't gotten to two of the worst-hit states yet (New York & Rhode Island); at the lower end, there's a cluster of states which are difficult to separate out at this level as they're running so close together.
Just as important as the infection rate itself, of course, is the curve of the line. Louisiana and Michigan were hit hard early on, but seem to be flattening their curves, while states like Minnesota, Iowa, Mississippi and Alabama, which were hit later, are starting to curve upwards now, definitely the wrong direction.