

How #COVID19 cases have spread across 26 states per capita
Wed, 05/27/2020 - 10:08am
My county-level tracking project continues. I've now plugged in confirmed/official COVID-19 cases and fatalities across 26 states and hope to bring the remaining 24 states (plus the U.S. territories) up to date within the next few days.
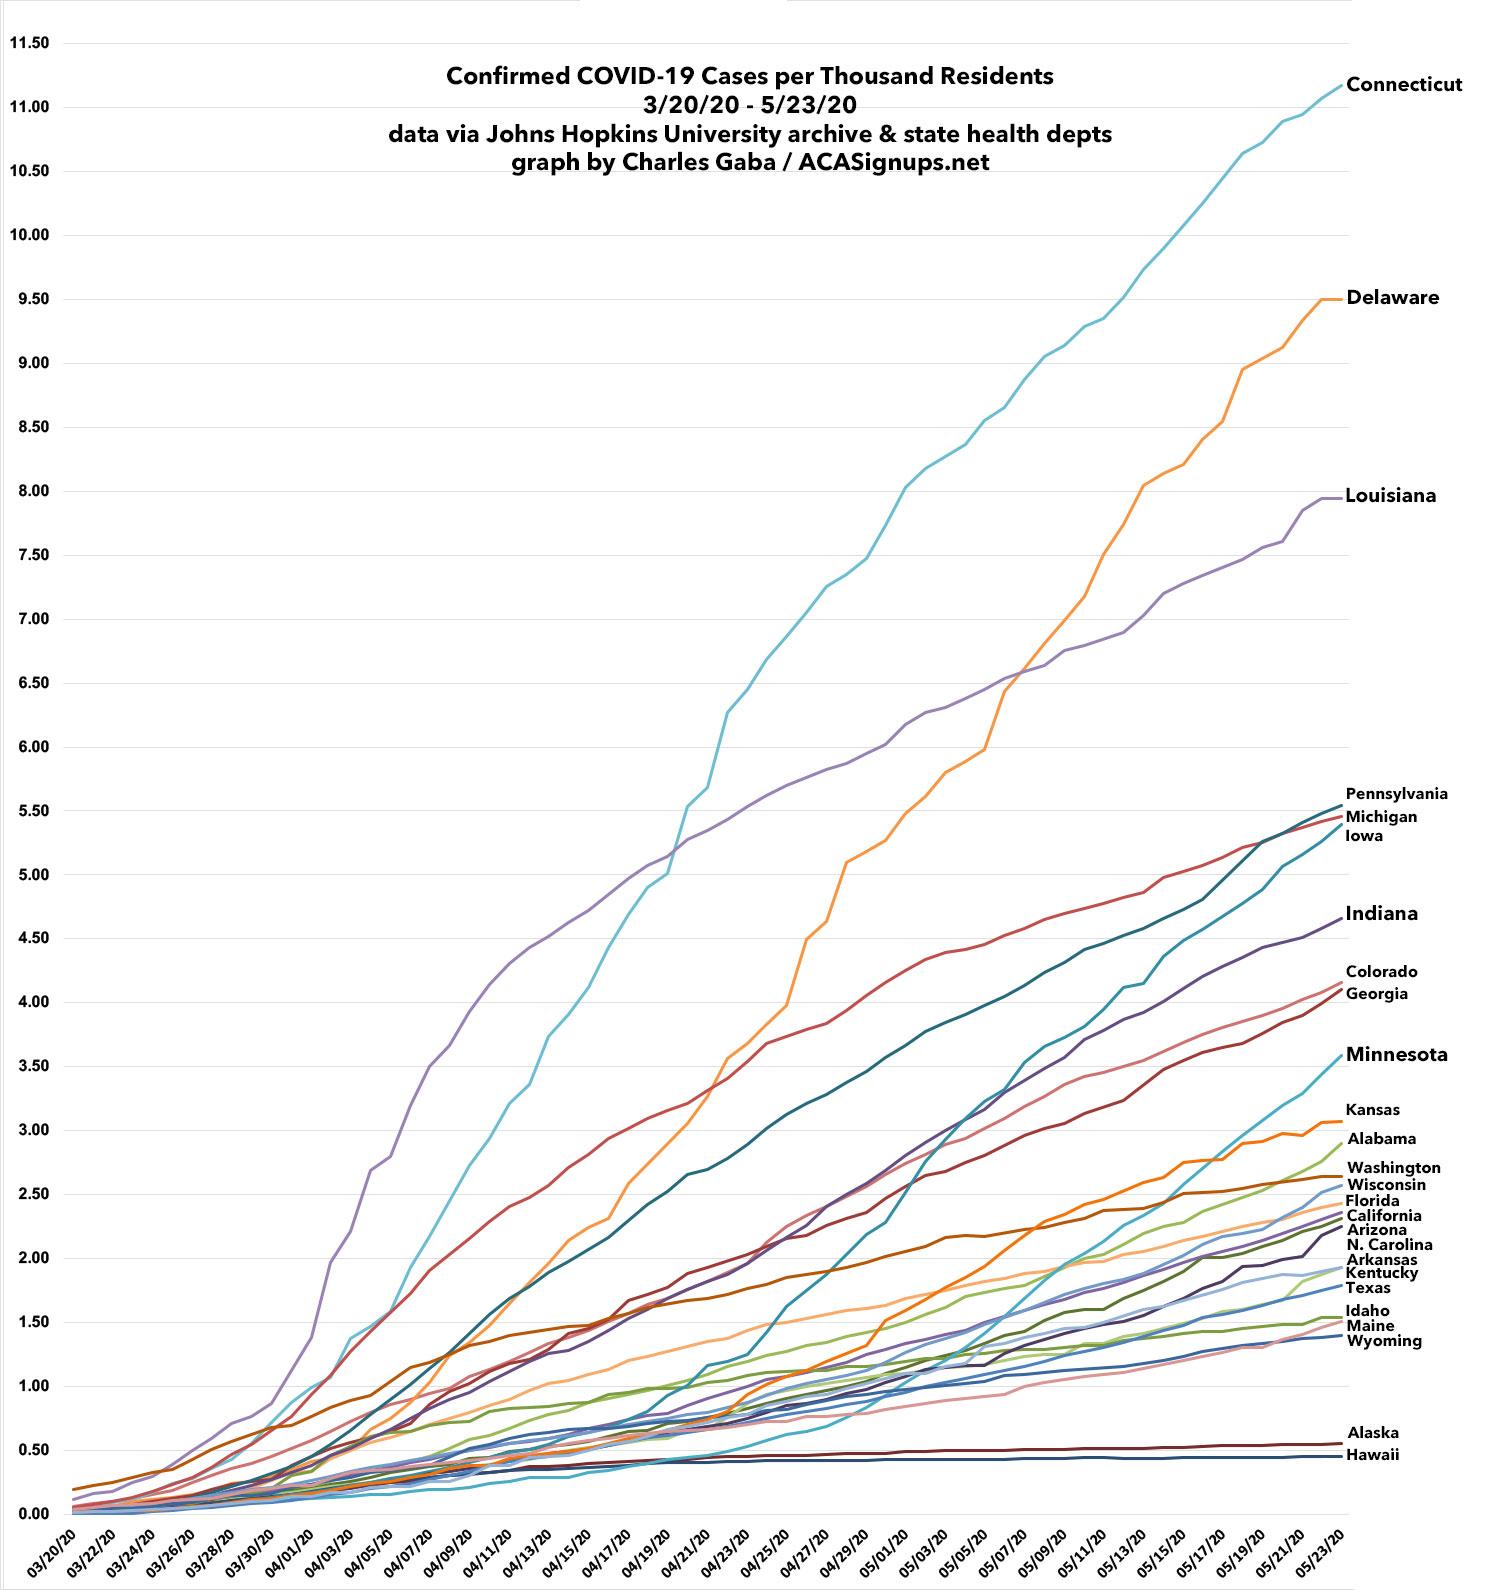
Meanwhile, here's how cases have spread on a per capita basis across those 26 states from March 20th until May 23rd. At the high end, I haven't gotten to the worst-hit states yet (New York, New Jersey, Massachusetts & Rhode Island), which wouldn't fit on this chart anyway; at the lower end, once you get below Alabama, there's a cluster of states which are difficult to separate out at this level as they're running so close together.
Just as important as the infection rate itself, of course, is the curve of the line. Louisiana and Michigan were hit hard early on, but seem to be flattening their curves, while states like Minnesota, Iowa and Alabama, which were hit later, are starting to curve upwards now, definitely the wrong direction.
Advertisement
