

UPDATED: EXCLUSIVE: How much more are YOU paying this year due to #ACA sabotage?
Wed, 04/11/2018 - 8:00am
WARNING: LOTS OF WONKY NUMBER-CRUNCHY STUFF BELOW.
Skip to the end if you just want to see my findings for every state, but be warned that there's a bunch of caveats/disclaimers involved.
UPDATE: To clarify, you're looking for the VERY LAST TABLE. Not that one...no, not that one either...the one at the very bottom of the post. I've added a highlighted note right above it.
UPDATE x2: ARRRGH! I knew I couldn't tackle something like this without making one glaring error: Arkansas' "Medicaid Private Option" factor! David Ramsey of the Arkansas Times informs me that as of November 2017, there were 256,000 people enrolled in this program. Instead of normal Medicaid expansion, Arkansas is instead enrolling eligible residents into ACA exchange policies, but then using the "Medicaid" money to pay their premiums.
This effectively means that there's an extra 256,000 Arkansans receiving heavily-subsidized ACA exchange plans...except that they aren't counted as part of the official ACA enrollment total.
In short, instead of 348,300 Arkansans being hit with the full weight of GOP sabotage, it's "only" around 92,300. All numbers and tables below have been updated accordingly. The only real change is to the total number affected in Arkansas and nationally (which now stands at around 6.56 million instead of 6.81 million). The average "sabotage tax" being paid by each actually goes up slightly as a result, but only by a negligible amount nationally.
UPDATE x3: (sigh) Louise Norris reminds me that New Hampshire does the same thing. 41,400 of their "off-exchange" enrollees are actually enrolled in heavily-subsidized "Premium Assistance Program" policies. That knocks their total down to around 30,500, and brings the national total down to 6.51 million. Again, everything has been corrected below.
I believe (and hope!) that Arkansas and New Hampshire are the only states to do "Medicaid expansion" this way.
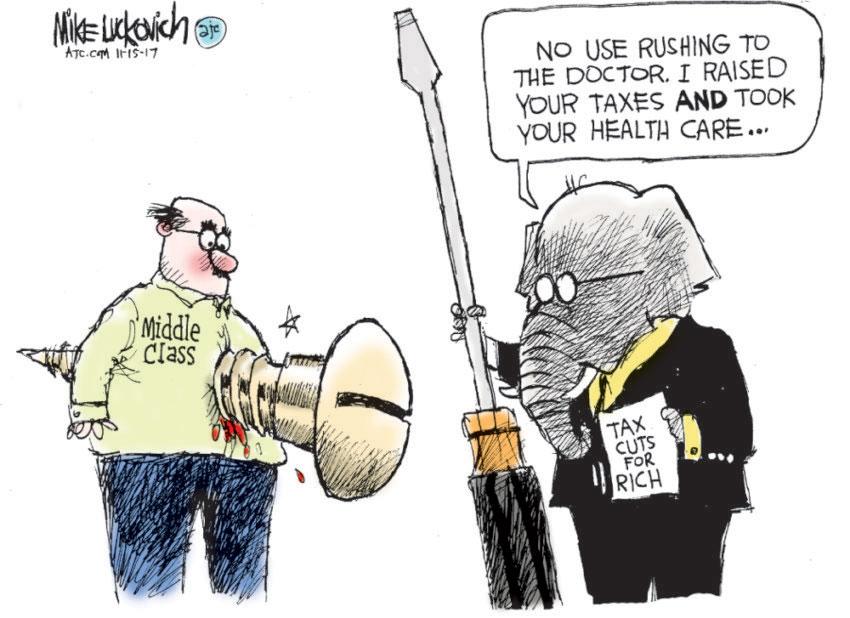
used w/permission by Mike Luckovich
Since the day Donald Trump took office, I've repeatedly sounded the alarm about the impact that he, in collusion with a fully GOP-controlled Congress, would have on individual market premiums for millions of people...especially for those earning more than 400% of the Federal Poverty Line (around $48,000/year for a single adult or $98,000/year for a family of four).
This was so blatantly obvious to anyone paying attention that GOP lobbyists didn't even try to pretend otherwise; the only thing they worried about was who would take the blame for their actions:
...Many Republicans would prefer to argue the Obamacare markets were already in their death throes before they took charge — the question is whether they can get away with it.
“The first question I think they’re trying to figure out is, do we actually own it for 2018?” said one health care lobbyist, speaking on background. “If premiums spike and plans exit, can we still blame it on Obama and get away with it? That’s one of the threshold questions that I don’t think they’ve answered.”
Sure enough, as 2017 dragged out, Donald Trump and Congressional Republicans threw every type of sabotage they could think of at the ACA. Most of the official legislation ended up failing (aside from repealing the individual mandate, though that doesn't formally kick in until 2019), and some of Trump's regulatory sabotage efforts either fell flat or blew up in his face. Even so, a toll was definitely taken...and as I expected, it was those in the middle class who ended up taking it right in the face.
The most obvious example of sabotage working was also, ironically, the one which failed most spectacularly: The elimination of Cost Sharing Reduction reimbursement payments to the carriers. Due to the complicated way in which the CSR and Advance Premium Tax Credit (APTC) formulas interact with each other, most (but not all) carriers, working together with the state insurance regulators and state-based ACA exchanges, whipped up a clever pricing workaround called "Silver Loading" (or a more elaborate version called "Silver Switcharoo" in about 20 states) which not only cancelled out the negative pricing impact for subsidized ACA exchange enrollees, but even managed to lower the price they're actually paying each month.
HOWEVER, not all of the CSR damage could be mitigated. While Silver Loading/Switching made it possible in theory for unsubsidized ACA enrollees to avoid the CSR hit, in practice it was hit & miss, with some carriers/states being more successful at making the strategy work than others. Some states offered Silver Switching but didn't explain how it worked. Some only offered Silver Loading. Some didn't offer either. And while I and other healthcare wonks/activists did our best to get the word out, our success was limited as well, as many enrollees ended up being simply confused and bewildered by all the changes.
As I've said many times, Trump doesn't have to kill CSR payments, he just has to leave the carriers NOT KNOWING whether he'll kill them. https://t.co/DfmRbzuRwZ
— Charles Gaba (@charles_gaba) April 26, 2017
In addition, while the CSR cut-off was the most obvious and easiest-to-quantify cause of rate increases this year, there were other sabotage factors which contributed to them. The fate of the Individual Mandate was bopped around all year. Within hours of taking office Trump issued an Executive Order which the IRS originally took to mean "don't enforce the mandate penalty at all" only to do a complete 180 later in the year and decide to enforce after all. Various versions of the Repeal/Replace bills thrown at the wall by Congressional Republicans included repealing the mandate and even making the repeal retroactive to prior years. Some House Republicans even introduced a bill to legally prohibit the IRS from enforcing the mandate penalty.
While few of the carriers were certain that the mandate was going to be repealed, most of them had no idea whether it would be or not...and some of them wisely recognized that what really mattered was whether people thought the mandate would be enforced or repealed. As I noted many times last year, if the mandate works at all, it does so on a purely psychological basis--the point isn't to punish people for not getting covered last year, it's to encourage them to do so next year. As a result, some carriers padded their 2018 premium rates by a few additional points to cover themselves in case the mandate was either repealed or not enforced.
Throughout all of this was Trump himself repeatedly announcing, quite publicly, that he was either going to "blow up" the ACA or that it was already "dead" and the like. Between that and no one having a clue whether Congress was going to retool or entirely scrap the tax credits, the exchanges themselves or the entire law, some carriers saw the writing on the wall and decided to bail altogether...which in turn reduced competition, dumped their enrollees on the other carriers, and generally caused massive amounts of confusion and doubt about what the hell was gonna happen this year. Other measures by the Trump Administration designed to "explode" the ACA market such as slashing marketing/outreach budget by 90% and 40% respectively, cutting the enrollment period in half etc. caused additional concerns.
In this sense, even the failed sabotage measures "succeeded" to some degree because the health insurance market is in a very real sense based on risk and uncertainty. The more uncertainty an insurance carrier has about what the landscape is gonna be the following year, the more they're likely to jack up their prices to cover themselves to prepare for a worst-case scenario.
I spent most of the summer and fall painstakingly tracking practically every rate filing by every carrier in every state, and by October I concluded that nationally, the average unsubsidized ACA-compliant individual market premium was going to shoot up by around 30% in 2018, with a good 60% of that (around 18 points) being due specifically to the various sabotage efforts laid out above. Most of that was due to the CSR cut-off, with a smaller amount being caused by carrier concerns about mandate enforcement and the other oddball policy changes.
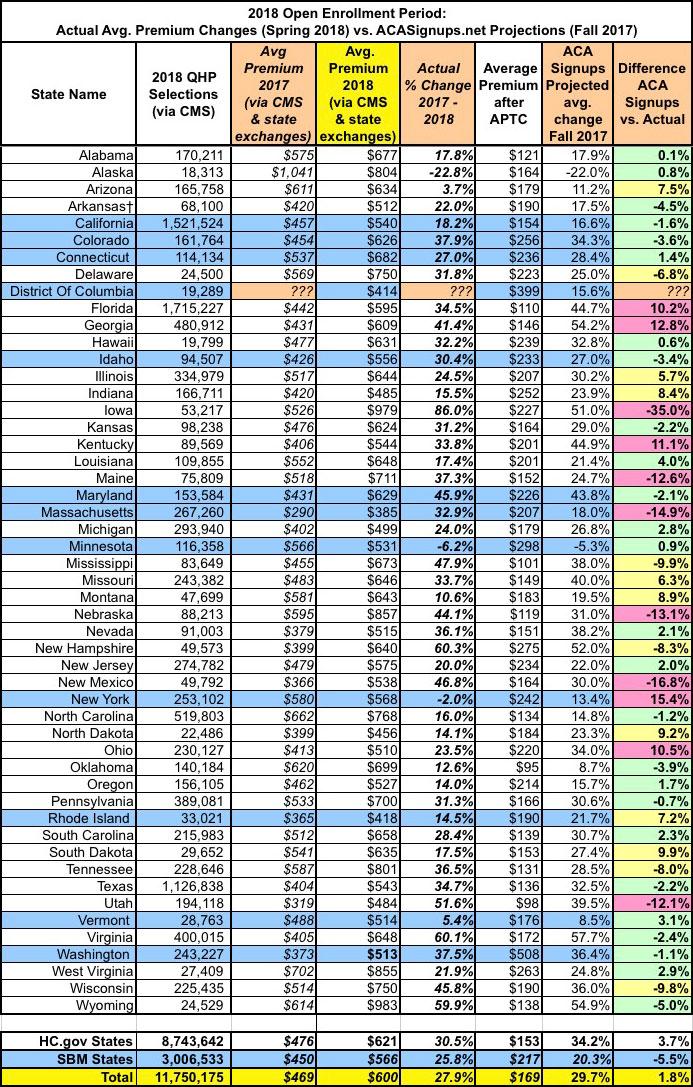
Sure enough, when the dust settled and the actual 2018 Open Enrollment Data came in, I turned out to be pretty damned close to the mark: The average increase was 28% nationally, and I was within +/- 5 points in half the states and within 10 points in 13 more. That ~28% average varied greatly from state to state (as well as carrier to carrier and especially from plan to plan, given the nature of Silver Loading).
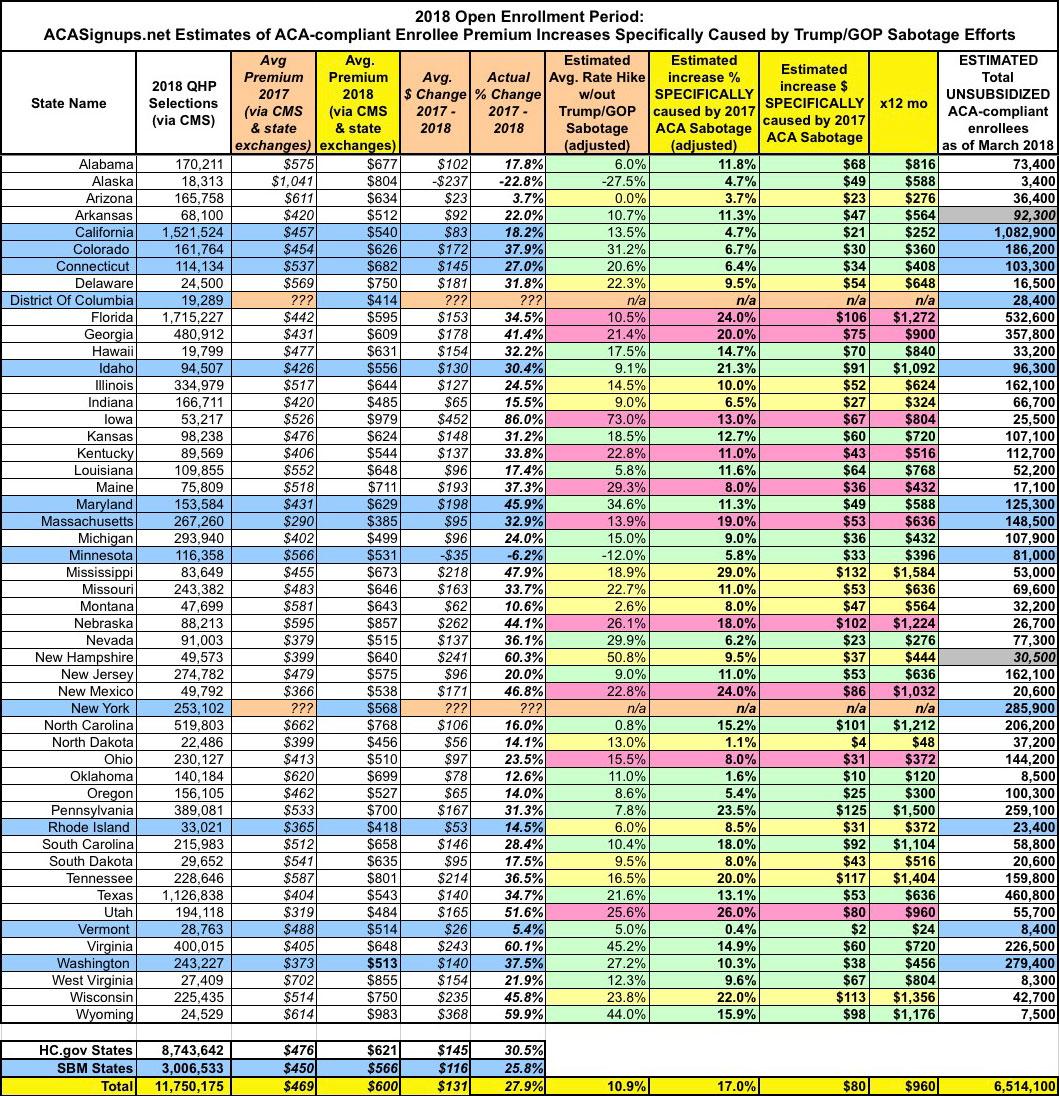
Keep in mind that when comparing year over year premiums, CMS only used numbers for the 39 states hosted by HealthCare.Gov in their big press release last week: Average premiums of $476 last year and $621 this year, etc. When you plug in the rest of the numbers for the 12 state-based exchanges, the numbers skew a bit lower: $469 and $600 respectively. In other words, instead of a 30.5% average increase, nationally it was "only" 27.9%, which means I overshot by 1.8%. Still not bad:
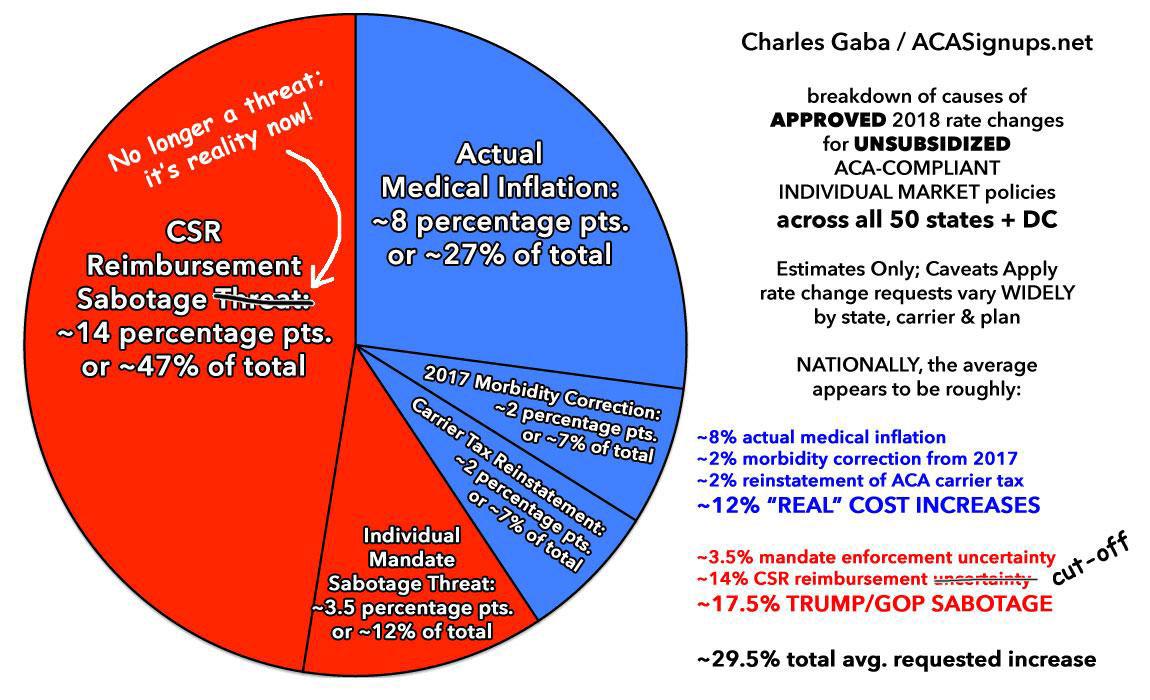
Not only did the 28% hike vary widely, but so did the portion of the increase caused by sabotage factors. The other 12 points or so of the increase was caused by non-sabotage things like rising drug costs, general inflation, the restoration of the ACA carrier tax and corrections to the prior-year morbidity scores. Here's how I broke it out nationally last fall:
I've therefore done my best to calculate two numbers for each state:
- First: Just how many people enrolled in unsubsidized, ACA-compliant individual market policies this year; and
- Second: Just how much more are each of those people paying each month in 2018 specifically due to 2017 ACA sabotage efforts.
I've color-coded each state based on my confidence level regarding the sabotage-caused premium hikes:
- Green (High Confidence): My original projections were within 5% of the actual average change reported by CMS (26 states)
- Yellow (Medium Confidence): My original projections were within 5-10% of the actual average change (13 states)
- Red (Low Confidence): My original projections were more than 10% off from the actual average change (11 states)
With all of those caveats in mind, nationally, as far as I can figure, around 6.5 million middle-class people enrolled in unsubsidized, ACA-compliant individual market policies are paying an average of 17% more this year, or $80/month than they would be if not for deliberate attempts to sabotage the ACA by Donald Trump and Congressional Republicans throughout 2017.
Annually, that adds up to around $960 per unsubsidized enrollee for 2018.
It's extremely important to keep in mind that the $80/month does not include the non-sabotage portion of the premium increases (around 11% on average nationally, or $51/month per enrollee), which includes normal medical inflation trends, morbidity corrections from the prior year and the reinstatement of the ACA's carrier tax).
As it happens, an extra $960/enrollee is precisely the amount foreseen as one of the most likely scenarios by the Center for American Progress almost exactly one year ago:
But even the mere possibility that the Administration fails to implement these ACA provisions could spur a rate hike. Assuming a 25 percent chance that both these changes occur would suggest an 8.5 percent rate hike, or $480 annually on top of normal premium growth, as shown in Table 1. If insurers priced in a 50 percent likelihood of both these changes, that would lead to a 17 percent increase or $960.
Early data show that 2018 rates may be coming in higher than expected in many places. In a recent survey of insurers, the consulting firm Oliver Wyman found that the median rate increase for 2018 will be somewhere between 10 and 20 percent, an increase above what medical trend alone would justify.
That $960/enrollee is also very close to my own rough estimates as well as those of the Urban Institute last year and two years ago:
In other words, at the moment, carriers across those 21 states are asking for an average premium increase of (($467 x 1.19) - $467) = $89/month x 12 months = $1,068 specifically to cover their anticipated cost sharing reduction losses.
As it happens, this is also almost exactly the same amount that the Urban Institute projected would be the case nearly a year and a half ago:
We find that premiums for silver Marketplace plans would increase $1,040 per person on average. This premium increase would, on average, make silver plan premiums higher than those of gold plans(plans with 80 percent actuarial value). The higher premiums would in turn lead to higher federal payments for Marketplace tax credits because such payments are tied to the second-lowest-cost silver plan premium. All tax credit–eligible Marketplace enrollees with incomes up to 400 percent of FPL would receive larger tax credits, not just those eligible for CSRs.
Note that at the time I was assuming around 19% due to sabotage out of 34% total rate hikes; I later revised both of these downwards to 17.8% out of 29.7% total, which would amount to $83/month or $996/year.
In other words, no matter how you slice it, Urban Institute had it right, I had it right and the Center for American Progress had it right at the national level.
Again, I was very close in half the states and fairly close in others...but in 11 states I'm afraid I was way off base. I debated whether to include those states in this analysis at all since I was so far off, but decided to keep them in the interest of completeness (with 2 exceptions), but to highlight them in red as being highly questionable.
OK, so now that we have a pretty good bead on the amount that Trump/GOP sabotage caused rates to jump in 2018, the next question is how many unsubsidized enrollees are actually being stuck with the bill? This includes the unsubsidized enrollees, which fall into two groups: Exchange-based and OFF-exchange ACA policy enrollees.
The exchange-based number is easy at both the national and state levels: 1.98 million people. CMS has reported exactly how many ACA exchange enrollees are unsubsidized in every state.
The off-exchange numbers are where things get fuzzier.
Off-exchange individual market enrollment has never been easy to calculate year to year because few states require insurance carriers to report that data and fewer still make it easily accessible to the public (it's even considered a trade secret in some states). Believe me, I've tried, spending many hours on the phone with state insurance department representatives and insurance carrier PR reps, with limited success.
Fortunately, Mark Farrah Associates, a large, respected health policy/data analytical firm, has better resources than I do, and through a lot of hard work and gumption, managed to come up with what seems to be a fairly accurate estimate/breakout last summer on a state-by-state basis:
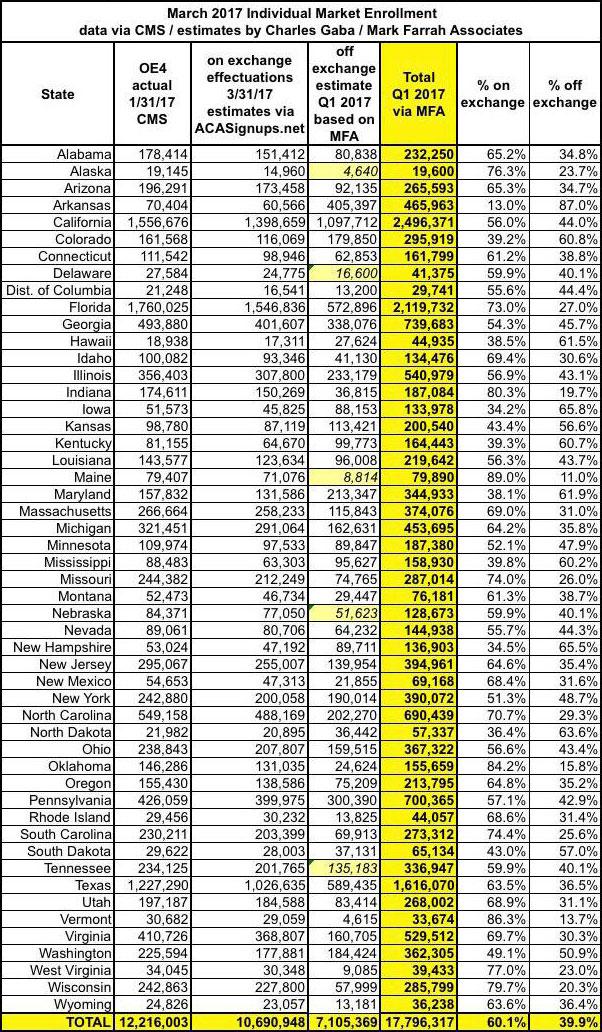
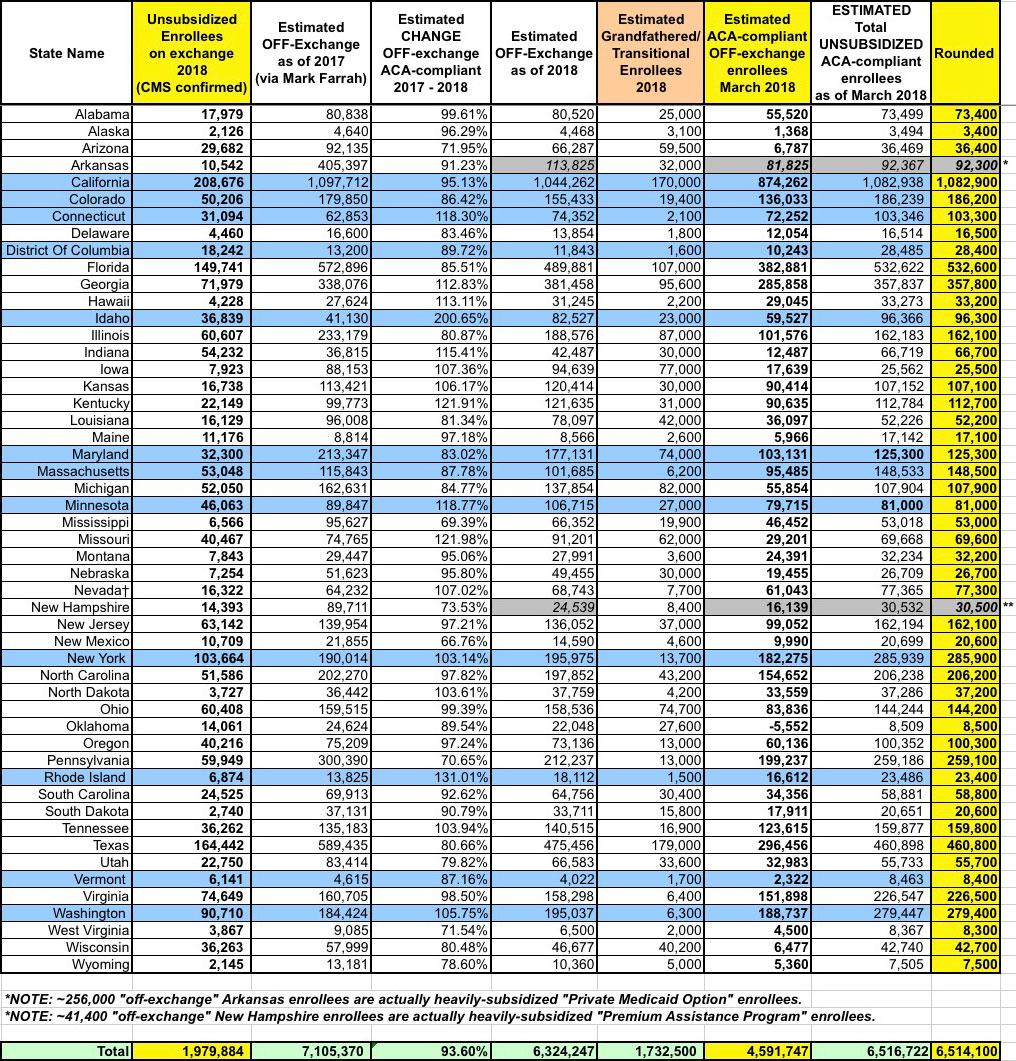
The next problem is figuring out how the off-exchange numbers have changed since last year. The unsubsidized on-exchange population dropped from 2,115,195 in 2017 to 1,979,884 this year, or around 6.4%. I'm willing to bet the off-exchange numbers have dropped by a similar amount, bringing them down to around 6.3 million total. There's a handful of states where I have hard numbers, but for the most part I've modified them based on how each state performed relative to last year on the exchanges.
OK, so that means there are roughly 6.3 million off-exchange enrollees nationally as of last March. If you add those to the 1.98 million exchange-based unsubsidized, you get around 8.3 million people.
HOWEVER, this still leaves another, bigger problem: How many of the 6.3 million off-exchange were actually enrolled in ACA-compliant policies? Remember, just about every state still has some number of people enrolled in pre-ACA "grandfathered" policies from before 2010, while 34 states have some people enrolled in "transitional" or "grandmothered" policies (enrolled in between early 2010 - late 2013) which they were allowed to stay in after the backlash over President Obama's "If You Like It You Can Keep It" brouhaha.
The problem is that although neither grandfathered nor transitional policies include the same protections as ACA plans and thus aren't included in the same risk pool, they're still "counted" as part of the total individual market...but are rarely separated out in official reporting on the subject.
I spent the past few days crunching numbers and trying to figure out how many people are still enrolled in grandfathered & transitional policies as of today, and I think I'm pretty close:
![]()
Subtract the 1.73 million grandfathered/transitional enrollees from the 6.26 million total and you're left with roughly 4.53 million off-exchange ACA enrollees. Add the 1.98 million on-exchange enrollees back in and voila: There should be 6.5 million people enrolled in full price, unsubsidized ACA-compliant policies nationally as of early 2018.
Finally, I've put it all together into a single spreadsheet: How many people are paying the Trump Tax and how much they're each paying on average. As you can see, it ranges from nominal amounts in the single digits per month in Vermont and North Dakota (neither of these states allowed their carriers to load CSR costs at all) to as much as $132/month per enrollee in Mississippi.
Unfortunately, while I have estimates of the number of unsubsidized enrollees in all 50 states + DC, I was unable to include estimates of the percent or dollar amount increase caused by sabotage efforts in DC or New York due to being too uncertain of their average starting (2017) premiums.
Once again, I need to stress that while I'm pretty confident about most of my conclusions, there are a few states where I could be way off base on either the dollar amounts or the number of people impacted due to the insane amount of variables involved.
All of those caveats aside, to the best of my ability, here's what I've come up with: 6.5 million middle-class people getting collectively hosed for $6.3 billion over the course of 2018 for absolutely no reason other than Donald Trump not liking Obamacare. Are you among them?
NOTE: THIS IS THE TABLE YOU'RE PROBABLY LOOKING FOR:
Advertisement
