

MAJOR CORRECTION: Individual market has dropped by 11.9% (or 10.2%) since 2016
Fri, 08/04/2017 - 10:02am
I SCREWED UP ROYALLY. Instead of making a few simple corrections, I've chosen to completely rewrite this entry. My apologies for the error; full explanation and corrected data analysis below.
Longtime readers know that in addition to the core function of this site (it's right there in the title above), I'm also obsessed with tracking and breaking down the off-exchange individual market. This is easier said than done, because every state except for DC (which isn't actually a state) allows people to continue to purchase individual market policies directly through the insurance carriers...and unlike exchange-based enrollment, off-exchange enrollments don't usually have to be reported publicly. Some states require them to do so as part of internal state regulations, but they're usually a pain to get ahold of and other states protect the data as trade secrets, etc.
This morning I posted an analysis of the total individual health insurance market size based in large part on reports issued by Mark Farrah Associates (MFA), which included both the on & off exchange numbers as of the first quarters of 2016 & 2017.
MFA's reports estimated the total indy market sizes at around 20.2 million for Q1 2016 but just 17.6 million for Q1 2017...a year over year drop of 12.9% overall.
They posted their Q1 2017 report a couple of weeks ago, but I didn't have a chance to write anything about it until today; things have been a little busy of late, to put it mildy.
Anyway, healthcare consultant Robert Laszewski beat me to the punch, writing up a fairly critical piece over at National Review entitled "Is Part of the Health-Insurance Market Entering a Death Spiral?"
He uses the MFA data to note that the off exchange market specifically has dropped by about 29% year over year...a pretty significant reduction. Of course, the on exchange numbers have also dropped a bit...by 3.7% nationally if you compare the 2016 & 2017 Open Enrollment Period numbers.
Laszewski's article is generally accurate, but there were a couple of minor corrections needed to the MFA data. For one thing, MFA's off-exchange estimates are missing several states: They have no estimate for Alaska in either year, or for Delaware, Maine, Nebraska or Tennessee for 2017. That issue was easily corrected--I just took the average on exchange/off exchange ratios of the other 45 states to fill in estimates for the missing ones. Four of the five have pretty small populations anyway, so even if I'm off by a bit it shouldn't be more than a rounding error.
However, there was one other discrepancy, and this is where I made a major error.
If you look at the on-exchange numbers for each state from both 2016 and 2017, you'll notice that they're actually the QHP selection totals from the end of the OE3 and OE4 periods: 12.7 million and 12.2 million respectively.
Since these tables are supposed to show the effectuated individual market enrollment totals as of the end of the 1st quarter, I was certain that the on exchange numbers were too high, because for 3 years running, effectuated enrollment has dropped by about 13% between the end of open enrollment and the end of March. Roughly 10% of all exchange enrollees simply never pay their first premium anyway, plus another 3% or so who drop their policies after the first couple of months. This has become a fairly normal pattern. Therefore, I was certain that the on exchange numbers in MFAs tables were around 13% too high.
As a result, I concluded that the actual individual market stood at around 18.6 million in March 2016 but had dropped to just 16.2 million as of March 2017...or around 19.1 million > 17.0 million if you throw in Basic Health Plan enrollees in New York and Minnesota.
HOWEVER, I was later informed by Cynthia Cox of the Kaiser Family Foundation that this was incorrect: It turns out that MFA's 20.2 million / 17.6 million totals ARE correct after all. Apparently they get the total numbers first, then backs out the exchange-based numbers to get the off-exchange portion.
I contacted MFA directly (which, let's be frank, I should have done in the first place) and they confirmed that this is how they ran the reports: They compile the total numbers both on & off exchange first, then subtract out the official CMS state-by-state Q1 numbers and whatever's left is their estimate for the off-exchange market. This is important because it means that the totals are accurate, it's the on vs. off proportions which are wrong.
CMS released official Q1 2016 data for on exchange effectuated enrollment last June (11.1 million). They also released a similar "Q1 report" this year, but as I noted at the time, deliberately ignored about 500,000 QHP selections in doing so, meaning their "March" effectuation number was several hundred thousand too low. My own on exchange Q1 2017 estimate is around 10.7 million nationally, assuming a similar Q1 attrition rate to last year.
With that in mind, here's what the revised estimates look like. Even with the corrections and missing state estimates plugged in, the picture is pretty much the same: A total drop from 20.2 million to 17.8 million year over year., or around 11.9% overall. On exchange enrollment is down 3.5%, while off-exchange enrollment is down 22.1%...less than MFA/Laszewski's estimates, but still pretty steep.
I should also note, as an side, that the off-exchange numbers also include grandfathered (GF) and transitional (TR) plan enrollees, although they weren't able to break those out separately for me. GF/TR plans are the ones carried over from before 2010 or before 2014 which are not compliant with the Affordable Care Act and are therefore part of a separate risk pool. My best guess is that they're probably down to perhaps 1.3 million or so, leaving a total ACA-compliant individual market of around 16.5 million: 10.7 million on the ACA exchanges, 5.8 million or so off exchange. That's just a rough guesstimate, however...others have estimated it to be as low as perhaps 15 million (around 9 million subsidized, 6 million unsubsidized).
However, there's one more twist: The Basic Health Program. BHP has been in effect in Minnesota for years under the name "MinnesotaCare"--in fact, MNcare predated the ACA, and was retooled for the ACA's BHP program starting in 2014--but hasn't had more than 100,000 people or so enrolled, not much more than a rounding error. New York, however, launched their own BHP program ("the Essential Plan") in 2016, and enrollment exploded, enrolling 380,000 last year and another 286,000 this year. When you add that to Minnesota's numbers, there are now more than 750,000 people enrolled in BHPs...that's a significant number. Assuming you include BHP enrollees as part of the Individual Healthcare Market, that brings the grand total back up to 18.6 million. Counted this way, the year over year percentage drop is also smaller: 10.2% instead of 12.2%.
I did get one other little bonus from my phone call to MFA: They gave me permission to repost their data directly on my site as long as I give them full credit, so here's the corrected version of the tables. The yellow total column numbers come from MFA, except for Alaska (both years) and Delaware, Maine, Nebraska and Tennessee (2017 only), which are my own estimates. The Q1 2016 estimates come directly from CMS; Q1 2017 on exchange estimates come from me:

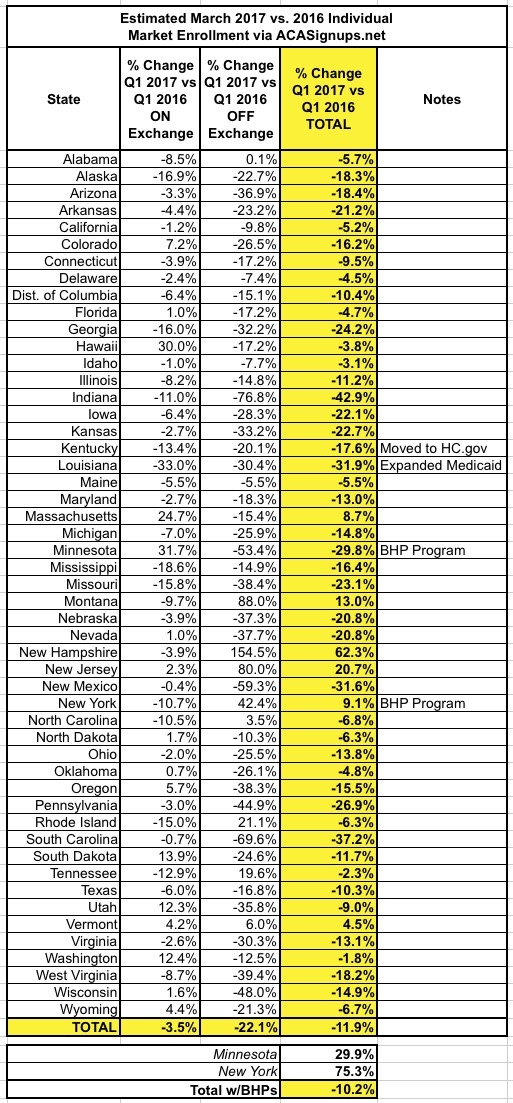
I've made notes for four states with special circumstances: Kentucky moved from their own "kynect" ACA exchange over to the HealthCare.Gov mothership, which likely had some effect on enrollment; Louisiana expanded Medicaid, which "cannibalized" perhaps 80,000 or so people from heavily-subsidized individual market plans; and I've already noted the significant impact of the Basic Health Plan programs in Minnesota and New York.
So, what does this all mean? Well, as Laszewksi notes in his Natonal Review piece, most of it is pretty obvious: The 9 million or so subsidized individual market enrollees are holding tight, since their premiums/costs aren't really changing much at all...but the unsubsidized market is starting to drop off rapidly, likely mainly due to being hit with 20-25% average premium increases this year. Combine that with the 400,000 or so enrollees lost due to the Trump administration deliberately cutting off marketing/outreach during the critical final week of the open enrollment period and voila, there's your 2.1 million enrollee drop (including BHPs). In other words, as far as I can tell, roughly 80% of the total drop is due to the rate hikes for unsubsidized enrollees, the other 20% due to Trump marketing sabotage.
And before you say "how do you know all 100% of the drop wasn't due to the rate hikes", simple: The subsidized percent of exchange enrollees remained nearly identical year over year (around 84%). If the rate hikes had been responsible for all of the drop, the subsidized percent would have been far higher, since almost no one would've enrolled in unsubsidized exchange-based plans at all.
The disproportionate unsubsidized drop also means that my long-standing "half are subsidized, half aren't!" talking point is no longer valid: Assuming my revised 16.5 million ACA-compliant estimate is accurate, the subsidized/unsubsidized ratio is now closer to 55/45.
Advertisement
