

Kaiser illustrates why Congress needs to #KillTheCliff in one chart.
Tue, 03/05/2019 - 9:56am
Regular readers know that I've been calling for Congress to #KillTheCliff for years:
Once again: Under the ACA, if you earn between 100-400% FPL (between $12,140 and $48,560 for a single person), you're eligible for APTC assistance on a sliding scale. The formula is based on the premium for the Silver "benchmark" plan available in your area, which averages around $611/month in 2019.
Here's how the formula works under the current ACA wording:
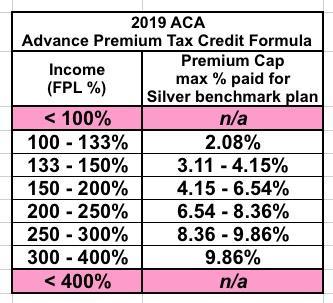
...Here's the problem: If they earn exactly 400% FPL ($48,560), they'll also only have to pay 9.86% ($4,802), receiving $2,530 in subsidies for the year....
...HOWEVER, if they earn even one dollar more than 400% FPL, they don't qualify for ANY subsidies at all and have to pay full price. Going from $48,560 to $48,561...a one dollar income increase...just cost them over $2,500 in subsidies.
This also means that instead of paying 9.86% of their income for a Silver plan, they have to pay 15.1%. And again, that assumes the average premium. If they're older (say, 60+), they might have to pay twice as much as that or more...potentially over 30% of their income. Ouch.

That 400% FPL APTC cut-off point is also known as the Subsidy Cliff, with good reason as you'll see below.
The good news is that a half-dozen Democratic Senators introduced a simple bill back in June 2017 to resolve this problem by simply removing that upper 400% FPL income subsidy eligibility cap. This has also been incorporated into H.R.5155, (otherwise known as the House ACA 2.0 bill) and S.2582 (the Senate ACA 2.0 bill), although both of those go further and also beef up the underlying subsidy formula at income levels below 400% FPL as well. Speaker Pelosi has suggested that she plans on moving ahead with the House bill this year, although obviously the odds of it going anywhere in the Senate are slim under GOP control.
This morning, the Kaiser Family Foundation posted a new analysis which focuses squarely on the Subsidy Cliff. In addition to going into the problem more thoroughly, they also include an interactive map and chart which demonstrate how ugly the situation is in visual form:
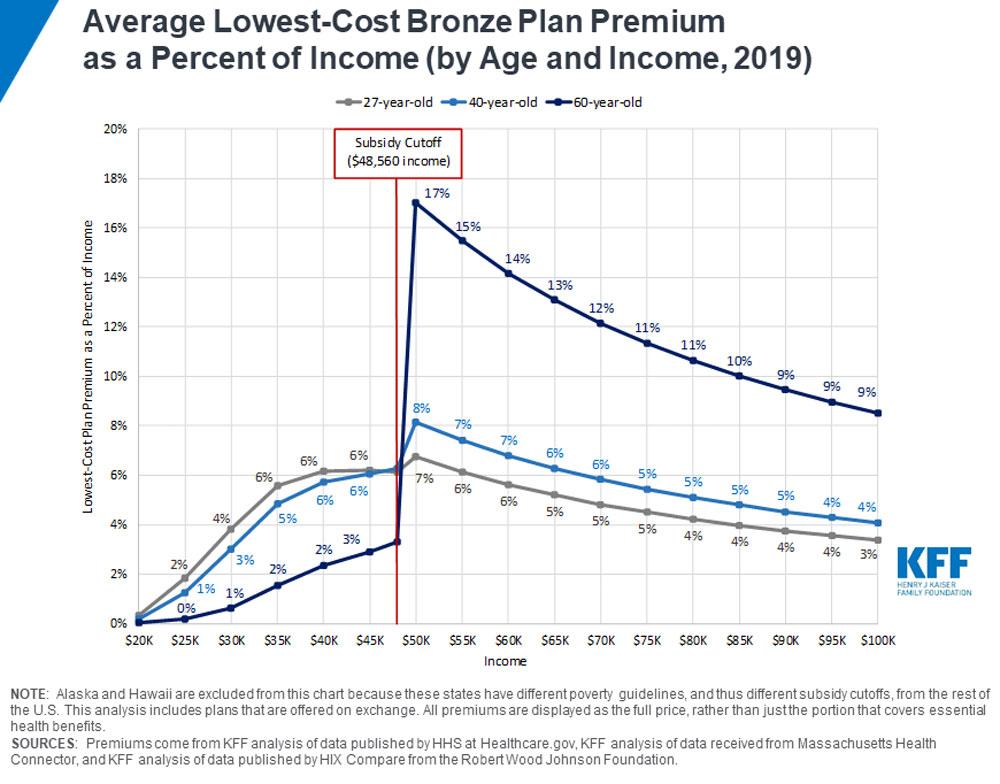
There you have it. The graph above shows three different scenarios: A single adult with no children at various income levelsranging from $20,000/year (around 165% FPL) up to $100,000/year (825% FPL), at three different ages. The sliding scale is reasonable for the 60-year old, and manageable for the 27- and 40-year old enrollees up until they hit the 400% FPL cut-off point...at which costs go up significantly for the 40-year old...and shoot into the stratosphere for the 60-year old. They go from paying around 3.5% or so of their income for a Bronze plan to a whopping 17% instantly. Note that this is for the cheapest Bronze plan, not the benchmark Silver plan.
The percent of income gradually tapers off after that...but only because you're dividing the same numerator (the unsubsidized cost of the policy) into a larger denominator (the household income). The interactive chart shows that the 6o-year old goes from paying around $108/month at $45,000 income to $708/month at $50,000. That $5,000 income boost actually costs them $7,200 more...meaning they're actually $2,200 behind.
As I noted above, it's even worse than that, really, because that cut-off would actually happen precisely at the $48,560 mark. Even adding $1.00 to their Modified Adjusted Gross Income would mean losing thousands of dollars in subsidies.
There are a bunch of things Congress needs to do to repair, protect and improve the ACA...but one of the most important ones is, again, to #KillTheCliff.
Advertisement
