

UPDATED: How much MORE will #ACASabotage cost unsubsidized enrollees NEXT year?
Mon, 06/18/2018 - 9:11am
UPDATED 6/22/18: Added Indiana and Iowa to the table.
UPDATED 6/25/18: Added Florida, Kentucky, Ohio and Texas* to the table
*(Texas only has about 1/3 of the total ACA individual market accounted for, so it could easily change)
UPDATED 7/3/18: Added Montana and Georgia to the table
UPDATED 7/13/18: Added Tennessee, updated Texas to add BCBSTX
UPDATED 7/16/18: Added Colorado
UPDATED 7/17/18: Added Nevada
UPDATED 7/19/18: Added California
UPDATED 7/20/18: Added Connecticut
UPDATED 7/23/18: Revised Oregon with final/approved rates; revised Pennsylvania with modified/semifinal rates
UPDATED 7/30/18: Added New Jersey (official preliminary) and Wisconsin with reinsurance waiver
UPDATED 7/31/18: Revised Maine to include approved reinsurance program
UPDATED 7/31/18: Added North Carolina (only BCBS, but they hold 96% of the market anyway)
UPDATED 8/2/18: Added Missouri, Alabama, Hawaii and Alaska
UPDATED 8/3/18: Added Delware, Idaho, Arkansas, Arizona and Louisiana
UPDATED 8/4/18: Added Illinois, Kansas, Massachusetts & Mississippi; major update to New York
UPDATED 8/22/18: Updated Tennessee (removed Risk Adjustment Freeze factor); Maryland (reinsurance waiver); New Jersey (reinsurance waivers) and Vermont (approved rate changes)
UPDATED 8/23/18: Updated Delaware, Ohio, Tennessee, North Carolina & Georgia w/approved rate changes
UPDATED 8/28/18: Updated Arkansas, Florida and Virginia with approved (or near-approved) rate changes
UPDATED 9/12/18: Updated Iowa, New Mexico (approved rates), Ohio (corrected 2018 premium), Rhode Island (approved rates), Texas (filled in missing carriers) and Washington State (approved rates)
UPDATED 9/17/18: Updates to Connecticut (approved rates), Massachusetts (approved rates) & Maryland (semi-approved rates after reinsurance added)
UPDATED 10/02/18: Final/approved rates for Maine, Maryland, Minnesota, Montana, Nevada and South Dakota.
UPDATED 10/04/18: Final/approved rates for Colorado.
UPDATED 10/10/18: Final/approved rates for South Carolina, Arizona & Hawaii; corrected final rates for Tennessee.
UPDATED 10/11/18: Final/approved rates for Illinois.
UPDATED 10/15/18: Final/approved rates for Kansas, Idaho and Indiana; slight correction for North Dakota
UPDATED 10/16/18: Final/approved rates for California (no change)
UPDATED 10/18/18: Final/approved rates for Wyoming (no change), District of Columbia and Pennsylvania
UPDATED 10/30/18: Final/approved rates for Louisiana, Michigan, Oklahoma and Washington StateFINAL UPDATE 11/08/18: Final/approved rates for ALL 50 STATES + DC
There's tons of ACA/healthcare policy stuff going on this week (rightly overshadowed by the grotesque child kidnapping/psychological torture atrocities being committed by the Trump Administration of families asking for political asylum). However, I had/have a funeral and two meetings today, so I only have time for one post.
Back in April, I posted a detailed analysis of just how much unsubsidized enrollees in ACA-compliant individual market policies are paying this year specifically due to last year's deliberate sabotage efforts by Donald Trump and Congressional Republicans. That is, I broke out the total premium increases for each state into "normal" factors (medical trend, reinstatement of the carrier tax, etc) from sabotage factors (which mainly included Trump's arbitrary decision to cut off Cost Sharing Reduction (CSR) reimbursement payments as part of his stated attempt to "blow up Obamacare", etc.
This also included smaller factors like concerns over enforcement of the individual mandate, the 90% cut to HealthCare.Gov's marketing budget, the 40% cut to HC.gov's outreach/navigator budget and so on.
For 2018, I estimated that nationally, the average unsubsidized ACA-compliant individual market enrollee is paying around an additional $80/month or $960/year due specifically to GOP sabotage efforts. This ranges from a nominal $24 total ($2/month) in Vermont to a whopping $1,584 ($132/month) in Mississippi.
But what about next year? In May, I went back in and crunched some estimates by the Urban Institute and the Center for American Progress to try and get an idea of how much more unsubsidized enrollees will be paying next year on top of that, due to this year's batch of sabotage effrots by Trump and the GOP. Specifically, this includes the impact of the Individual Mandate being repealed (which is quite different from being concerned about it being enforced), and the Trump Administration shredding regulations on Short-Term, Limited Duration (STLD) plans and Association Health Plans (AHPs). As regular readers know, I've shorthanded both of these as #ShortAssPlans.
My initial projection for the additional impact of this year's #ACASabotage was around $1,020/year per enrollee ($85/month).
However, in addition to ranging widely by state, these were projections based on certain assumptions only. Now that I have the actual preliminary rate filings for 19 states, including hard number breakouts by the carriers themselves in 6 of them, I can start re-running the numbers using more accurate estimates. So far they range from just $50 in Rhode Island (where the current batch of sabotage appears to only account for about a 1 percentage point rate hike, or a mere $4/month) to as much as $1,075 more in Pennsylvania ($90/month).
(Update 7/23/18: Thanks to a thorough review of their filings by the state Insurance Dept., PA premiums will actually "only" go up around $516 due specifically to ACA sabotage efforts next year for whatever that's worth).
How can that be, given that Pennsylvania carriers are only requesting a 4.9% 0.7% average increase in the first place, and given that Minnesota carriers are requesting an average rate drop even with these factors? Easy: Many carriers in many states would be lowering their 2019 premiums if not for the mandate/#ShortAssPlans factors...or, in the case of Minnesota, they'd be lowering them even more than they already are now. That's not wishful thinking or hyperbole on my part; this is coming directly from some of the carriers themselves.
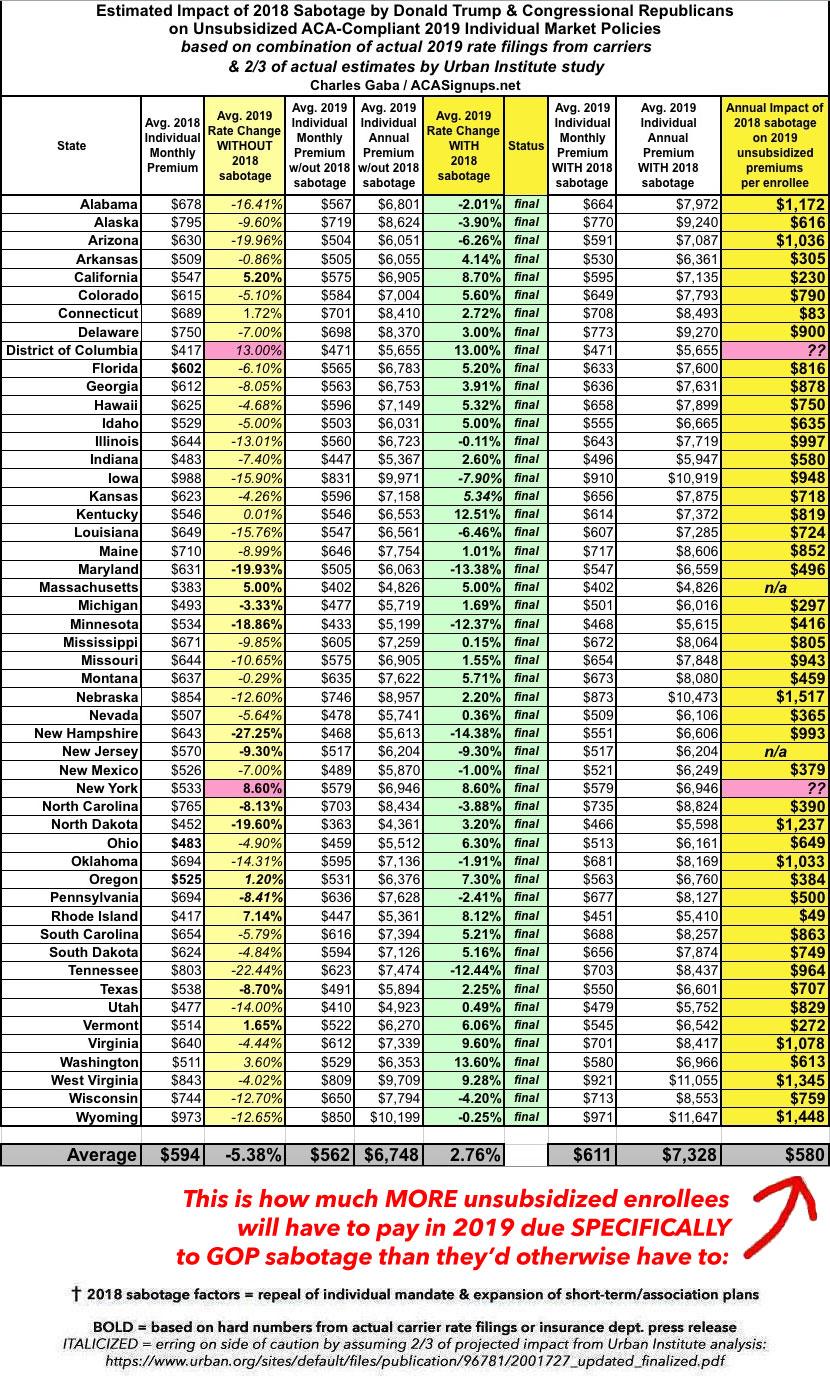
As noted in my explainer post and in the graphic below, in the states where I don't have hard breakout numbers from most of the carriers themselves, I'm using a conservative reading of the Urban Institute's estimates, by only assuming 2/3 of their projections. For instance, in Pennsylvania they assumed an additional 19.2 point load; I'm only using 12.8 points, and so on.
Some of these numbers will shift around as the rate changes are reviewed, changed and/or approved over the course of the summer and early fall, but this gives a pretty good sense of where things stand today:
Advertisement
