

UPDATE: CBO: *WITH* ACA, exchange growth pretty much done...but no death spiral either
Tue, 01/24/2017 - 7:30pm
As has been obvious for some time now, the early projections by the Congressional Budget Office back in the pre-exchange days of 2010 - 2013, which foresaw ACA exchange enrollment heading into the 20-million-plus range by this point, obviously not only never came to pass, but are unlikely to do so anytime in the near future under the current legal/healthcare policy structure. There are several reasons for this ranging from legitimate problems with the structure of the ACA itself to Republican obstruction, but the two most obvious errors the CBO made in their projections were:
- They assumed that a good 4 million off-exchange enrollees would shift onto the ACA exchanges. This happened to a small degree, but for the most part, these tended to be people who didn't qualify for APTC assistance and would therefore have to pay full price. Since the only real reason to jump through the extra hoops to enroll via the exchanges (as opposed to simply enrolling directly through the carrier) is for the financial assistance, this never made much sense to me.
- They also were expecting several million people to be kicked off of their employer-sponsored insurance onto the individual market exchanges, which also didn't really happen (or, if it did, it was mostly cancelled out by employers hiring more people than expected as the economoy bounced back faster than expected). This is actually a very good thing in terms of the overall economy...but it still left the exchanges coming up several million enrollees short.
Regardless of the reasons, the fact remains that instead of a lofty 23 million people, the exchanges maxed out at 12.7 million last year...actually more like 11.3 million who actually paid their first monthly premium, and of only around 9 million were still enrolled by the end of the year. That's a monthly average of perhaps 10 million exchange enrollees for the full calendar year. For 2017, instead of the ~1.1 million enrollee growth that both the HHS Dept. and I were originally hoping for, it now looks like total exchange enrollment will be flat year over year...slightly ahead, but possibly slightly behind last year.
The CBO has just come out with a new 10-year projection which reflects this new reality:
Federal Subsidies Under the Affordable Care Act for Health Insurance Coverage Related to the Expansion of Medicaid and Nongroup Health Insurance: Tables from CBO's January 2017 Baseline
The Expansion of Medicaid and Nongroup Health Insurance Under the Affordable Care Act
Because of the complexity of the analysis involved, the Congressional Budget Office and the staff of the Joint Committee on Taxation (JCT) generally produce one major update per year to their 10-year projections of health insurance coverage for people under age 65. In preparing the January 2017 baseline, the agencies did not undertake a complete update of those coverage projections, but did update projections of insurance coverage that has the greatest effects on the federal budget and of the associated subsidy costs.1 CBO’s projections were completed before the new Administration took office on January 20, 2017. They do not incorporate any effects of executive orders or other actions taken by that Administration.
Health Insurance Coverage
The updated projections focus on the coverage stemming from the expansion of eligibility for Medicaid under the Affordable Care Act (ACA) and the nongroup coverage purchased through the health insurance marketplaces (sometimes referred to as exchanges).
Medicaid.
By CBO’s estimates, an average of 12 million noninstitutionalized residents of the United States under age 65 will have health insurance in any given month in calendar year 2017 because they were made eligible for Medicaid under the ACA. That expanded eligibility for Medicaid applies principally to adults whose income is up to 138 percent of the federal poverty guidelines; the federal government pays nearly all of the costs of expanding Medicaid coverage to those new enrollees. On average, 17 million people are projected to have such coverage in 2027, if current laws remained in place.
Nongroup Coverage.
In addition, CBO and JCT estimate that, in calendar year 2017, 9 million people per month, on average, will receive subsidies for nongroup coverage purchased through the health insurance marketplaces established under the ACA. Subsidized health insurance is now available to many individuals and families with income between 100 percent and 400 percent of the federal poverty guidelines who meet certain other conditions; they can purchase coverage through designated marketplaces and receive tax credits that subsidize their insurance premiums, as well as cost-sharing subsidies. That number is projected to be 11 million in 2027 under current law.
Overall, including people who do not receive subsidies for their insurance, CBO and JCT expect that 10 million people per month, on average, will have insurance purchased through the marketplaces in 2017; that number is projected to grow to 13 million by 2027. Not all nongroup coverage is purchased through the marketplaces. In total, CBO and JCT estimate that 18 million people will have nongroup coverage in 2017 and that 20 million people would have such coverage in 2027. From 2017 through 2027, under current law, the number of uninsured people under age 65 would remain around 27 million or 28 million.
Federal Subsidies
CBO and JCT currently estimate that federal spending for people made eligible for Medicaid by the ACA will be $70 billion, or 0.4 percent of gross domestic product (GDP), in fiscal year 2017. Such spending is projected to rise at an average annual rate of about 7 percent, reaching $142 billion (or 0.5 percent of GDP) in 2027. For the 2018–2027 period, such spending is projected to total $998 billion if current laws remained in place.
The agencies also estimate net federal subsidies for coverage obtained through the marketplaces to be $49 billion, or 0.3 percent of GDP, in fiscal year 2017. Those subsidy amounts are projected to rise at an average annual rate of about 9 percent, reaching $110 billion (or 0.4 percent of GDP) in 2027. For the 2018– 2027 period, the net subsidy is projected to total $919 billion under current law.
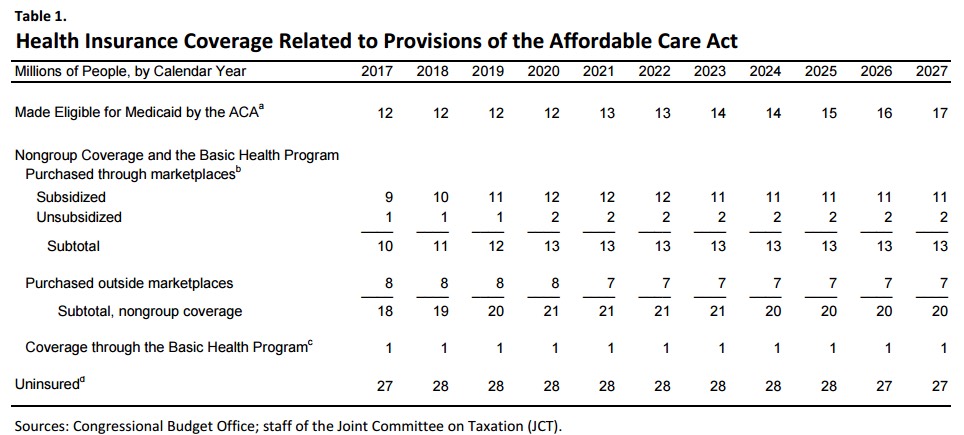
There's a lot going on here, but it boils down to the following: ASSUMING the ACA isn't repealed, and that there aren't any other substantial changes (positive or negative) to the healthcare system otherwise, for the current year, the CBO now projects:
- 2017: 12 million enrolled in Medicaid specifically via ACA expansion (a footnote clarifies that "woodworkers" are not included in this figure, contrary to the nonsense being thrown around by some ACA opponents)
- 2017: 9 million subsidized exchange enrollees, 1 million unsubsidized (on exchange), 8 million unsubsidized (off exchange)
These numbers match pretty closely to my own estimates. Assuming ~13 million QHP selections by next week, 10% likely won't pay up (11.7 million actually enrolled), which would then likely gradually drop off to around 9.7 million by the end of the year, averaging around 10 million per month. Since ~85% of exchange enrollees are subsidized, that means a 9:1 ratio (CBO rounds things off to the nearest million).
The CBO's Medicaid expansion number is about 2.3 million lower than my estimate...but my number includes around 1.9 million other folks who enrolled via New York's pre-ACA waiver which has since expired; it looks like the CBO doesn't count them here.
They openly acknowledge my second bullet point at the top (far fewer losing ESI coverage than thought):
Relative to CBO's March 2016 baseline, CBO and JCT reduced their estimates of the number of people enrolled through the marketplaces because actual enrollment in 2016 and 2017 has been lower than previously projected. Recent data also indicate that the number of uninsured people is close to the agencies' projections and that fewer employers have stopped offering insurance coverage in response to the ACA than the agencies had previously expected. As a result, CBO and JCT have increased their projections of enrollment in employment-based coverage and expect that most of the people who are no longer projected to obtain insurance through the marketplaces will instead be covered by employment-based insurance.
They also include some other noteworthy footnotes:
a. (Medicaid) Includes only people who became eligible for Medicaid under the expanded eligibility criteria established by the ACA. CBO estimates that some other people would have been eligible for Medicaid without the ACA but chose to enroll as a result of the ACA's enactment. Those enrollees are not counted here.
In other words..."woodworkers", which I estimate at roughly 3.6 million people, are not included.
Also, for the first time, the CBO is finally breaking out/acknowledging the impact of the ACA's basic health program. They didn't bother as long as it was limited to Minnesota, since the numbers were nominal (around 90,000 people), but last year New York jumped into this program as well, and total BHP enrollees are up to over 700,000 between the two states...enough to justify being listed separately:
c. The Basic Health Program, created under the ACA, allows states to establish a coverage program primarily for people with income between 138 percent and 200 percent of the federal poverty guidelines. To subsidize that coverage, the federal government provides states with funding equal to 95 percent of the subsidies for which those people would otherwise have been eligible by purchasing health insurance through a marketplace.
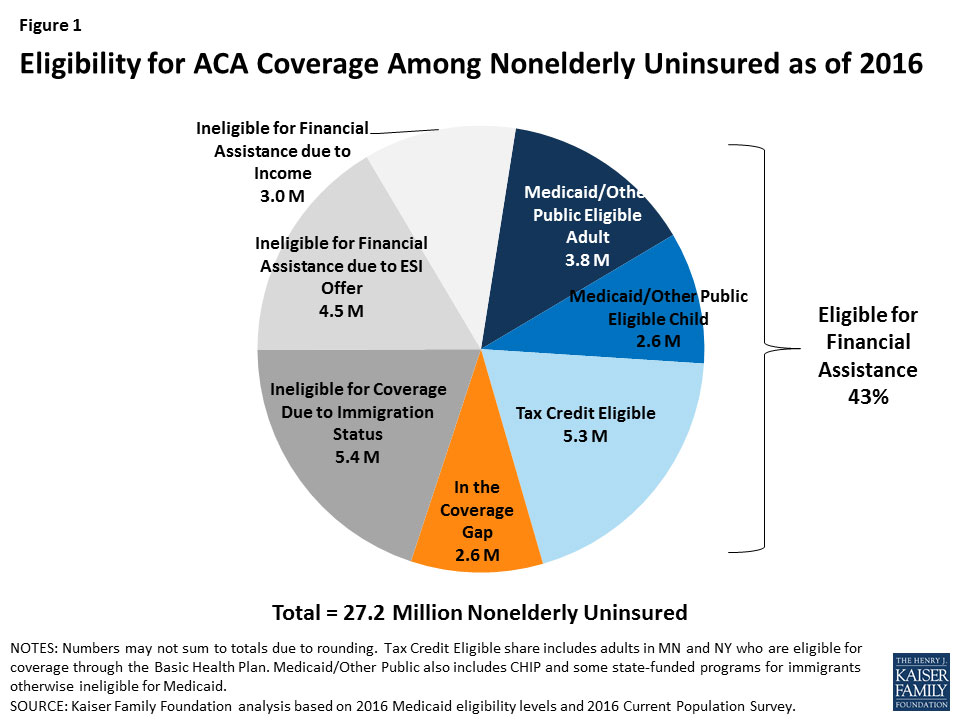
Finally, they take note of the fact that huge chunks of the 27-28 million people expected to remain uninsured are completely outside of the ACA's authority to cover:
d. Includes unauthorized immigrants, who are ineligible either for marketplace subsidies or for most Medicaid benefits; people ineligible for Medicaid because they live in a state that has not expanded coverage; people eligible for Medicaid who do not enroll; and people who do not purchase insurance available through an employer, through the marketplaces, or directly from an insurer.
The first three categories (undocumented immigrants, Medicaid Gap population and people who never bother signing up for Medicaid) make up over half of the remaining uninsured, according to the Kaiser Family Foundation:
So, what's my takeaway from all of this?
Well, first of all, while the CBO is no longer projecting the individual market to grow over the next decade (they expect it to hover around the 20 million mark the whole time), they also aren't expecting it to shrink either.
Secondly, assuming the ACA somehow manages to survive the current carnage relatively intact after all, it looks like there's little point in continuing the original, core mission of this website. If exchange enrollments are expected to pretty much remain flat year over year, The Graph is likely to be pretty boring going forward, effectively a carbon copy each year. That doesn't mean I should pull the plug on the site, it just means that other features would take center stage.
Finally, the CBO is now stating, flat out, that prior to Trump taking office, the GOP starting the ACA repeal process, Trump's "sabotage" executive order and so forth, they were projecting average subsidies for ACA exchange enrollees to increase at a rate of roughly 9% per year for the next decade.
Why is this important? Because, by dividing this average into the expected number of subsidized enrollees, we can get a rough idea of how much the CBO expects premium rates to go up accordingly...because the subsidies tend to go up to match the rate hikes:
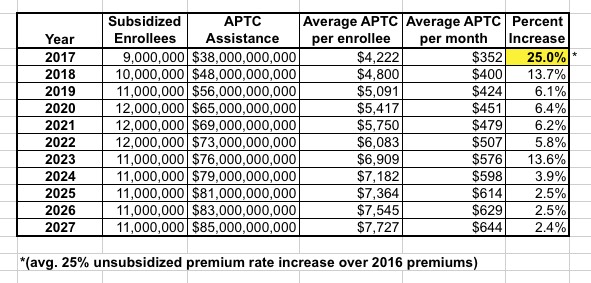
This is a pretty crude comparison, of course, since these numbers are all so fluid and the APTC increase isn't an exact correlation to the actual premium increases, but it looks to me like the CBO is expecting 2018 rates to go up another 13-14% next year (which is bad) but then to drop back down to a relatively nominal 6% or so annual increase after that. For some odd reason they then have it shooting up another 13-14% in 2023 before dropping back to nominal hikes of 2-4%.
Again, this is all speculative, but the bottom line is that the CBO is stating pretty clearly that with the ACA, while they don't see the individual market being in the greatest shape, neither do they see a death spiral under the current law.
On the other hand, a week or so back the CBO issued another report speculating on the impact of the ACA being partially repealed...and the prospects were far grimmer:
Premiums in the nongroup market (for individual policies purchased through the marketplaces or directly from insurers) would increase by 20 percent to 25 percent—relative to projections under current law—in the first new plan year following enactment. The increase would reach about 50 percent in the year following the elimination of the Medicaid expansion and the marketplace subsidies, and premiums would about double by 2026.
Again: That's relative to projections under current law. Here's a modified version of the table I whipped up last week, using the above average current projection rate hikes as a guideline:
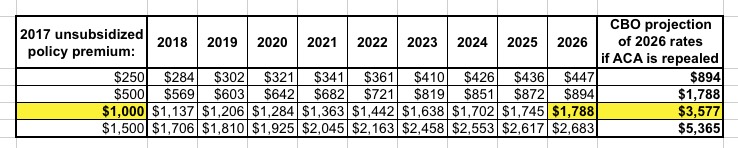
Yep...by 2026, with the ACA, an unsubsidized, comprehensive policy would be expected to go up by 78% over today's rate, which is a problem...but if the ACA is repealed without a half-decent replacement plan in effect, that premium would be a whopping 257% higher.
UPDATE: Well, the American Academy of Actuaries has also chimed in, and if anyone should know about this stuff, they should:
Yet non-partisan healthcare groups that have studied the law say that while [the ACA] has some serious problems and faces challenges, they do not see it as collapsing into a death spiral.
The American Academy of Actuaries is a prime example.
The group, which represents the people who analyze data for insurance companies, says there is no evidence that ObamaCare is in a death spiral or that it is on the verge of collapse.
“I don’t really see evidence of that happening right now,” said Cori Uccello, the organization’s senior health fellow.
...The problem with the argument, according to Uccello, is that ObamaCare’s enrollment is actually holding steady and not dropping off.
The latest administration figures show 8.8 million people have signed up for 2017 coverage, slightly higher than the 8.7 million at the same point last year.
“Enrollment seems to be holding fairly steady, as well as the age distribution,” Uccello said. “These things are not indicative of a premium spiral.”
(Note: Actually, that 8.8 million figure only refers to the federal exchange, HealthCare.Gov; if you account for the fact that Kentucky is included this year, enrollment is essentially flat. Nationally, I've confirmed 11.8 million QHP selections, plus another 700,000 BHP enrollments to date, and expect total enrollments to be pretty close to flat overall)
Premiums did increase sharply, with an average rise of 25 percent for coverage in 2017.
But a report from analysts at Standard & Poor’s in December found that 2017 was a “one-time pricing correction” and premium increases for 2018 would be “well below” that amount.
“Obviously, 2016 is not a death spiral,” said Deep Banerjee, an S&P analyst and one of the authors of the report. “We don’t think 2017 will be a death spiral either.”
...Some analysts think Republican repeal efforts actually could make things worse.
Uccello, for example, warned that repealing the mandate could actually bring about a death spiral, since the Congressional Budget Office has estimated that it could raise premiums by 20 percent.
(Note: As I noted last week and again above, that 20% would be on top of whatever the rates would otherwise be expected to increase by.)
She also noted that uncertainty around what Congress will do could hurt the market.
“Uncertainty is not something that bodes well,” she said. “Insurers need to know what’s going on.”
Advertisement
