

Analysis claims 31% of policies facing double-digit rate hikes...but it's missing half the story.
Sat, 09/05/2015 - 3:39pm
Over at CNBC, Dan Mangan has a story about a new report from Agile Health Insurance which claims that 31% of "Obamacare Individual Marketplace Products" are facing double-digit rate hikes next year.
Basically, they looked at the total number of products (ie, collections of plans from the same insurer) in each state and broke them down by how many were seeking rate hikes of <10%, 10-20%, 20-30% and >30%, then divided those policies into the total number offered in the state.
Agile's report concludes that
Overall, 31 percent of Obamacare individual marketplace products had a double-digit rate hike proposed for 2016. Fourteen percent of Obamacare products on the federal exchange had a proposed rate hike of at least 20 percent, while 7 percent of products had a proposed rate hike of at least 30 percent.
It's important to read Mangan's opening sentence carefully, however:
Insurers have asked for double-digit rate increases for nearly 1 out of every 3 Obamacare plans that will be sold on HealthCare.gov for 2016 coverage, according to a new analysis.
The bold-faced part above is pretty important; I'll get back to that in a moment.
There's nothing technically inaccurate about the report itself, although the main reason for Agile publishing this report in the first place appears to be to try and push "Term Health Insurance as an alternative to Obamacare"...in other words, short-term, non-ACA compliant policies:
AFFORDABLE CARE ACT TAX. Term health insurance is not considered “minimum essential coverage” and you may be subject to the Affordable Care Act uninsured tax if you do not qualify for an exemption. To learn more about the tax and how consumers can determine if the combination of the tax and a Term Health Insurance premium can be cheaper than traditional insurance for their circumstances, see here
I'm not attacking Agile for offering (or promoting) short-term policies; for some people they may be a reasonable alternative in a pinch, and could conceivably still prove to be less expensive even with the ACA's individual mandate tax penalty. However, it's an important fact to help keep this report in context.
Nor am I criticizing Agile's report for basing the "31%" on the total number of products offered. There's nothing wrong with using this as one method of trying to suss out rate hikes next year; here's how they define it:
A product is a collection of plans from the same insurer. Products may contain plans with different metal levels. The overall rate hike of the product is the enrollment-weighted average of the rate hikes of its plans. In this study, rate hikes were compared for products and not for plans.
However, there's two very important caveats stated in Mangan's lede:
- First, Agile's report doesn't include the state-based exchanges, including major states such as California, New York and Washington State.
- Second, and just as significantly, even for the 37 states included, they're only including exchange-based policies, completely ignoring off-exchange policies even though they comprise around 40% of the total ACA-compliant individual enrollments this year (around 7-8 million nationally, vs. the 10.4 million currently enrolled in exchange-based policies):
Double-digit proposed rate hikes for 2016 Obamacare products were collected from ratereview.healthcare.gov. Proposed rate hikes were collected for products that included metal plans in states that use the federal Obamacare exchange at healthcare.gov. 2015 Obamacare products without double-digit rate hikes were identified using the 2015 QHP individual market medical landscape files for qualified health plans in the federally-facilitated marketplace states, as well as Nevada, New Mexico, and Oregon.
...The number of Obamacare products in each state’s marketplace in 2015 was counted from the 2015 QHP landscape files. The number of products with double digit proposed rate hikes that were on the 2015 marketplace in each state was counted using ratereview.healthcare.gov and the 2015 QHP landscape files. The percentage of products with a double-digit proposed rate hike was calculated by dividing the second number by the first number. For example in Illinois, there were 37 Obamacare products that included metal plans from the 2015 QHP landscape file and 8 of those products with double digit proposed rate hikes from both the 2015 QHP landscape files and ratereview.healthcare.gov. Therefore 8 / 37 = 21.62 percent of Obamacare products on the exchange in Illinois had double-digit proposed rate hikes.
Did you catch that? Basically, they're only using products/policies which are offered on Healthcare.Gov, not the ones which are only offered off of the federal exchange. In addition, they also aren't including products from states running their own ACA exchange, such as California, New York, Kentucky and so on. Combined, these 13 states (+DC) make up about 25% of the total ACA exchange enrollments.
Mangan notes this farther down the article:
Officials also cited that the rates on two of the largest state-run Obamacare marketplaces, California and New York, will have relatively modest overall price hikes for their plans in 2016. The states cumulatively accounted for more than 15 percent of total U.S. Obamacare sign-ups.
California's insurance exchange has said the statewide average weighted rate increase for 2016 will be 4 percent. Plans on New York's exchange will rise by an average of more than 7 percent.
Again, Agile isn't lying about either of these facts; the main table specifies the 31% as referring to "All States Using Federal Exchange" and the title of the report specifically refers to "Obamacare Individual Marketplace Products Nationwide" (although the "Nationwide" bit is a bit misleading, since it doesn't include 1/3 of the states).
However, this still does mean that the "31% of products are over 10%" claim could very well be flat-out wrong, for both reasons.
New York, for instance, has a total of 17 companies operating on the exchange, of which only 4 were approved for rate hikes greater than 10%, or 23.5%...but they aren't listed here. For that matter, New York may have far more than 17 "products" total, since a single company often offers more than one group of "products" (I assume PPOs are one "product", HMOs another, MultiState a third and so forth?)
For comparison, look at Illinois. According to the official filings, Illinois only has 8 actual companies offering individual policies next year...but the Agile survey states that they have 37 total products. For all I know, New York could have 40 or 50 "products" by this measure.
California, meanwhile, has only 12 actual companies offering policies on the ACA exchange...but those 12 could have several different "products" each. Add in Washington, Kentucky, Connecticut and the other dozen or so state-based exchanges, and that 31% "national" figure could end up being quite different.
That leads to the other point: Off-exchange-only policies aren't included whatsoever in any state. This is important because while there are some states with minimal off-exchange individual policies (especially Vermont and the District of Columbia, neither of which are even allowing off-exchange policies to be sold anymore), some states still have significant numbers of people enrolled in off-exchange, ACA-Compliant policies...which means they're part of the same risk pool.
Let's look at Florida. Agile's report claims that 14% of Florida's "products" are >10% and 3% of them are above 20%. That's not too bad, but how many "products" are they leaving out of this equation?
In Florida, here's the official number of effectuated enrollees in 4 different types of individual policies as of 3/31/15 straight from the FL Office of Insurance Regulation, as I noted back in early August:
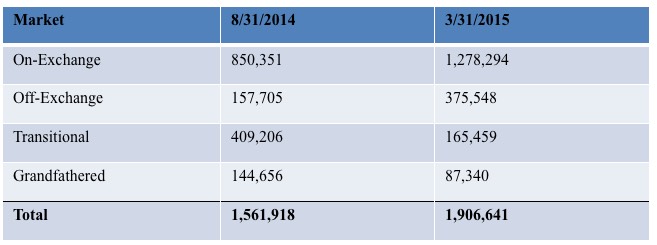
As you can see, even disregarding "Grandfathered" and "Transitional" policies (which use a different risk pool anyway), there's still over 375,000 people, or about 23% of the total, who are enrolled in off-exchange policies. In other states it's closer to 50/50, and nationally I estimate that off-exchange enrollees make up perhaps 40-45% of the total individual market (7-8 million); a pretty significant number to brush off.
Now, you could argue that a large number of those enrollees are enrolled in the same plans from the same companies as the Healthcare.Gov enrollees, and therefore this doesn't change anything.
That's partially true...but again, look at this from the FLOIR:
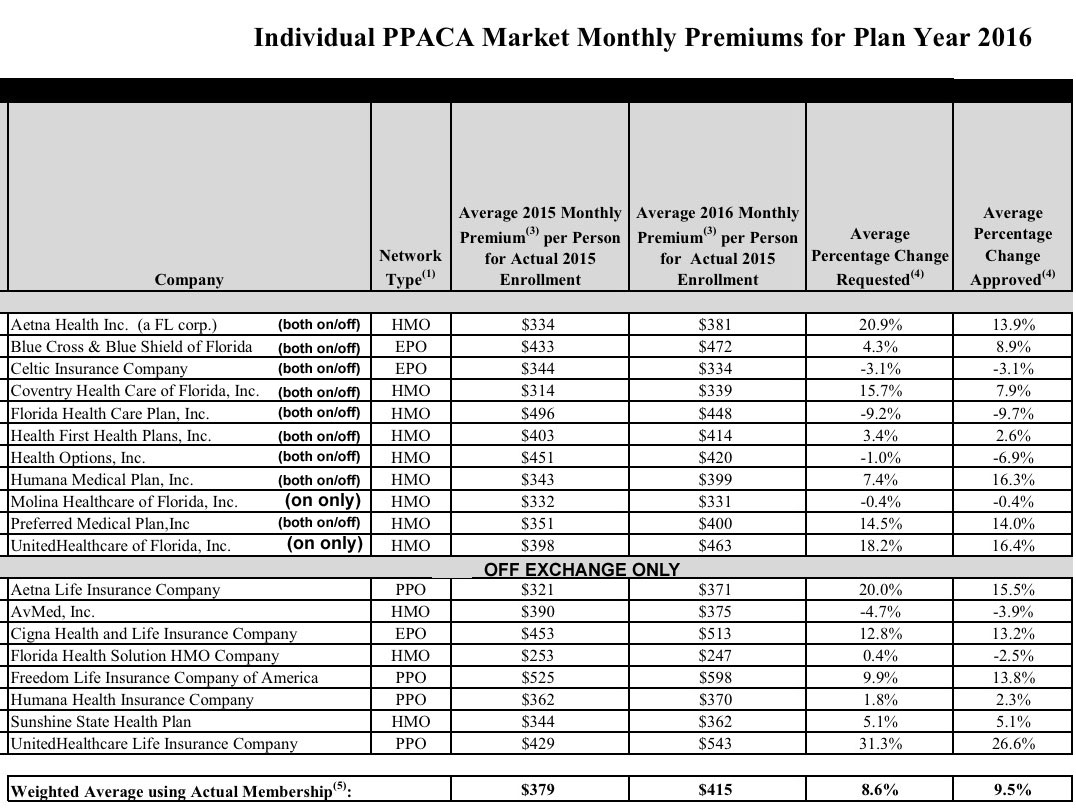
Some of the companies are listed in both categories, but they're still offering separate products. Out of 19 total, 8 are only offered off-exchange, meaning, if I'm not mistaken, that these are by definition separate products from those offered either on-exchange or both on and off-exchange. From what I can tell, the Agile report doesn't include any of these.
So, am I saying that Agile is overstating the percent of products higher than 10%, 20% or 30% nationally?
No, I'm not.
For all I know, 31% could be accurate...but it could also be too high or too low by a significant amount.
Look at that list of Florida companies again. 4 of the first 11 are above 10%...or 36%. Yet, Agile says that only 14% of FL products are double-digits. That suggests that at least one of these companies has multiple "products" within their listing.
More to the point, however, 4 of the 8 the off-exchange companies (50% of them) were approved for >10% hikes. Depending on the total number of "products", this could seriously skew Florida's "14%" figure up...or down.
Want proof of this (in a negative way)? Look no further than South Dakota.
So, what percentage of the total "products" offered on the individual market nationally are facing double-digit hikes? Well, it could be 31%. Or it could be 50%. Or it could be 20%. Without the missing states and the off-exchange-only products included, it's really impossible to tell (though it sounds like it's likely to be somewhere in the 20-40% range overall).
The point here is, as always, to be careful about any study of this nature (including my own). Make sure to check the methodology and see what was left out, why it was left out and whether the source is up front about that fact.
Advertisement
