

2016 Rate Increases: Where Things Stand Nationally/State-by-State (12-14% overall)
Fri, 08/28/2015 - 11:48pm
NOTE: THIS POST HAS BEEN UPDATED WITH ALL 50 STATES HERE.
- 10/15/15: Added Pennsylvania with approved rate average
- 10/12/15: Updated South Carolina with approved rate average
- 10/8/15: Added Nebraska (approved rates)
I spent most of July and August simply overwriting/updating the original version of this entry, but now that the approved 2016 premium rates are starting to pop up all over (the deadline for approval of exchange policy rates was a few days ago), I figured it was time to start fresh.
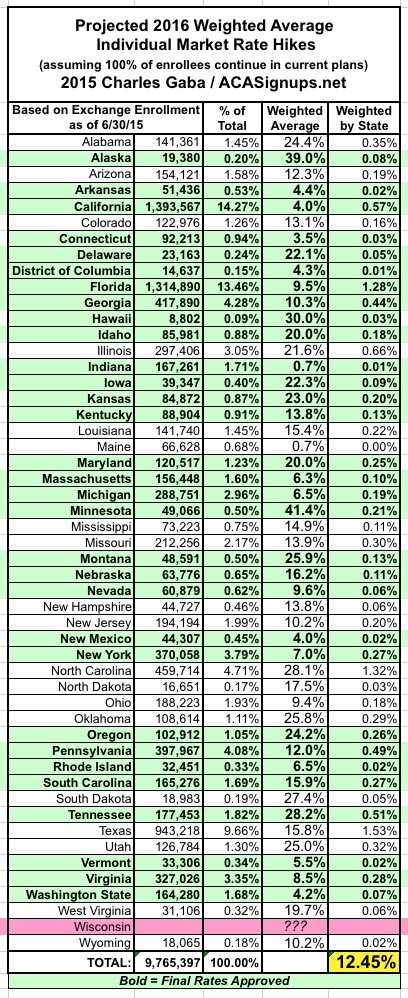
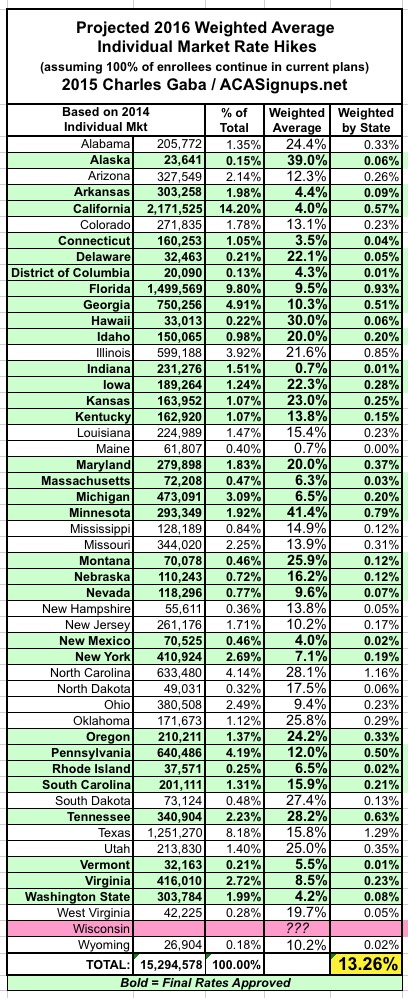
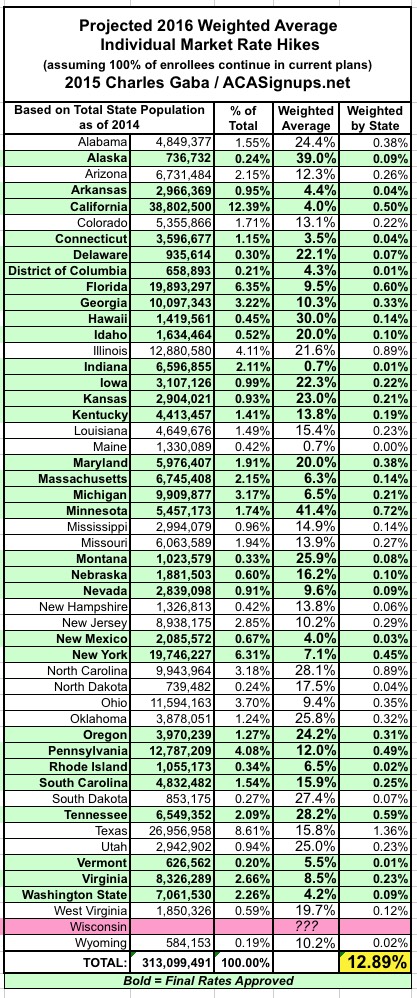
OK, so what I've done here is to take the overall weighted average 2016 rate increases for the ACA-compliant individual health insurance market for each state (requested in some states, approved in others) and plug those into a spreadsheet. Then, I've further weighted each state's average increase by that state's percentage of the national total, using 3 different criteria: Total Individual Market (as of 2014); ACA Exchange Enrollment Size (as of March 2015); and Total State Population Size (as of 2014). Again, the bold-faced/green states are ones where the 2016 rates have been approved; the rest are still requested only and could change dramatically in some cases.
I used these 3 criteria because there are large demographic differences from one state to another (ie, some have a disproportionately higher number of residents in the individual market, others have a disproportionately lower number of ACA exchange enrollees and so on)...yet as you can see, even with all of that, the weighted average of all three seem to be remarkably close.
Again, some important caveats:
- This includes 48 states (+DC), making up around 94% of the total U.S. population. The 2 missing states (Pennsylvania and Wisconsin) could skew the average up or down slightly, although at this point it's not likely to make much of a difference.
- Many of the states are only partly weighted and include educated guesses/assumptions about the total individual enrollment risk pool size or market share for individual companies.
- 19 states have requested rate changes only, not approved ones; the final, approved rates could end up being quite different in some cases.
- If you want to see the number-crunching for the individual states, use the "State" drop-down menu on the right-hand side of the website (or scroll down below the main site to find it if you're using a smartphone). I'm more certain of my estimates for some states than others based on the clarity/completeness of the data, but I'm pretty confident about it overall.
-
With 94% of the population accounted for, I've added "best-case", "mid-range" and "worst-case" scenarios for the 3 remaining states: 5% average hikes (unlikely); 15% average hikes (likely); and 25% average hikes (possible, but hey, I'm an optimist).
With all that in mind, as of October 15th, no matter how I slice it, the national weighted average increase for 2016 seems to be somewhere between 12% - 13%.
Advertisement
