OK, my math here is gonna be a bit sloppy, but I'm just trying to illustrate a larger point about how splitting risk pools is, generally speaking, a Bad Thing.
Under the Affordable Care Act, non-ACA compliant healthcare policies were given until December 31st, 2013 to become fully ACA-compliant, including the new regulations mandating guaranteed issue, community rating, essential health benefits, no more annual or lifetime limits on coverage and so forth. All major medical policies offered from that day forward had to be fully ACA compliant (although there were some exceptions for short-term plans and so forth).
However, there was an exception made: Any existing policy which someone had been continuously enrolled in since before the ACA was signed into law by President Obama in March 2010 was considered to be "grandfathered" in. As long as the insurance carrier chose to keep offering those non-compliant policies, existing enrollees could remain enrolled, although premiums would of course increase from time to time. The "locked in" pool of enrollees would gradually dwindle as enrollees died, aged onto Medicare, got jobs with employer coverage and so on.
Former Wyoming Blackjewel LLC coal miners who have been out of work since July 1 and without health insurance since their group health plan was canceled Aug. 31 can sign up for the federal health insurance marketplace retroactively to Sept. 1.
The Wyoming Department of Insurance has successfully lobbied the Centers for Medicare and Medicaid Services (CMS) to make an “exceptional circumstances” special enrollment period through Oct. 30, said Denise Burke, an attorney with the state Department of Insurance.
The exception allows former Blackjewel coal miners an option to buy health insurance off the marketplace and made it retroactively effective to Sept. 1, which means workers and family members with ongoing health issues can continue treatment as if they never lost insurance.
LAS VEGAS (KLAS) — In a statement issued by Nevada Health Link, the organization announced that it had become aware that the Federal Health Insurance Marketplace, known as HealthCare.gov had incorrectly sent notices to Nevada consumers regarding the upcoming open enrollment period.
The incorrect notices were sent to Nevada consumers via mail, email and through notices on the HealthCare.gov portal.
"These notices from the Marketplace were sent in error. Nevadans who received these notices from the Marketplace should be aware that NevadaHealthLink.com is the only place to get enrolled in a qualified health plan during the next open enrollment period beginning on November 1, 2019," said Heather Korbulic, Executive Director for the Silver State Health Insurance Exchange.
Nevada consumers are asked to reach out to the Nevada Health Link consumer assistance center for further questions by calling 1-800-547-2927.
Back in June, I noted that the Michigan legislature was trying to slap a band-aid on the terrible GOP-passed & signed Medicaid work requirement bill (aka "God's Safety Net" bill) which passed about a year ago.
As you may recall, the original bill added fairly draconian work requirements to Michigan's implementation of the ACA's Medicaid expansion program, known here as "Healthy Michigan". Around 670,000 Michiganders are covered by the program (the number fluctuates between around 650K - 700K from week to week) today.
At the time, several reports had come out putting the number of people likely to lose healthcare coverage under the new requirements (which go into effect on January 1st, 2020) as high as 183,000 statewide, or as much as 28% of the total covered population...thousands of whom would lose coverage even if they do comply with the rules but aren't able to comply with the reporting requirements.
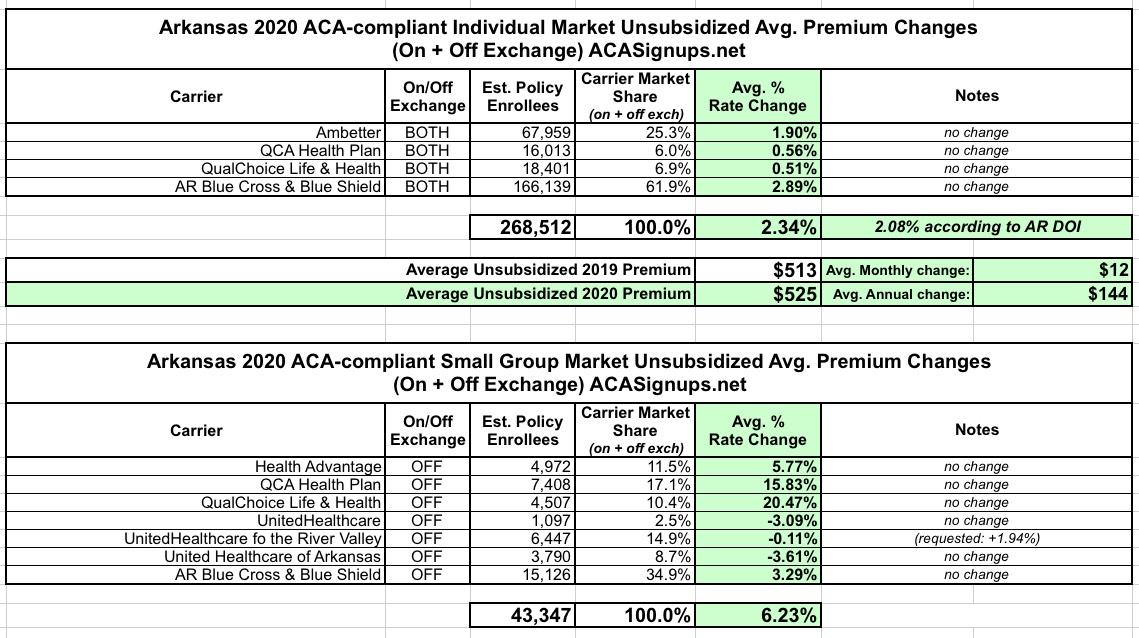
The Arkansas Insurance Dept. just posted their approved 2020 individual and small group market premium rate change requests. For the most part it's pretty straightforward: Individual market premiums are increasing about 2.3% statewide, while small group plans are going up 6.2% overall. This is virtually unchanged from their preliminary rate requests in July, although a single small group carrier had their request reduced from +2% to -0.1%, lowering the overall weighted average by a mere 0.2 points:
Regular readers may have noticed that this is my first blog entry in several days, which is unusual for me. I admit I've been mesmerized by the dramatic Trump/Ukraine/Impeachment saga which has exploded over the past few days.
I'm back in gear today, however, and I'm starting things off with my latest freelance piece over at healthinsurance.org. It's basically a summary explainer of where things stand re. 2020 ACA individual market premiums. As anyone who follows this site knows, the answer this year is basically...FLAT, at least nationally.
The irony of this, of course, is that the 800 pound gorilla in the room is the pending #TexasFoldEm lawsuit decision by the 5th U.S. Court of Appeals, which could potentially tear down the entire Affordable Care Act...and their decision in the case is expected to be released any time over the next five weeks...just ahead of the 2020 Open Enrollment Period.
Long-time readers may have noticed that, while I've obviously ripped on the Trump Administration a lot for the various ways they've screwed around with administration of the ACA over the past 2 1/2 years, there's a handful of actions they've taken which I haven't criticized them for...or at least, which I've been fairly circumstpect about being too critical about.
The biggest, and perhaps most surprising, of the latter is the Centers for Medicare & Medicaid (CMS) decision to shorten the offiical Open Enrollment Period (OEP) roughly in half, from three months (Nov. 1st - Jan. 31st) down to just six weeks (Nov. 1st - Dec. 15th). There's a couple of reasons for this.
Overall individual rates increased an average of 9.0 percent and small group rates increased an average of 10.5 percent. In the individual market, CareFirst proposed an average increase of 7.7 percent for HMO plans, and 15.6 percent for PPO plans. Kaiser proposed an average increase of 5.0 percent. For small group plans, CareFirst filed average rate increases of 13.5 percent for HMO plans and 18.5 percent for the PPO plans. Kaiser small group rates proposed an average increase of 3.0 percent. Aetna filed for an average increase of 16.1 percent for HMO plans and 5.0 percent for PPO plans. Finally, United proposed an average increase of 13.0 percent and 7.4 percent for its two HMOs and 11.2 percent for its PPO plans.
Cigna extended its individual healthcare exchange products for the 2020 plan year, the insurer said Sept. 18.
For 2020, individuals can purchase individual health plans in 19 markets across 10 states. The expansions will take place in counties in Kansas, South Florida, Utah, Tennessee and Virginia. The other states include Arizona, Colorado, Illinois and North Carolina.
The plans will be available for purchase on the individual marketplace during the 2020 open enrollment period, which begins Nov. 1. Plans will take effect Jan. 1.
Speaker Nancy Pelosi on Thursday released her long-awaited plan to curb soaring prices of prescription drugs, a political chess move that could prod the Senate to move and heat up congressional negotiations with the White House on a popular but elusive goal.
Ms. Pelosi’s plan, which she was to lay out at a morning news conference, would allow the government to negotiate the price of as many as 250 name-brand drugs for Medicare beneficiaries — an idea that many Republicans hate but that President Trump embraced during his 2016 campaign. Drug companies would also have to offer the agreed-on prices to private insurers or face harsh penalties, which could give the package broader appeal with voters.