30,000+ MARYLANDERS HAVE ENROLLED DURING THE CORONAVIRUS EMERGENCY SPECIAL ENROLLMENT PERIOD
Remaining uninsured residents have less than a month to get marketplace coverage
BALTIMORE, MD – The Maryland Health Benefit Exchange today reminded uninsured Marylanders that they have until June 15 to enroll in coverage through the state’s health insurance marketplace, Maryland Health Connection, under the Coronavirus Emergency Special Enrollment Period. As of May 15, nearly 31,000 residents across the state have taken advantage of this special enrollment period that began in March with Gov. Larry Hogan’s announcement of a State of Emergency in Maryland.
OLYMPIA, Wash. – Fifteen health insurers filed an average proposed rate decrease of 1.79% for the 2021 individual health insurance market. This includes two new insurers — UnitedHealthcare of Oregon and Community Health Network of Washington — that are joining Washington’s market.
With 15 insurers in next year’s individual market, all 39 counties will have at least two insurers selling plans inside the exchange, Washington Healthplanfinder. Ten insurers will sell plans outside of the exchange.
The proposed average rate decrease follows an average premium reduction of 3.25% for 2019 plans.
I've made major progress in updating and revising my breakout of COVID-19 cases and fatalities at not just the state level but the county level. Again, I've separates the states into two separate spreadsheets:
Most of the data comes from either the GitHub data repositories of either Johns Hopkins University or the New York Times. Some of the data comes directly from state health department websites.
I hope to fill in the back-data for every state within the next few days, bringing them all up to date. This should allow for plenty of interesting analysis of trends and counties to keep an eye on. It will also allow me to get back to posting more regular ACA policy updates/etc.
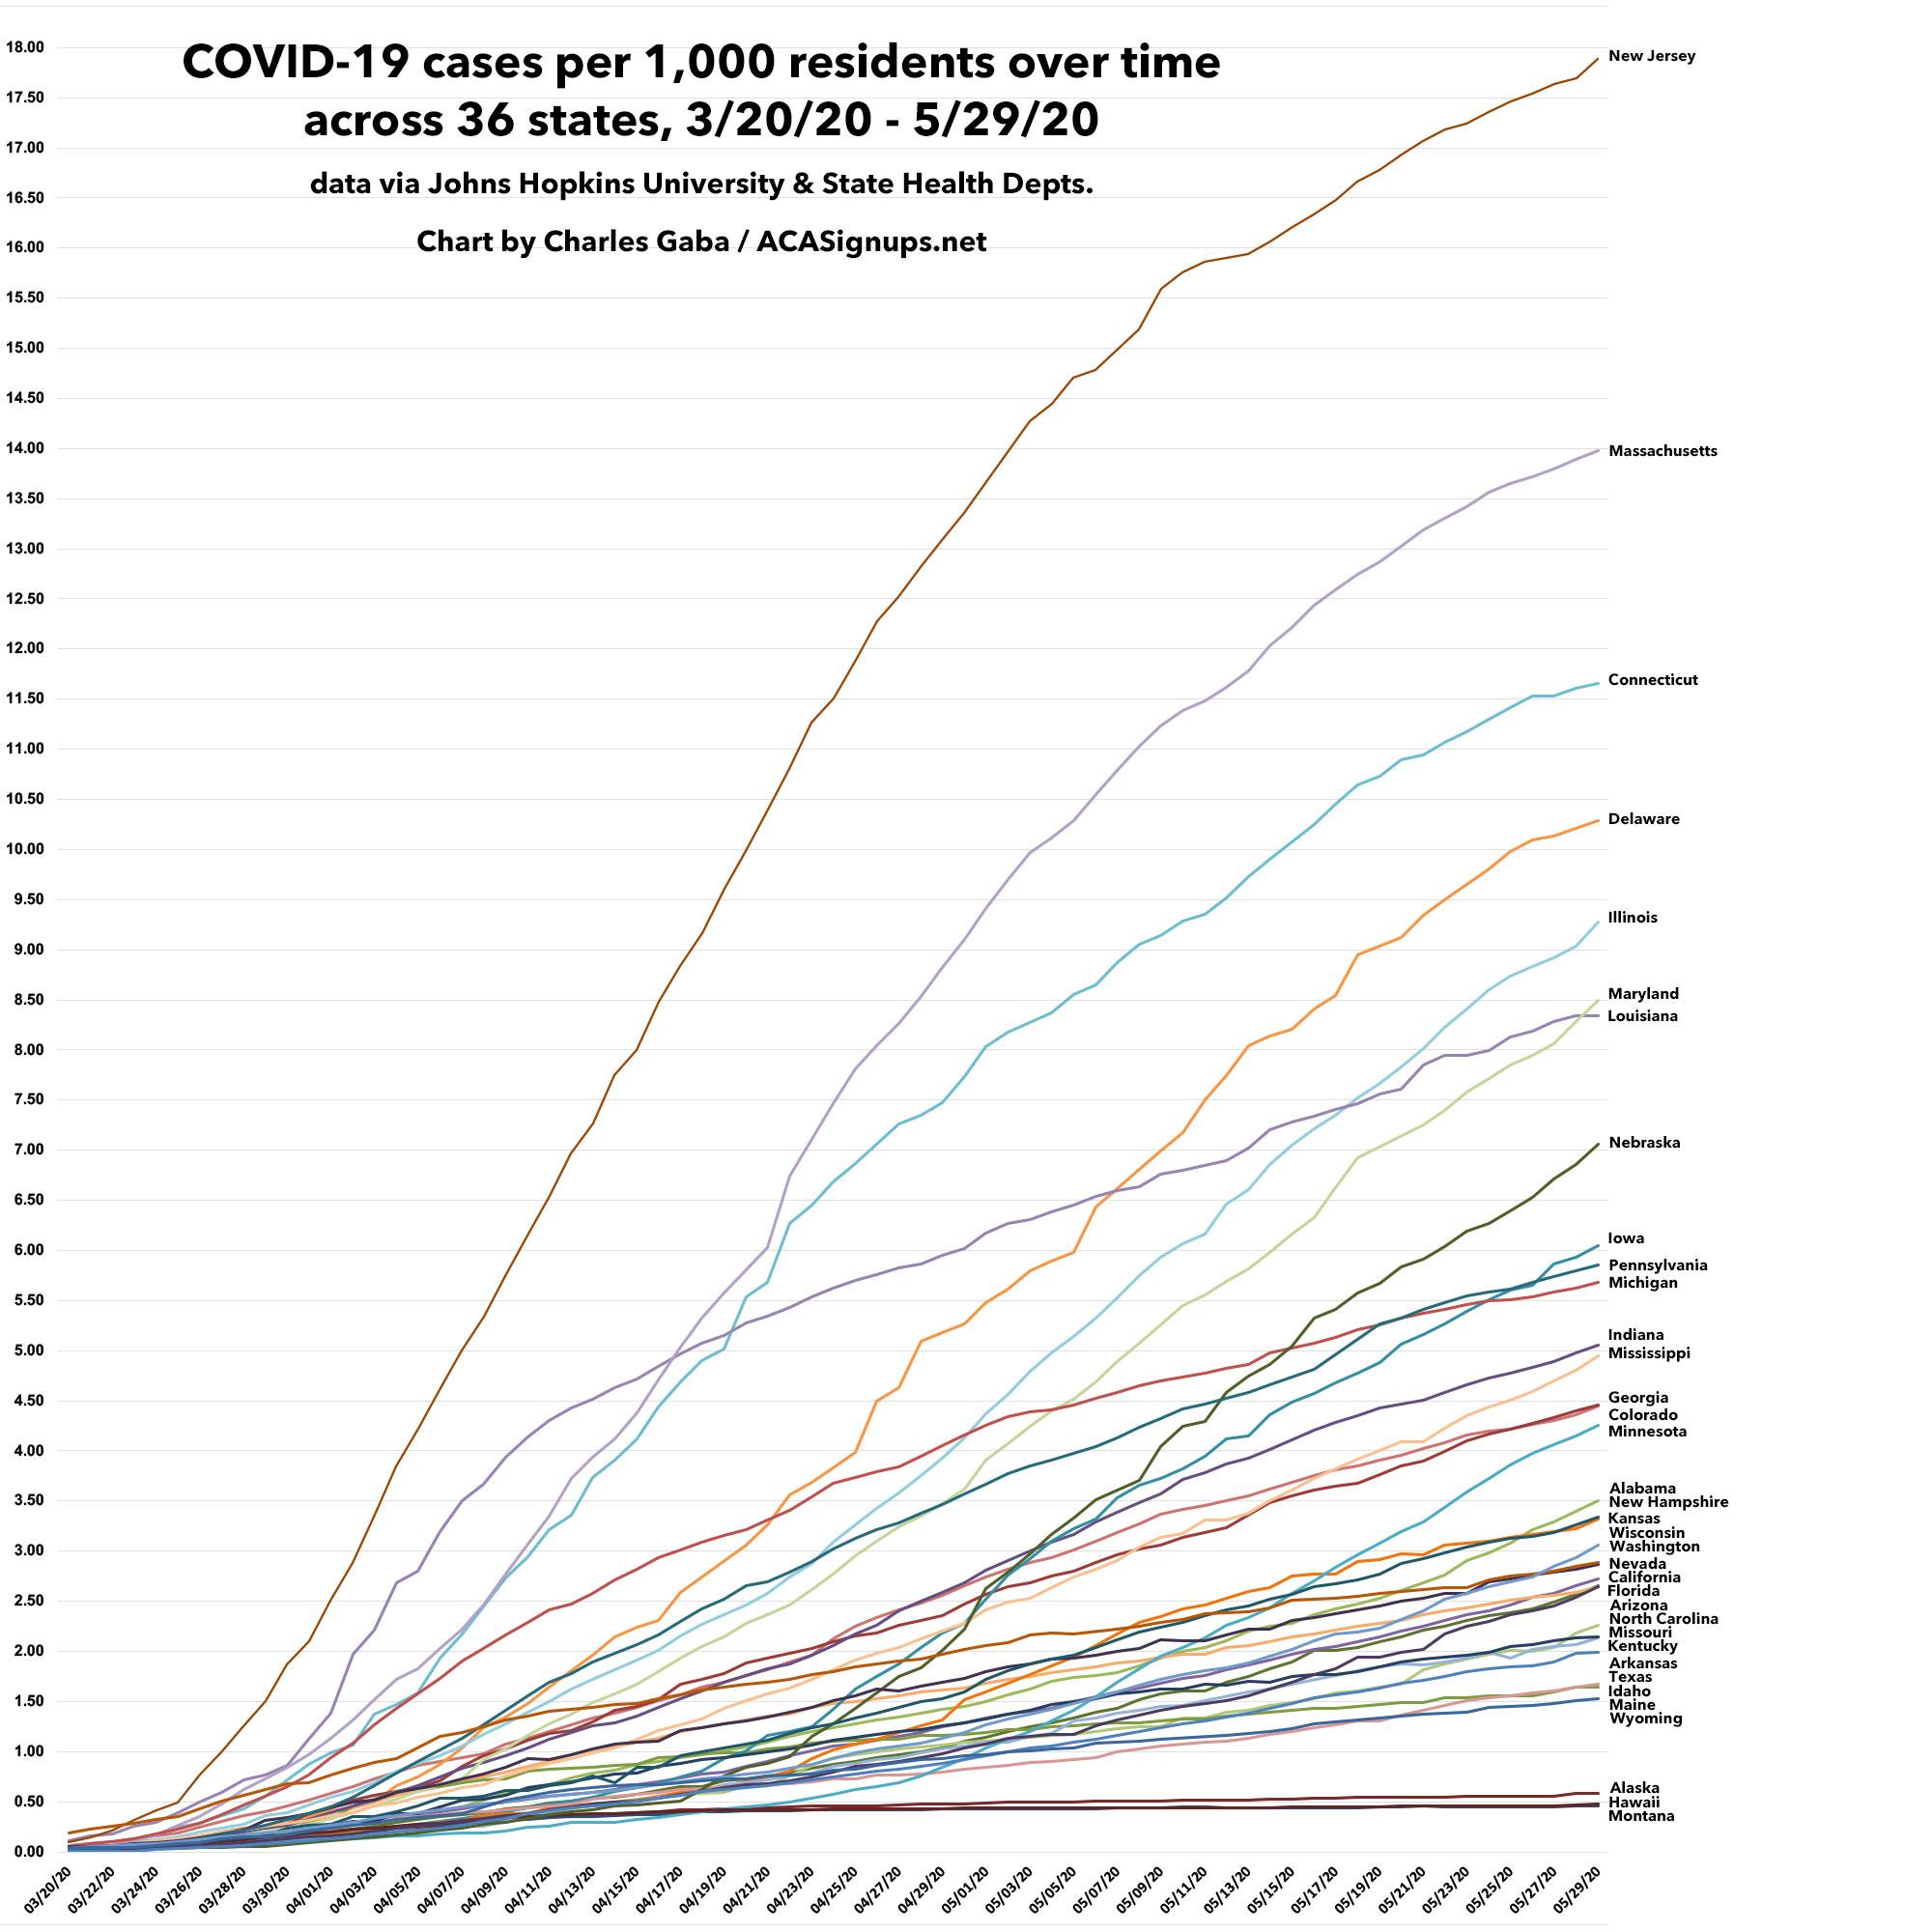
My county-level tracking project continues. I've now plugged in confirmed/official COVID-19 cases and fatalities across 36 states and hope to bring the remaining 14 states (plus the U.S. territories) up to date within the next few days.
Meanwhile, here's how cases have spread on a per capita basis across those 26 states from March 20th until May 29th. At the high end, I haven't gotten to two of the worst-hit states yet (New York & Rhode Island); at the lower end, there's a cluster of states which are difficult to separate out at this level as they're running so close together.
Just as important as the infection rate itself, of course, is the curve of the line. Louisiana and Michigan were hit hard early on, but seem to be flattening their curves, while states like Minnesota, Iowa, Mississippi and Alabama, which were hit later, are starting to curve upwards now, definitely the wrong direction.
Since I've been neglecting other ACA/healthcare posts the past couple of weeks, I figured I should at least provide regular updates on why I've been mostly absent.
I've made major progress in updating and revising my breakout of COVID-19 cases and fatalities at not just the state level but the county level. Again, I've separates the states into two separate spreadsheets:
This page contains proposed health plan rate information for the District of Columbia’s health insurance marketplace, DC Health Link, for plan year 2021.
The District of Columbia Department of Insurance, Securities and Banking (DISB) received 188 proposed health insurance plan rates for review from Aetna, CareFirst BlueCross BlueShield, Kaiser Permanente and United Healthcare in advance of open enrollment for plan year 2021 on DC Health Link, the District of Columbia’s health insurance marketplace.
The four insurance companies filed proposed rates for individuals, families and small businesses for the 2021 plan year. Overall, 188 plans were filed, compared to 181 last year. The number of small group plans increased from 156 to 163, and the number of individual plans remained at 25.
In the middle of a deadly global pandemic which has already killed more than 100,000 Americans and completely disrupted the entire U.S. healthcare system, private insurance carriers still have to go about preparing their annual premium rate change filings for 2021. This is a long, complicated process which begins a good nine months before the new plans and prices are actually enrolled in.
The task of setting 2020 premiums was the first time since the ACA went into effect which was relatively calm for insurance carrier actuaries:
My county-level tracking project continues. I've now plugged in confirmed/official COVID-19 cases and fatalities across 26 states and hope to bring the remaining 24 states (plus the U.S. territories) up to date within the next few days.
Meanwhile, here's how cases have spread on a per capita basis across those 26 states from March 20th until May 23rd. At the high end, I haven't gotten to the worst-hit states yet (New York, New Jersey, Massachusetts & Rhode Island), which wouldn't fit on this chart anyway; at the lower end, once you get below Alabama, there's a cluster of states which are difficult to separate out at this level as they're running so close together.
Just as important as the infection rate itself, of course, is the curve of the line. Louisiana and Michigan were hit hard early on, but seem to be flattening their curves, while states like Minnesota, Iowa and Alabama, which were hit later, are starting to curve upwards now, definitely the wrong direction.
I've made major progress in updating and revising my breakout of COVID-19 cases and fatalities at not just the state level but the county level. Again, I've separates the states into two separate spreadsheets:
Most of the data comes from either the GitHub data repositories of either Johns Hopkins University or the New York Times. Some of the data comes directly from state health department websites.
I hope to fill in the back-data for every state within the next few days, bringing them all up to date. This should allow for plenty of interesting analysis of trends and counties to keep an eye on. It will also allow me to get back to posting more regular ACA policy updates/etc.