

Every Official COVID-19 Case per 1,000 Residents Over Time, All 50 States + DC & PR
Thu, 06/04/2020 - 5:27pm
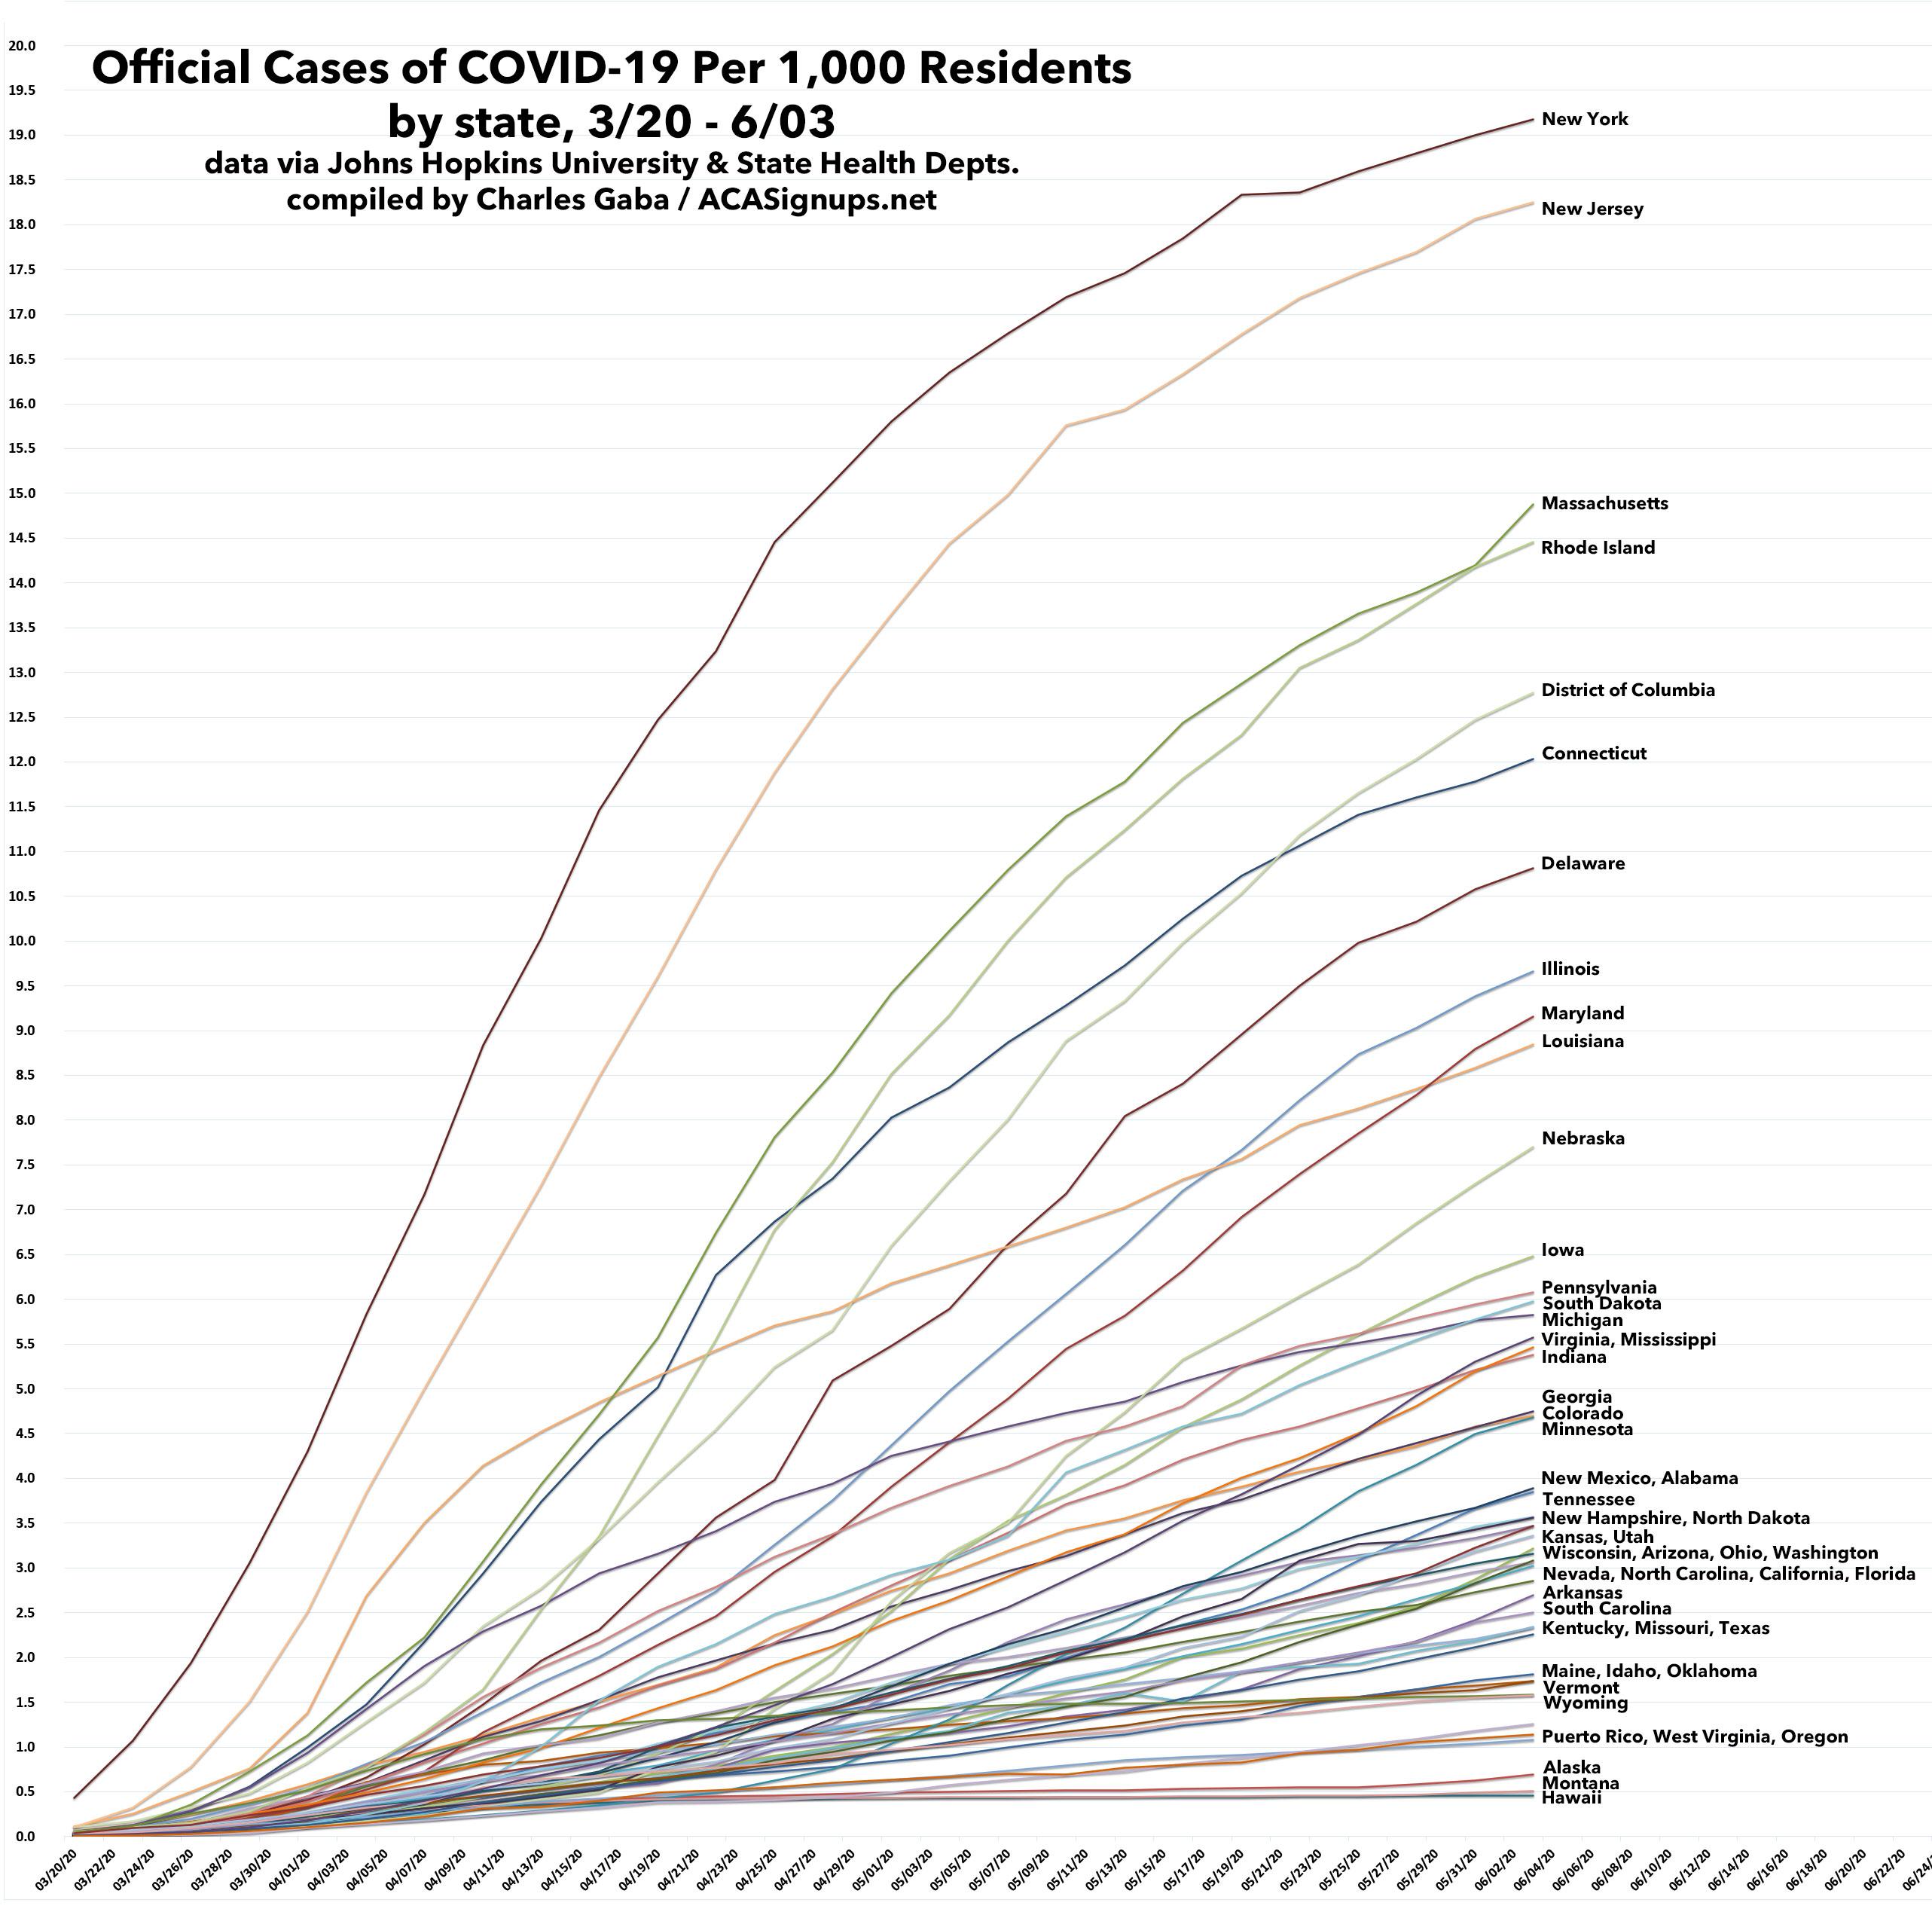
At long last, after many hours of data entry, here it is: The spread of COVID-19 across all 50 states over time, from March 20th through June 3rd, 2020, in official cases per capita.
I decided to only use every 3rd day (3/20, 3/23, 3/26, etc) in order to avoid as many one-day data reporting issues as possible (i.e., there were some cases where a state didn't update their numbers for 2 days in a row). I also gave up trying to tie every trend line to the state name; it simply gets too crowded near the bottom even with a small font size, so I've grouped some of them together where necessary.
I still hope to add the District of Columbia and U.S. territories (Guam, Puerto Rico, etc) but otherwise I should have everything fully up to date now, and should only have to plug in one day at a time going forward. I'll update this chart once a week if possible.
UPDATE 6/05: I've gone ahead and added both the District of Columbia and Puerto Rico. I'm debating whether to add Guam, the Northern Mariana Islands and the U.S. Virgin Islands, which have a collective population of just 326,000 people and only 276 cases among them. I'm definitely not bothering with American Samoa as they've reported zero cases to date.
Note that this graph doesn't take into account any of the rumored undercounts in Florida, Georgia etc...these are based on the official reports from the various state health departments. If and when those are ever modified retroactively I'll update the data accordingly.
Click the image itself for a high-resolution version.
Advertisement
