

ALL-NEW: How many would lose coverage under Trumpcare in YOUR State/Congressional District??
Thu, 05/25/2017 - 7:56pm
IMPORTANT: ALL ESTIMATES BELOW are based on the CBO score of the HOUSE GOP version of the Trumpcare bill (AHCA).
Here's the updated link to the state/district breakout of the SENATE GOP version of Trumpcare (BCRAP) as of 6/27/17.
ALL 435 CONGRESSIONAL DISTRICTS NOW INCLUDED (broken out by state)
As regular readers know, earlier in the year I embarked on a project to break out the total number of people who would likely lose their healthcare coverage if & when the ACA were to be fully repealed without any replacement whatsoever (i.e., a "clean repeal"). When the dust settled, I estimated the grand total would come in at around 24 million people. I broke this out by state and even attempted to do so by both County and individual Congressional District. Since the GOP hadn't actually come up with any sort of a replacement plan for the ACA, I could only assume that they had a "clean repeal" in mind and work it from that angle.
Shortly after that, the GOP finally slapped together the "American Health Care Act" or AHCA (aka Trumpcare), an utterly nonsensical piece of half-baked garbage which kind of, sort of looked like the ACA but all backwards and inside out, satisfying no one. The Congressional Budget Office score of the impact this monstrosity would have concluded that in the end...24 million people would lose coverage. Yes, that's right: The CBO projected that exactly the same number of people would ultimately lose coverage if the ACA was replaced with Trumpcare as if they simply repealed the law and did nothing else (which is rather astonishing if you think about it). The breakout of the different categories of people who would be given the boot was different, but the grand total came out exactly the same.
The Center for American Progress took the CBO's estimates and made their own analysis of just how those numbers would break out by state and Congressional District. I decided to line up their numbers against my own "clean repeal" estimates to see how they compared, and a whole mess of people have been using both sets of data to spread the word about the impact Trumpcare would likely have if it actually becomes law.
The first version of the AHCA was never even voted on, but they went back, made a bunch of oddball changes (including throwing an extra $138 billion into the mix while allowing states to waive critical pre-existing condition protections if they wanted to), and 3 weeks ago the GOP went ahead and voted on that version of the bill after all, squeaking it through by just 2 votes. Oh, yeah...and they did this without bothering to wait for the CBO to actually score the revised version.
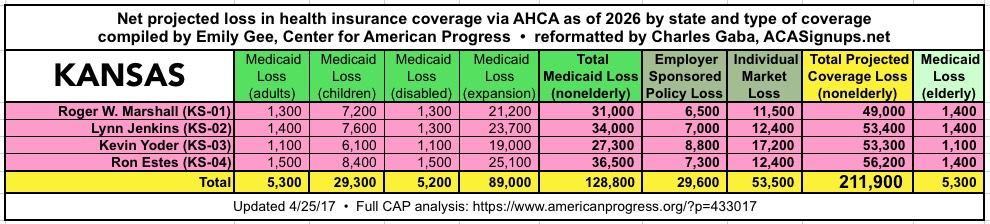
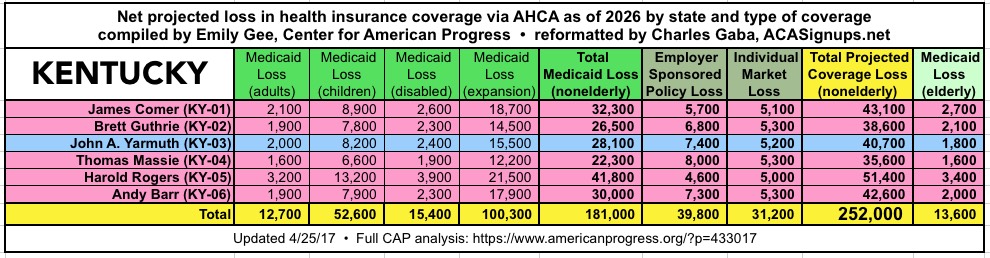
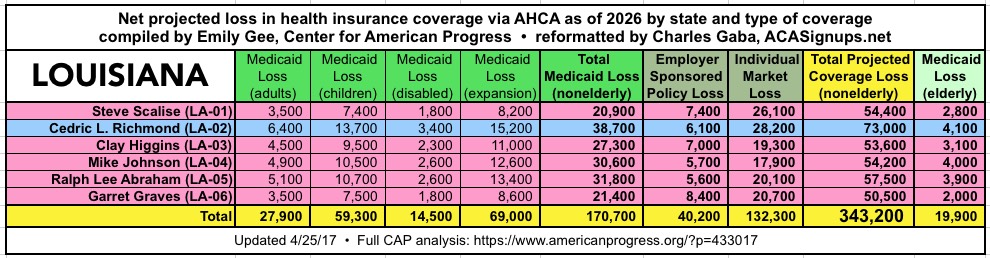
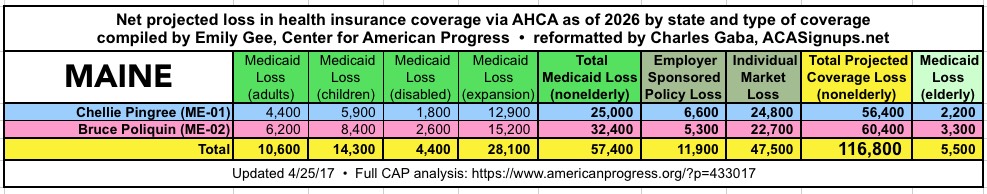
Well, yesterday the CBO released their score of the Trumpcare bill which passed, and lo and behold, after all that tweaking and mucking about with it, they concluded that by if the AHCA is signed into law, by 2026 there would be a net increase of 23 million people losing healthcare coverage. Yup, all that and the bill would still screw 96% as many people as the prior version would have.
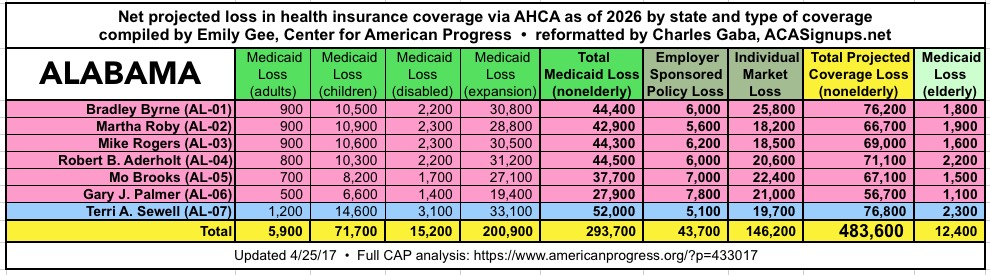
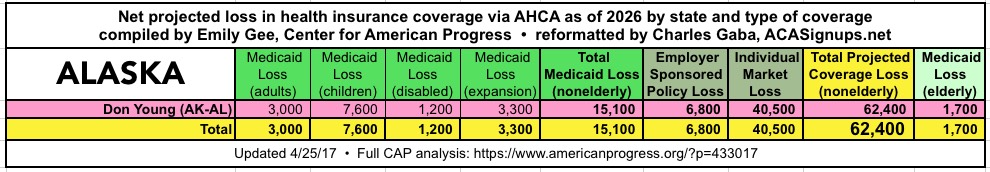
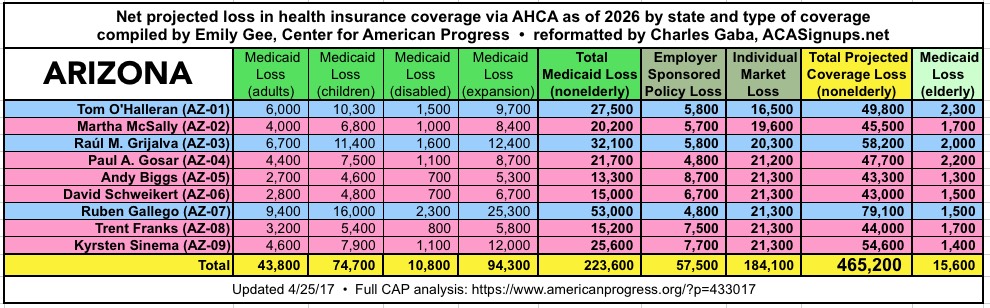
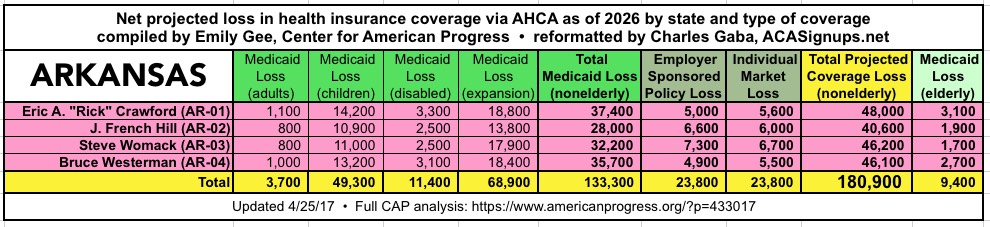
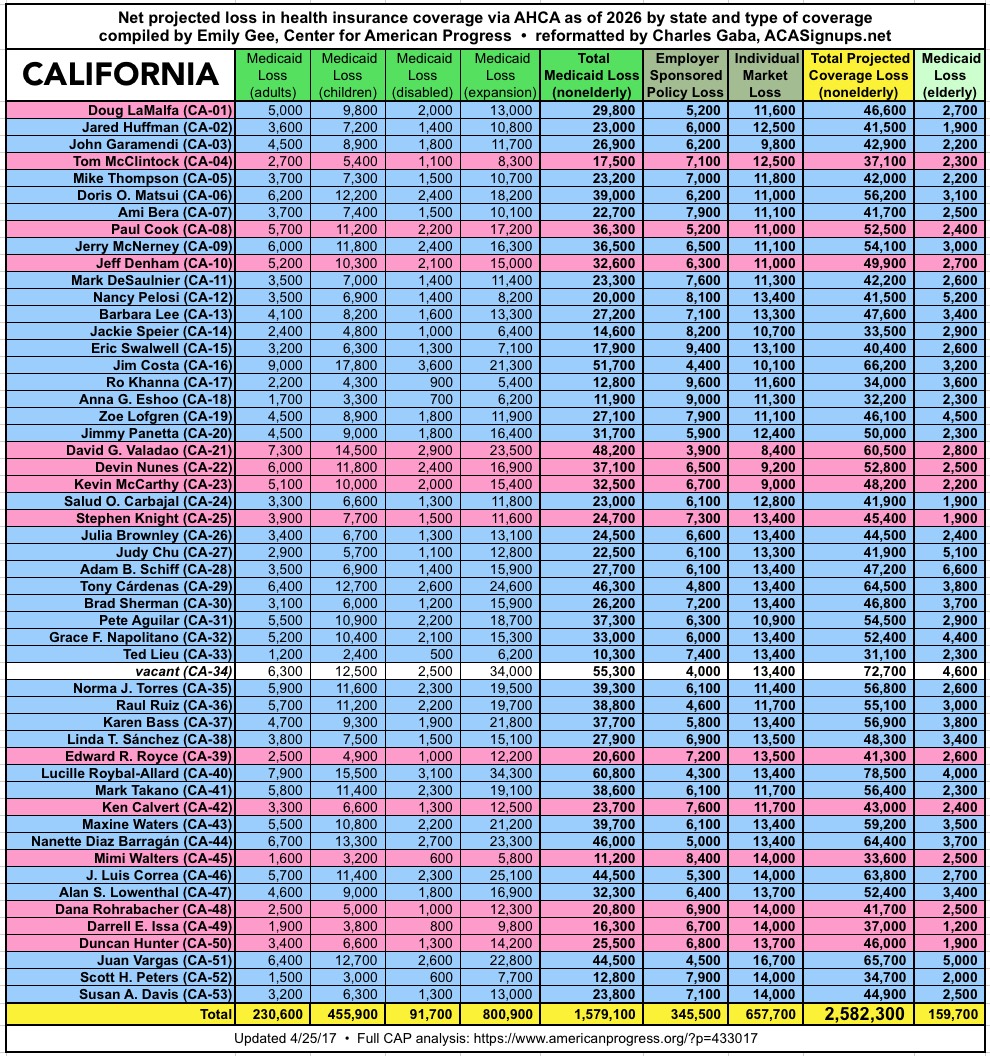
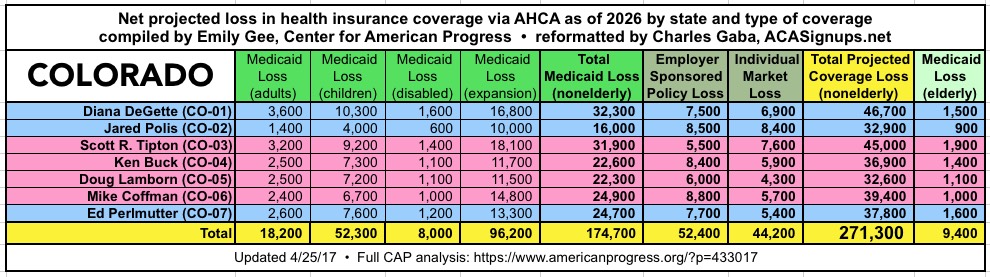
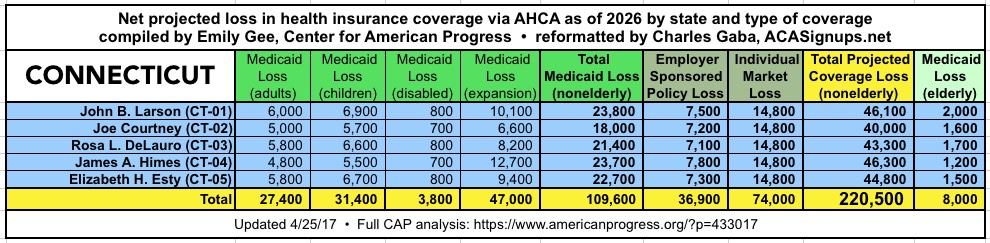
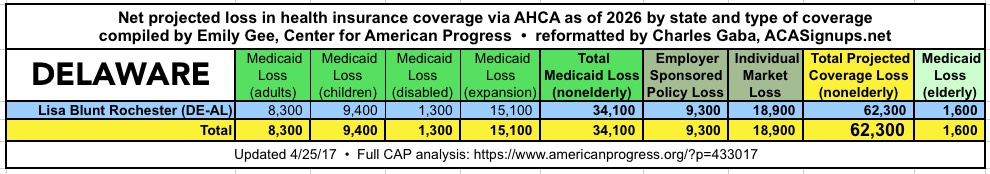
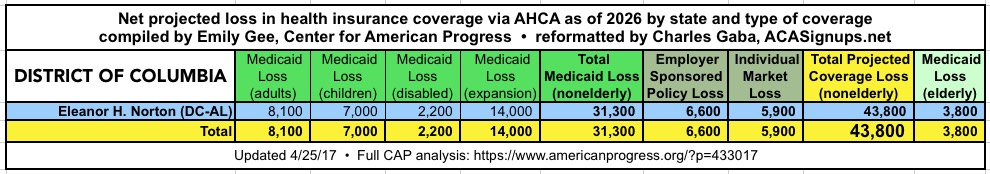
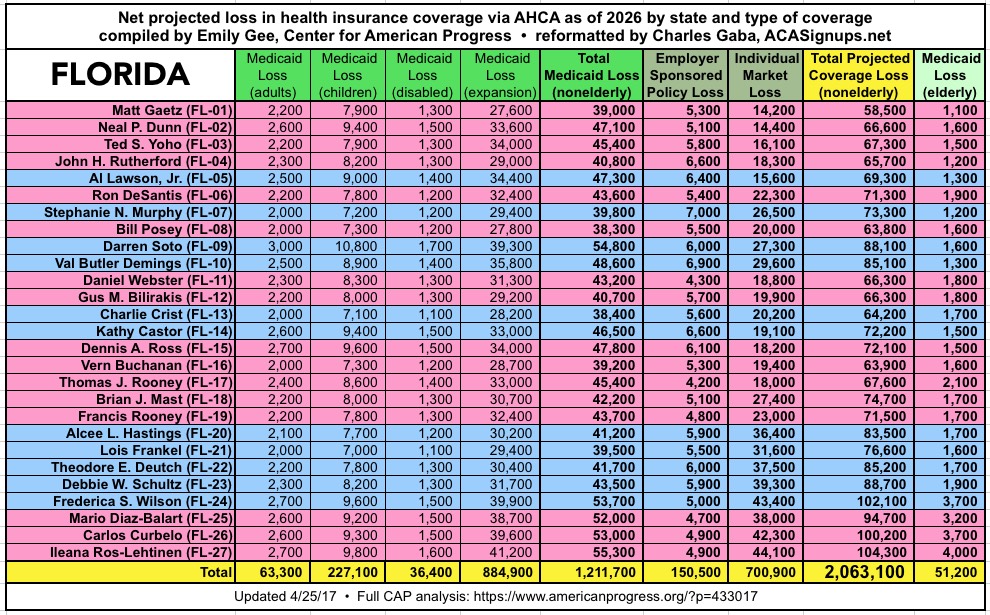
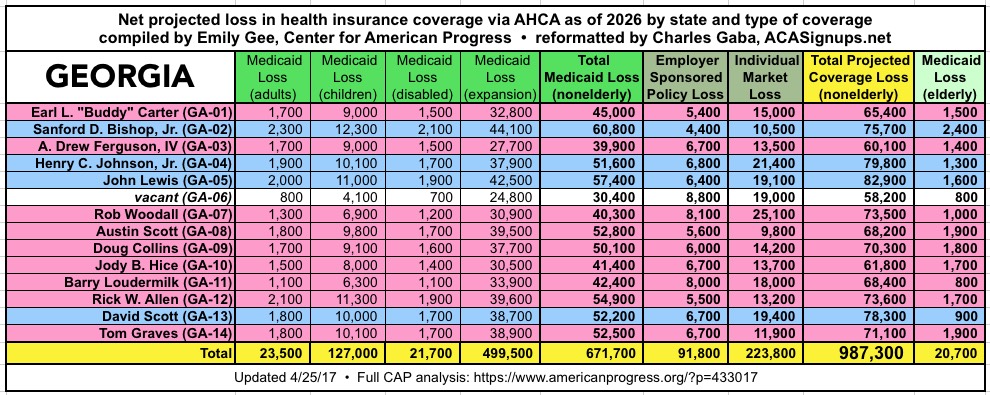
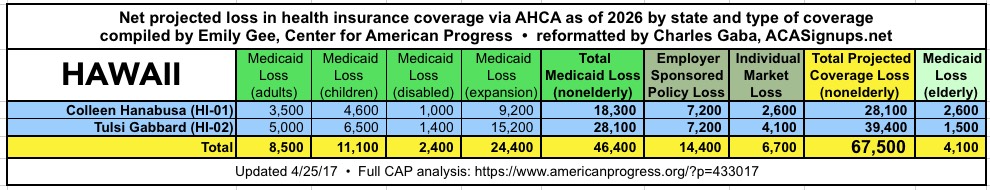
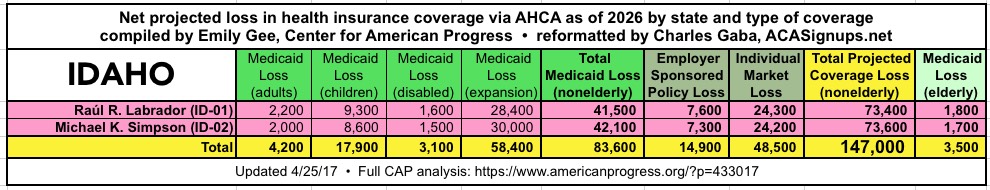
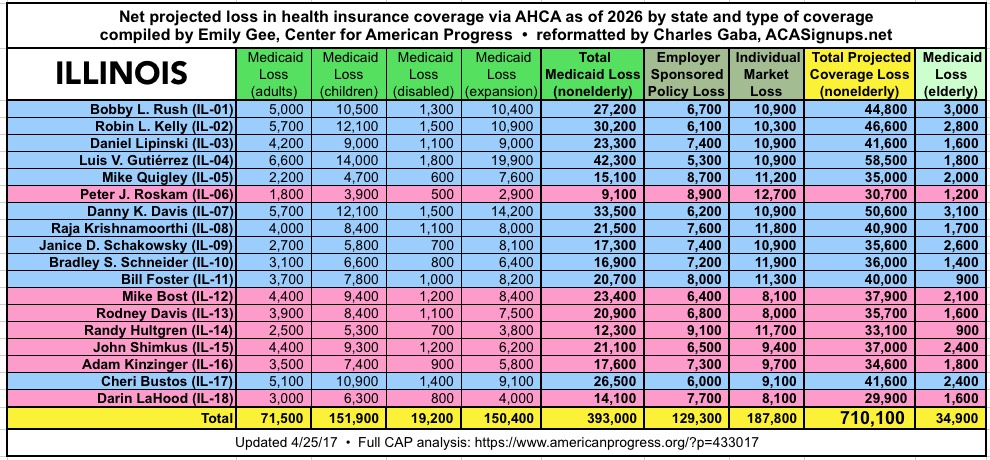
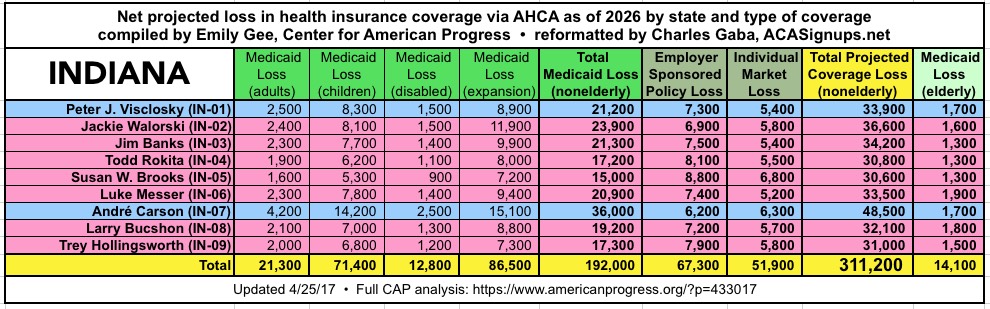
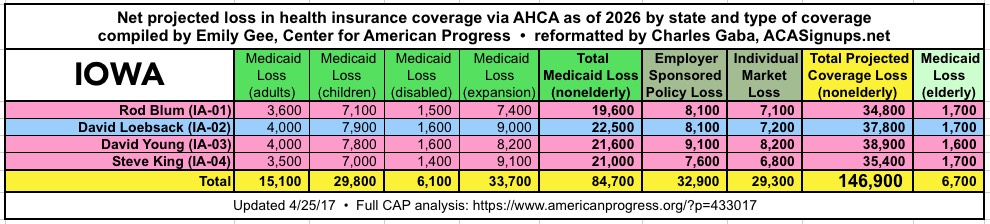
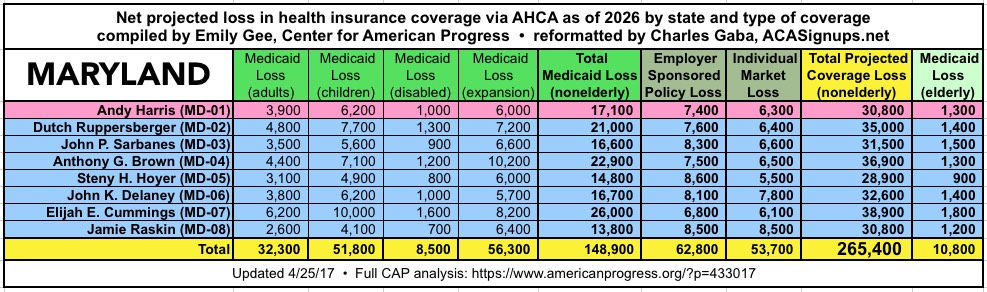
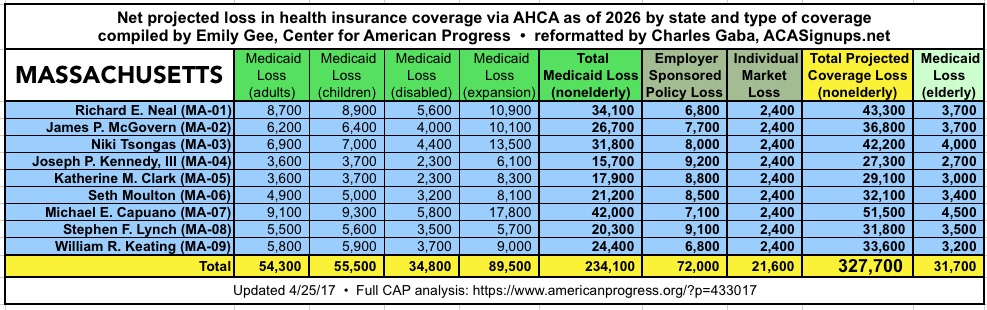
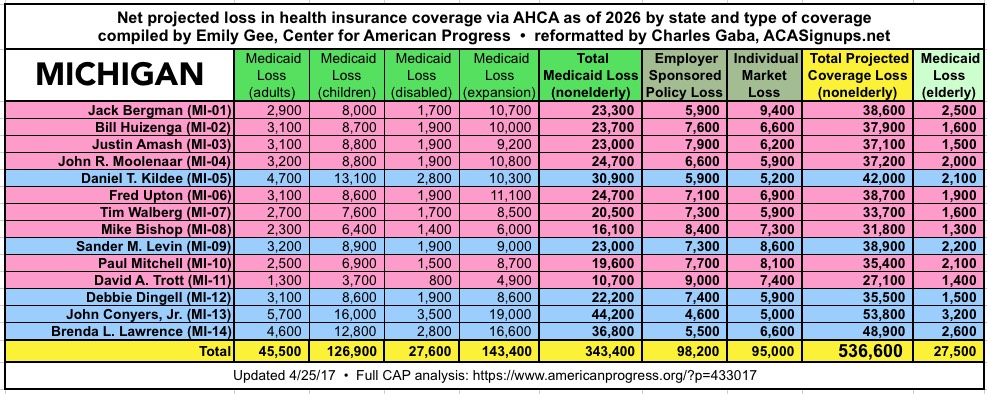
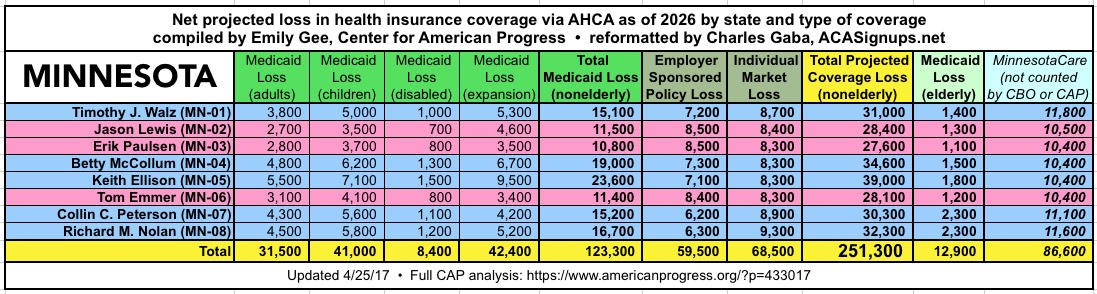
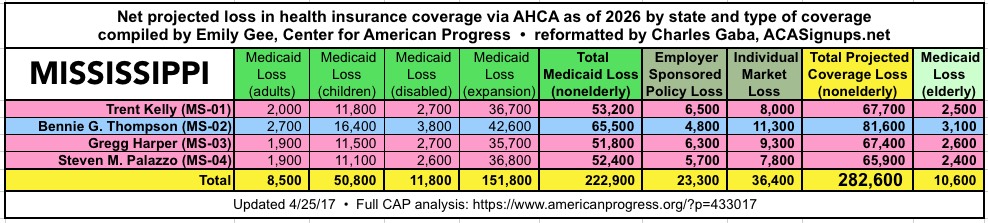
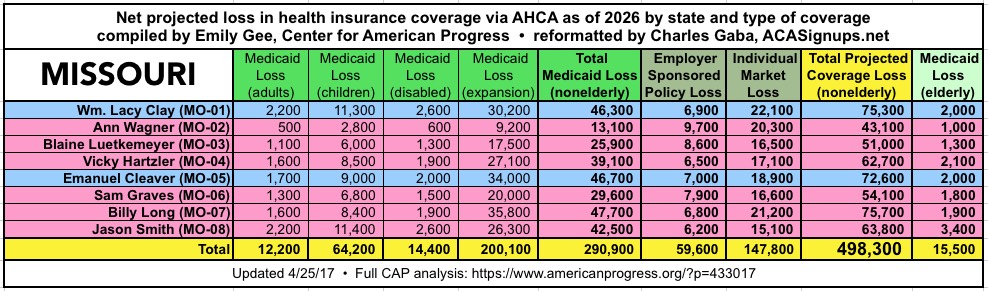
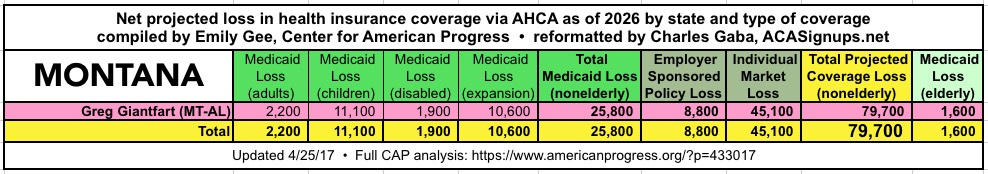
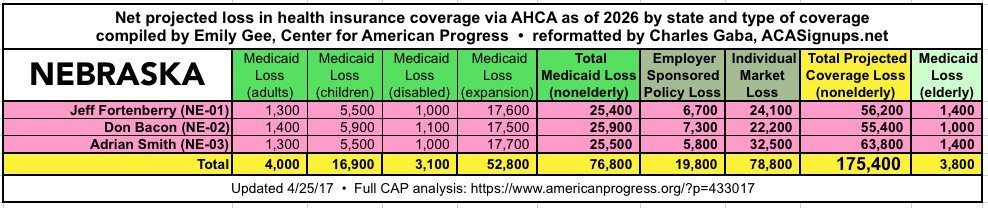
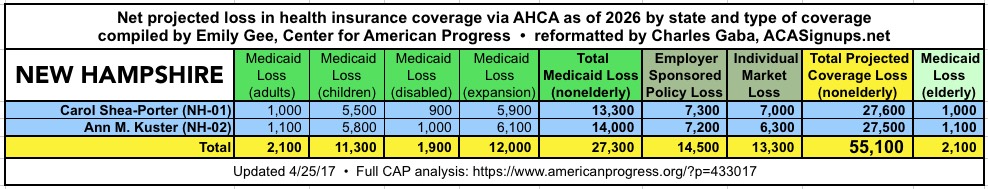
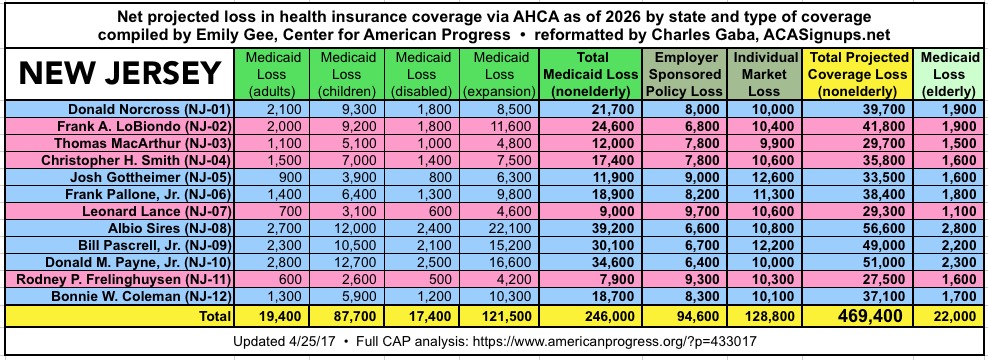
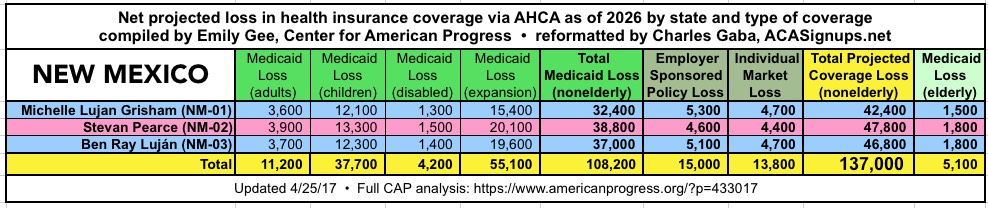
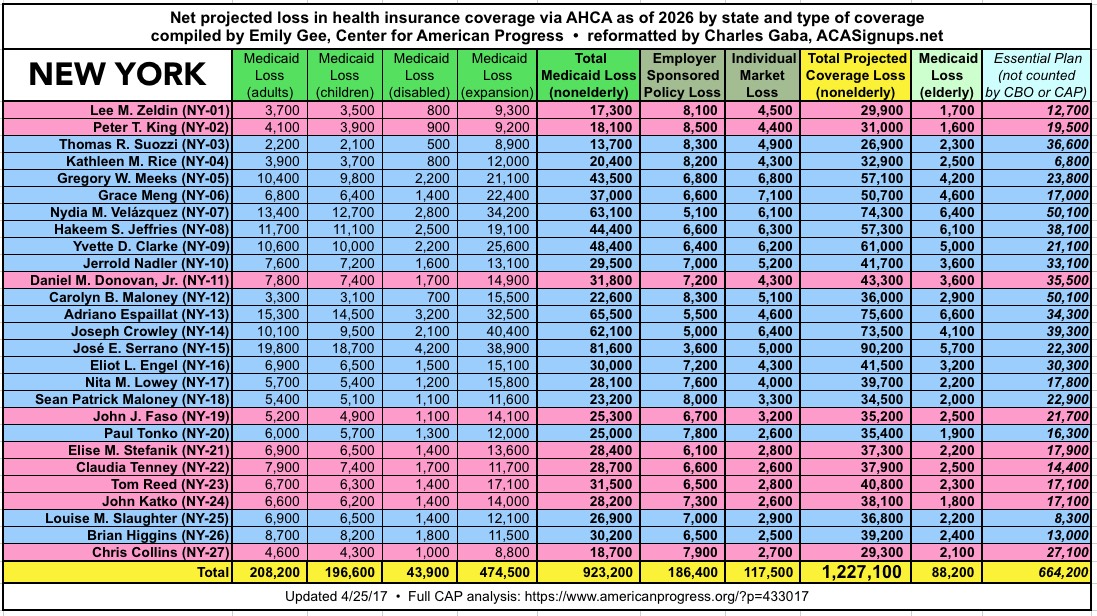
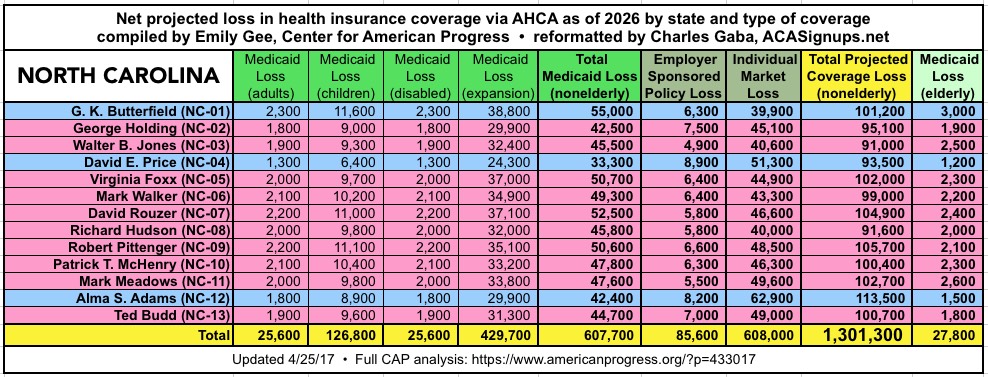
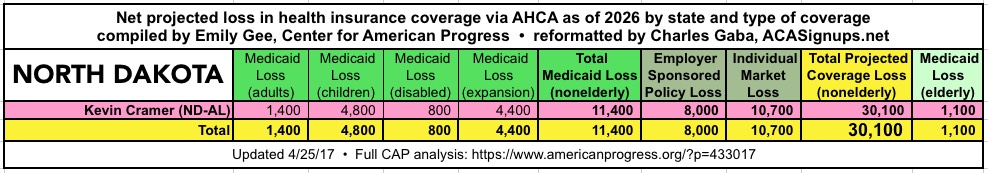
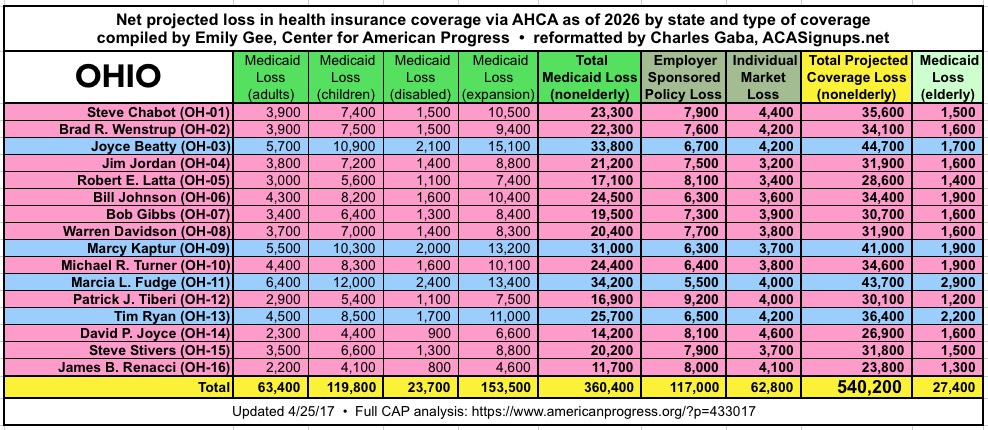
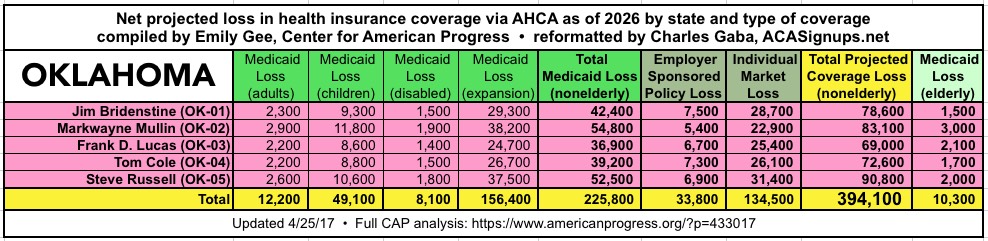
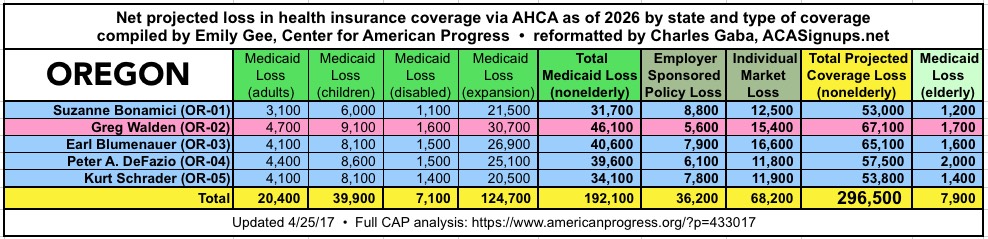
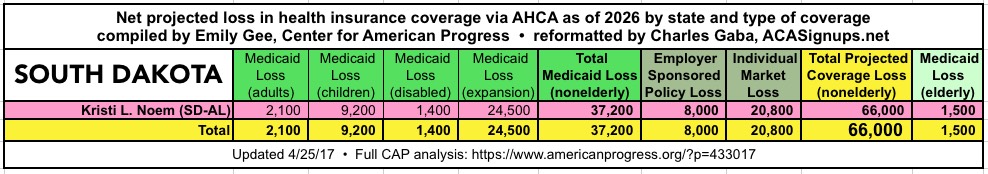
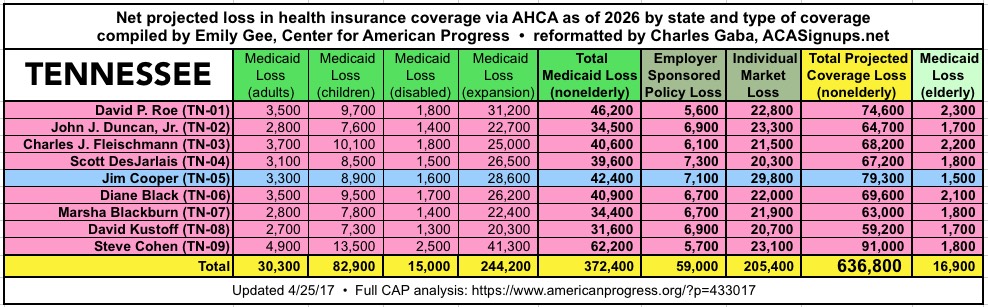
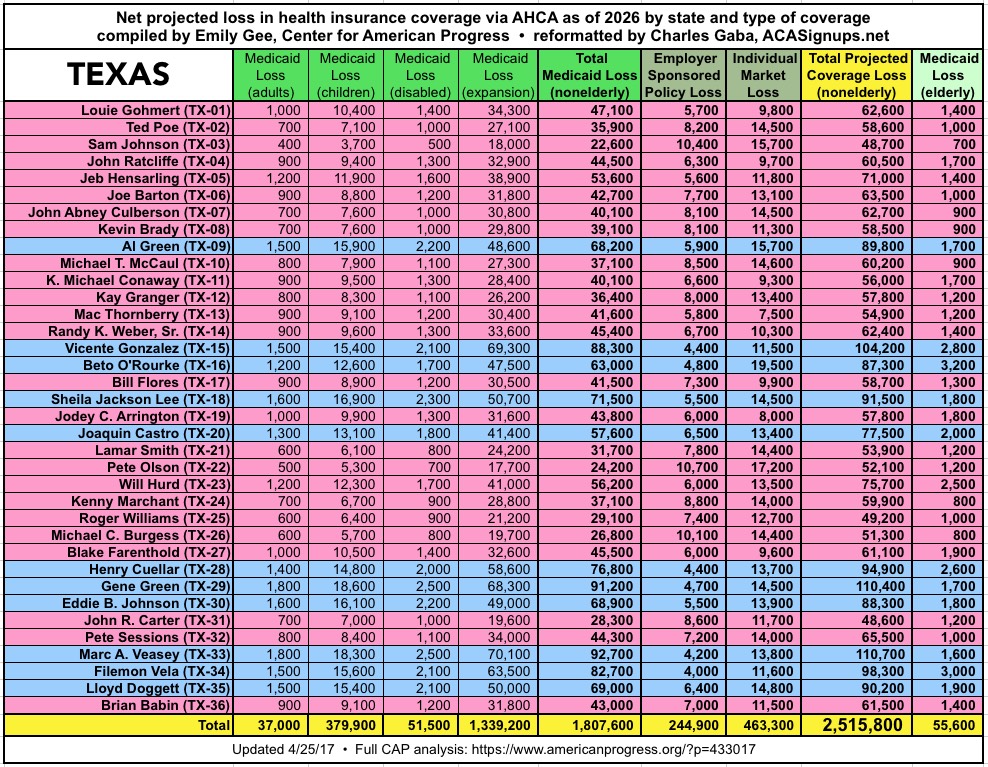
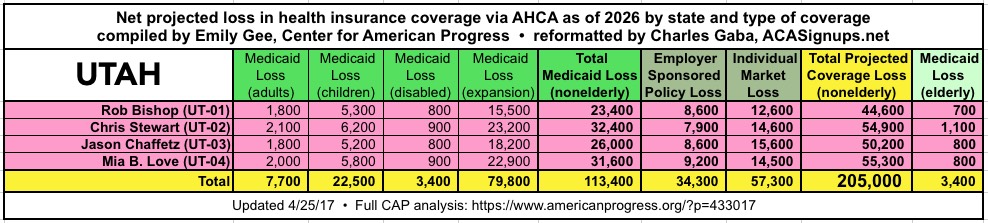
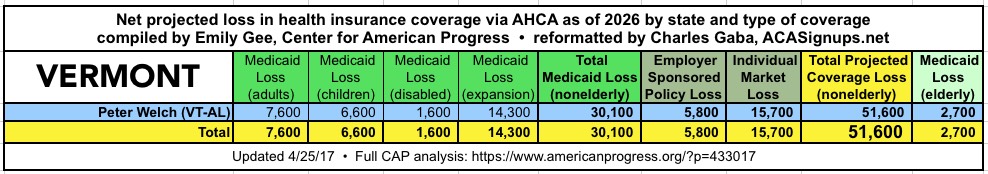
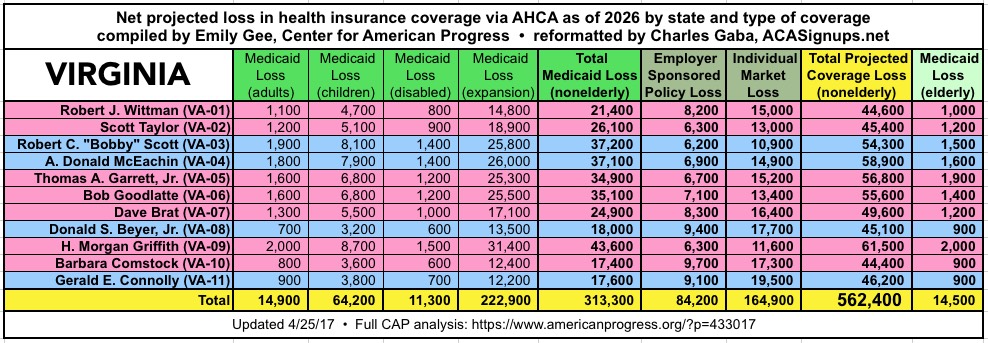
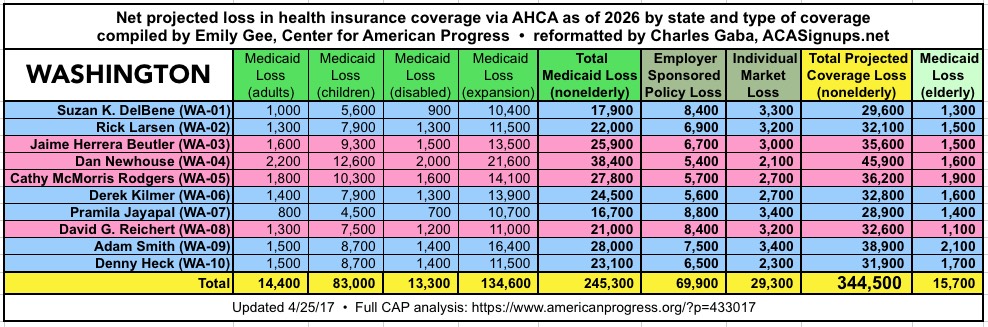
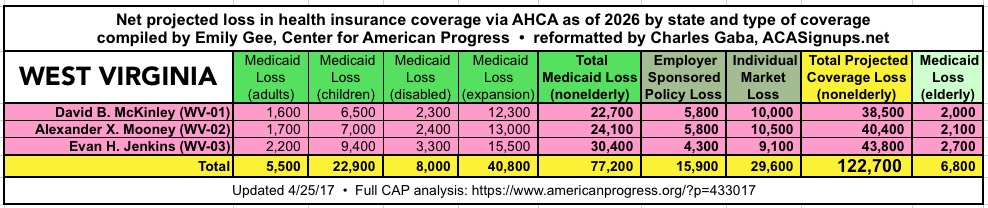
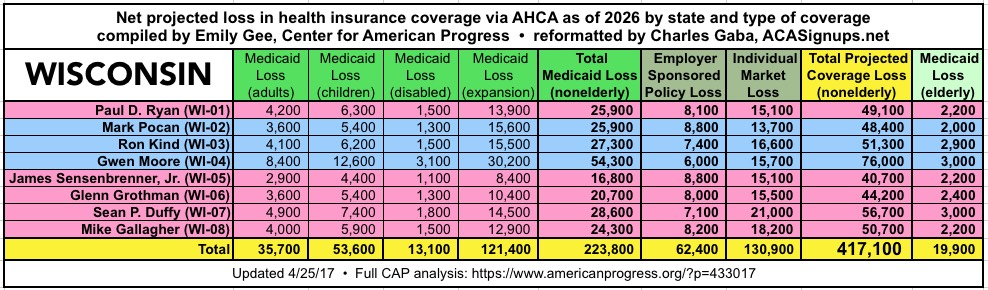
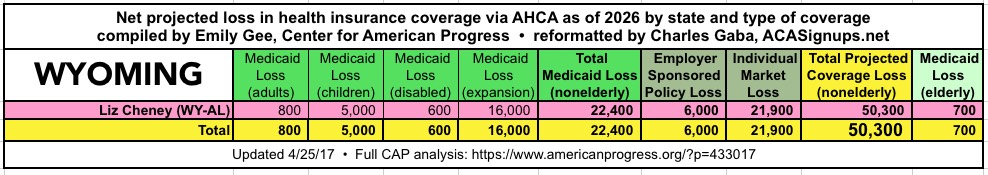
In light of the revised CBO score, this morning, Emily Gee of the Center for American Progress went back to the drawing board and recrunched the numbers for CAP's state and Congressional District breakout. I've once again taken her work and have recompiled it into a more colorful, easier-to-share format. I'm starting out with the state-level table, since that's much easier to reformat; I'll be adding the individual CDs soon.
One important thing I should note: Neither the CBO nor CAP included the roughly 750,000 people enrolled in the Basic Health Programs in New York and Minnesota in their projections, even though both of those would be completely defunded by the AHCA. I'm not sure why the CBO didn't include BHP enrollees...they effectively treat it as a rounding error, even though the numbers are closer to 1 million than half a million (CBO generally rounds everything off to the nearest million). In any event, you might want to tack an extra 86,000 people in Minnesota and 664,000 in New York onto these numbers. I've added separate columns for BHP enrollees to the individual state tables for MN/NY.
Again, all credit for this goes to CAP and Ms. Gee; all I did was make it more colorful and add the U.S. Senators for each state to the table. Click below for a high-resolution version:


Advertisement
