

How Many Would Lose Coverage: "Clean Repeal" vs Trumpcare: ALL 435 DISTRICTS
Mon, 03/20/2017 - 6:09pm
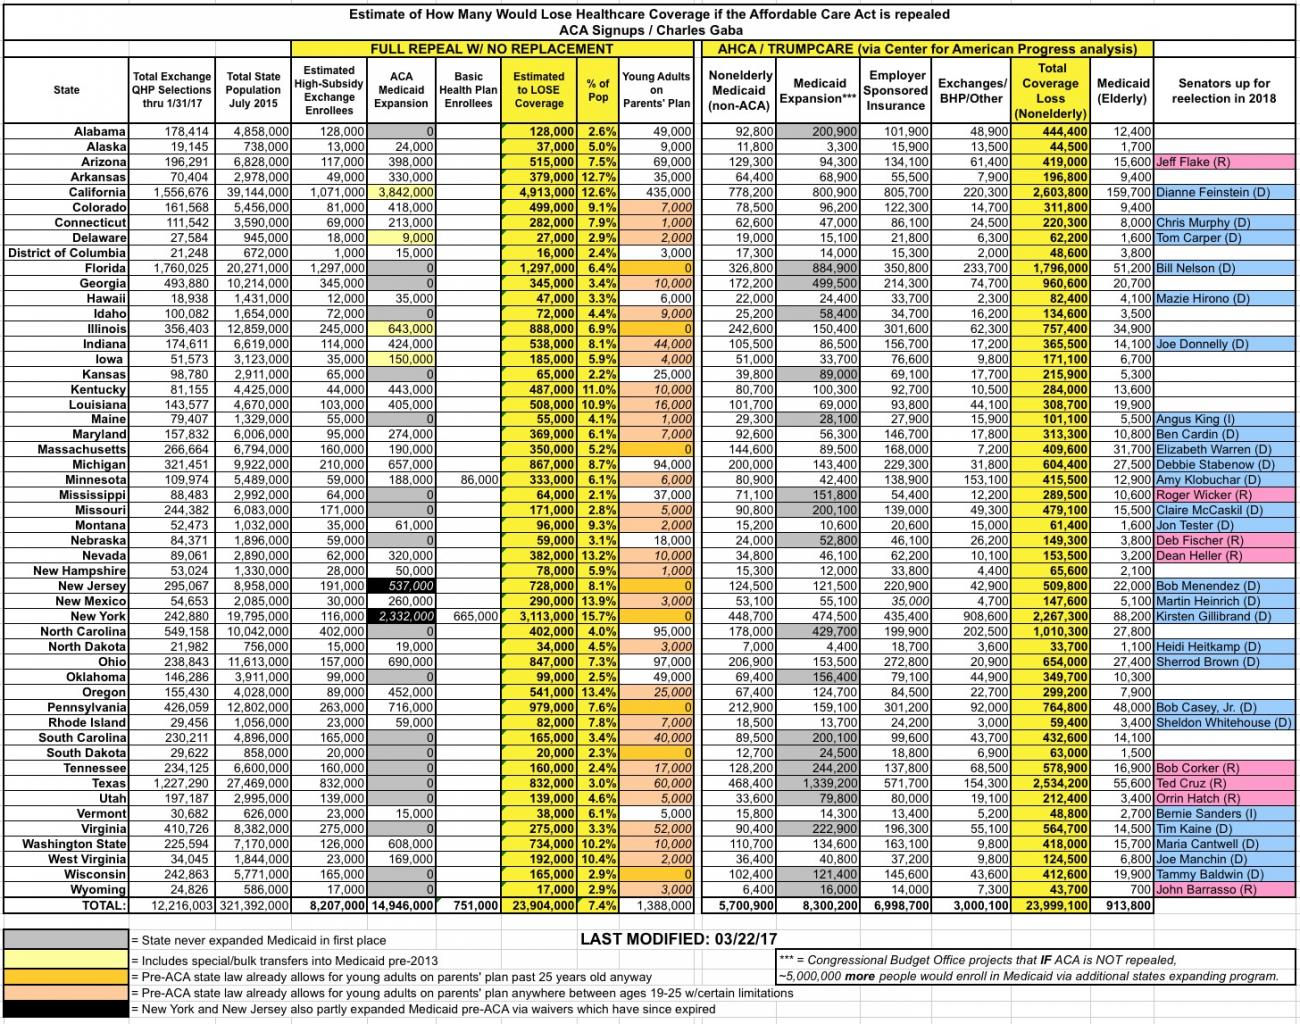
UPDATE: If you scroll all the way to the bottom, I've added a completely updated state/national-level table as well, reflecting both the "clean repeal" and Trumpcare scenarios.
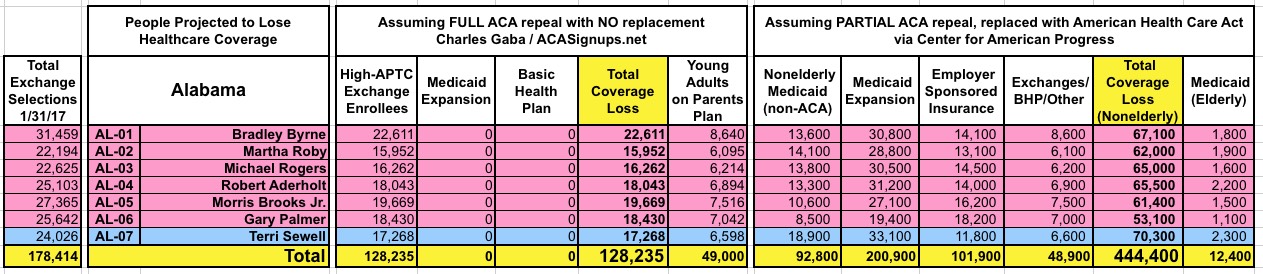
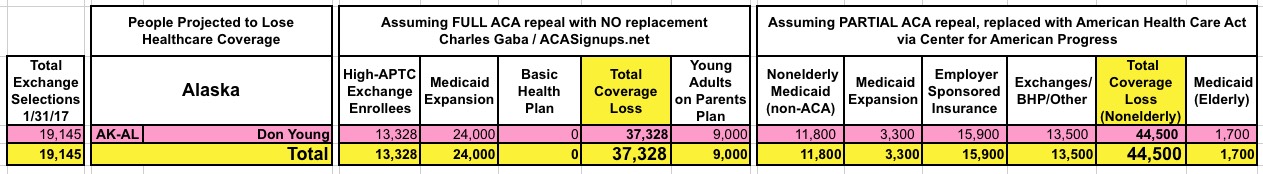
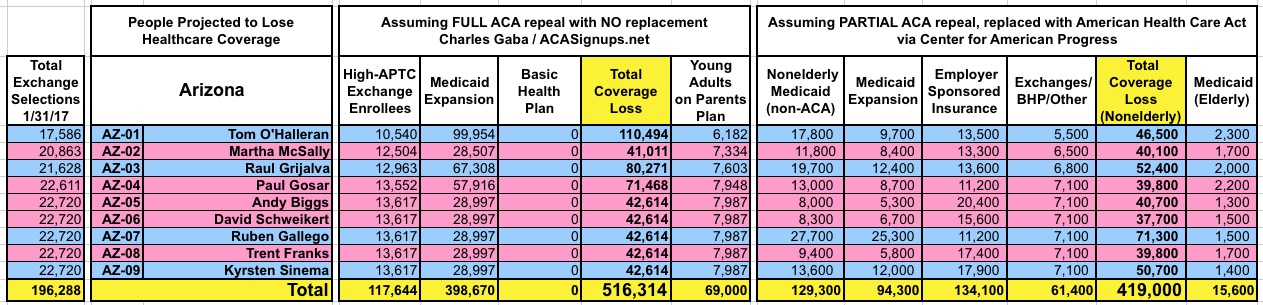
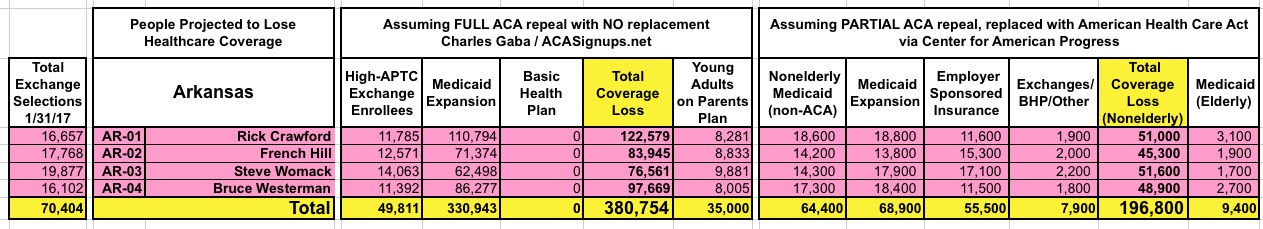
As I noted a few days ago, the Center for American Progress has outdone me. I crunched the numbers and broke out roughly how many people would lose healthcare coverage assuming the Affordable Care Act were to be fully repealed, with immediate effect and no replacement healthcare legislation whatsoever--that is, kicking nearly 15 million Medicaid expansion enrollees, over 750,000 Basic Health Plan enrollees and roughly 8.2 million significantly-subsidized individual market exchange enrollees off of their policies all in one shot. Add it all up and it comes to roughly 24 million people nationally.
The Center for American Progress, however, has done a far more-detailed analysis of the impact they expect from the American Health Care Act (aka Trumpcare) specifically, assuming it were to be signed into law and go into effect. Amazingly, the grand total number of Americans expected to lose healthcare coverage still ends up being around 24 million in the end...it's just sliced up differently and spread out over a 9-year period instead of happening all at once (although more than half of the total...roughly 14 million...would be kicked off effective January 2018).
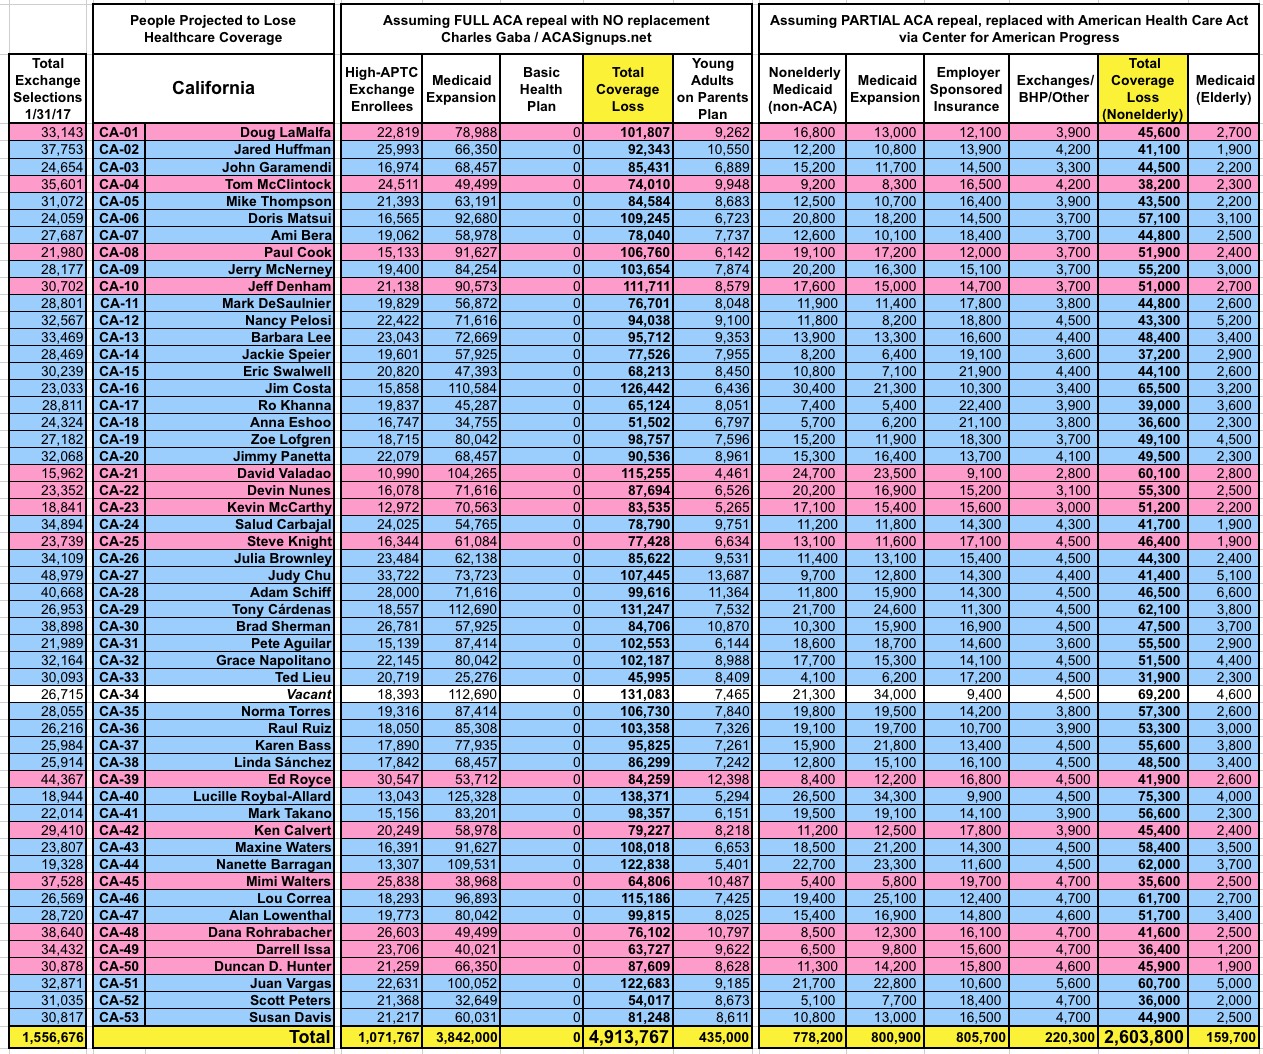
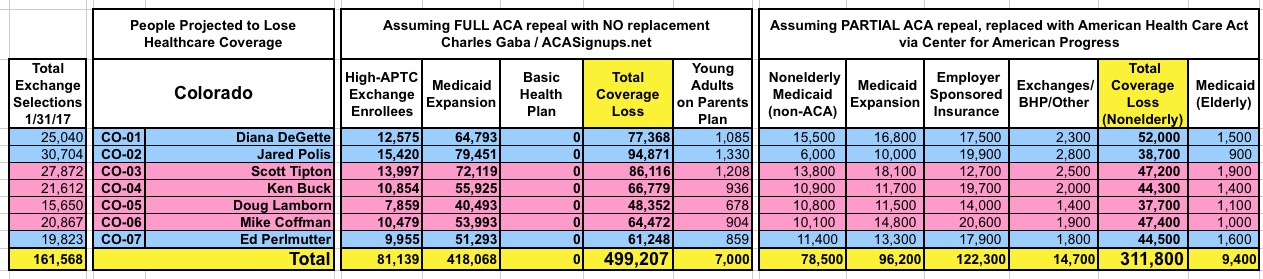
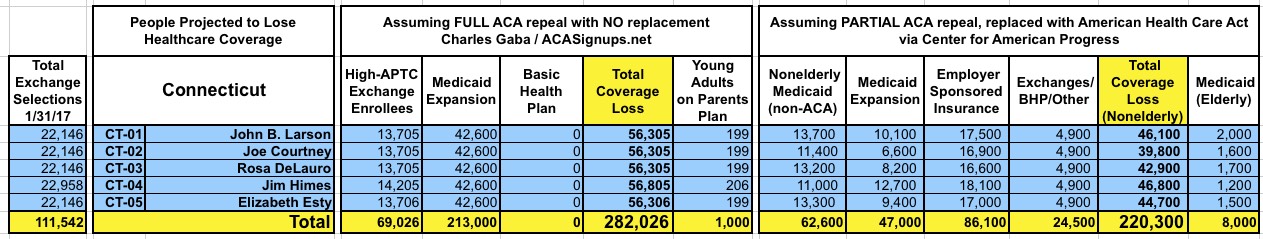
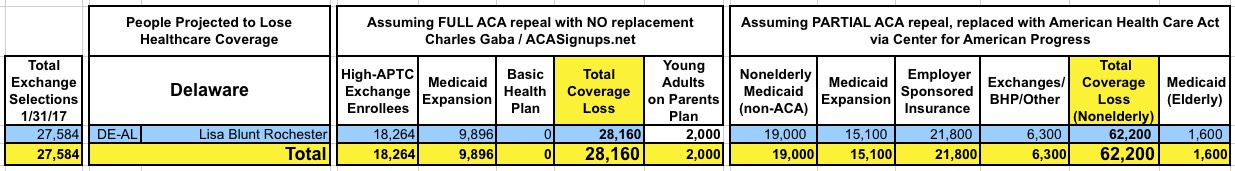
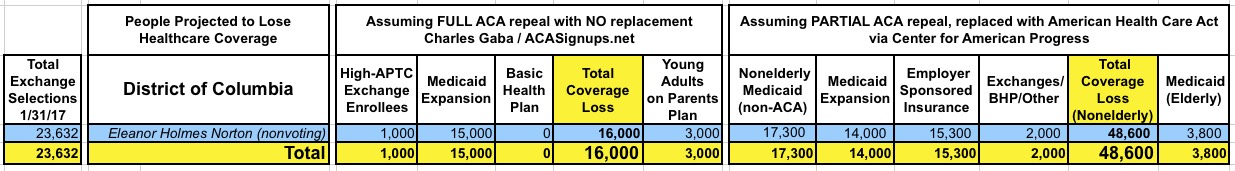
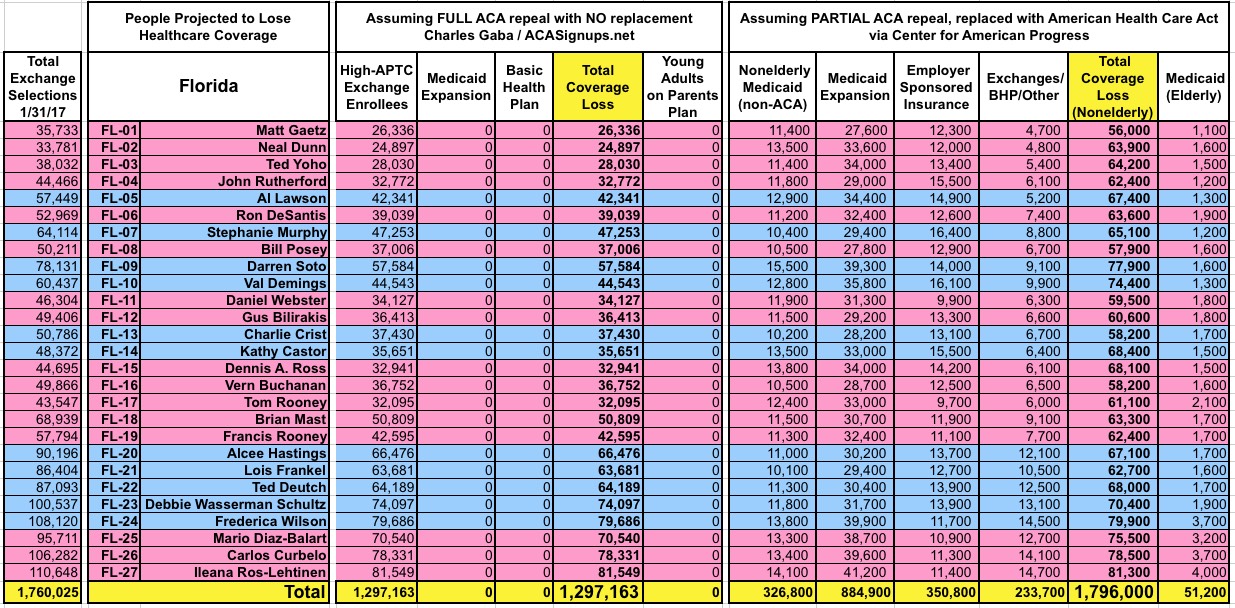
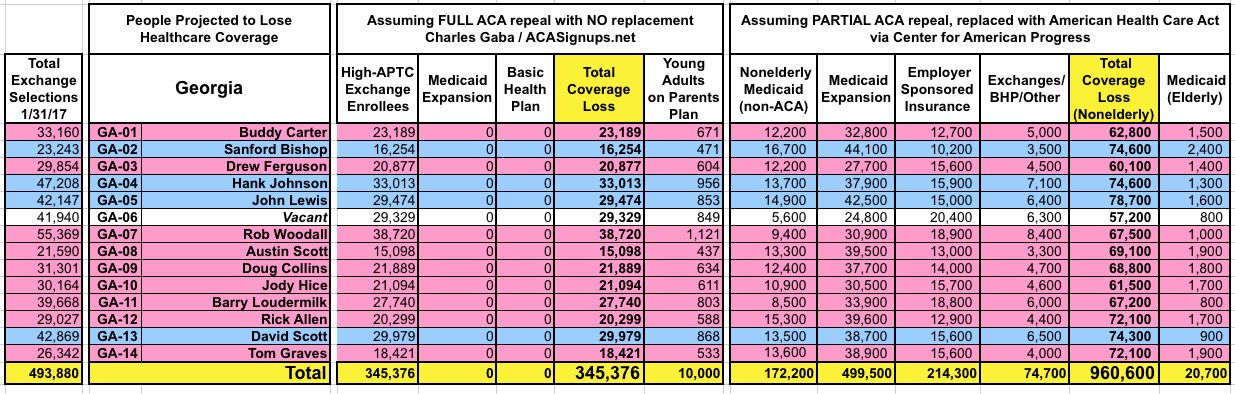
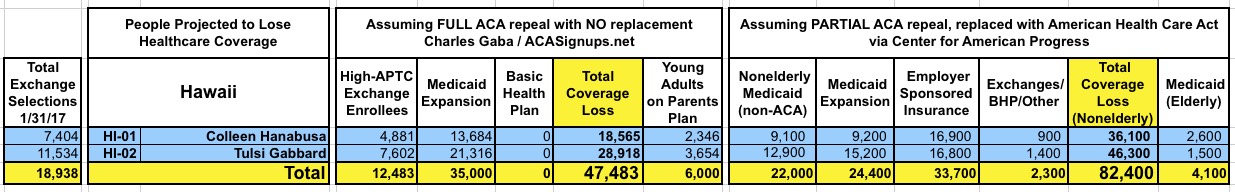
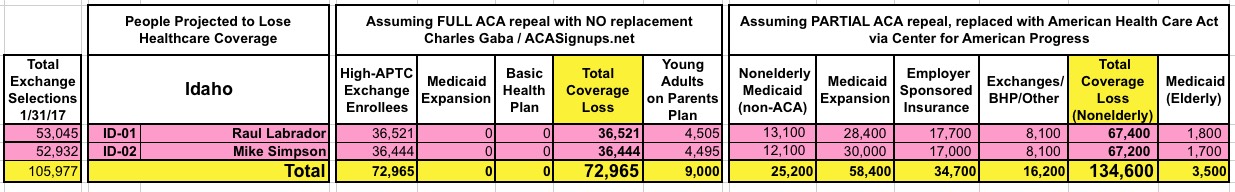
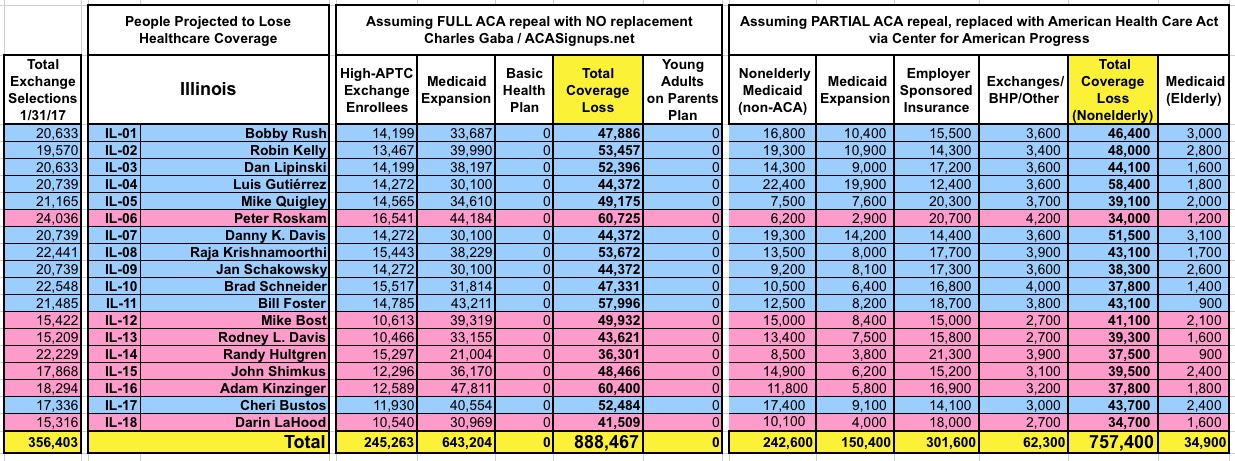
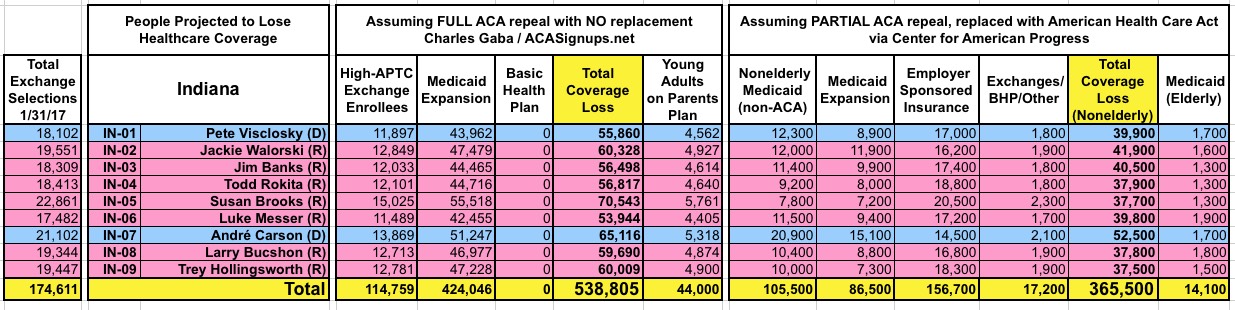
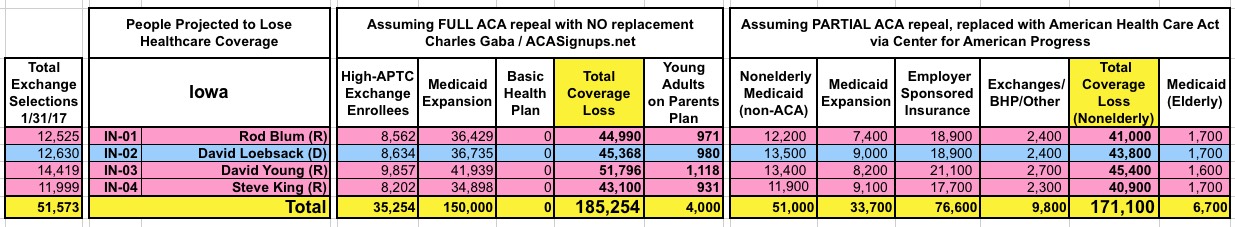
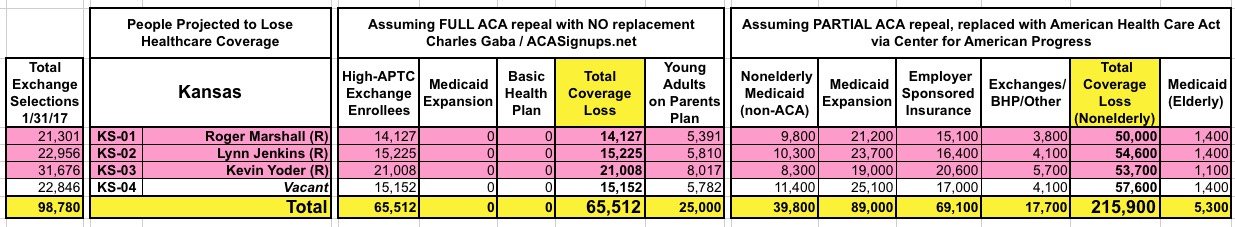
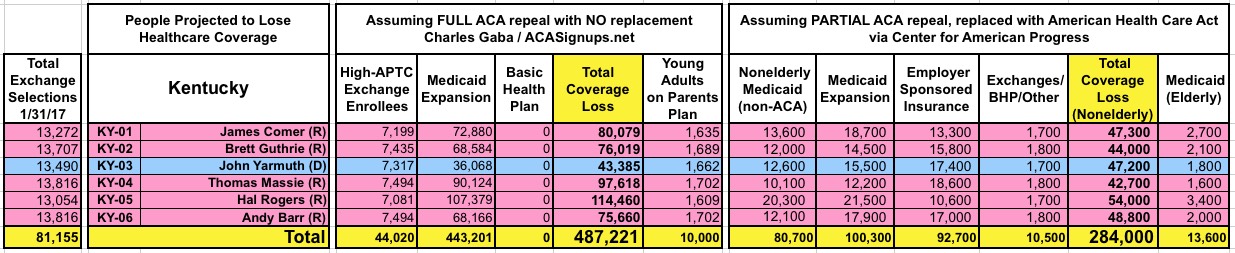
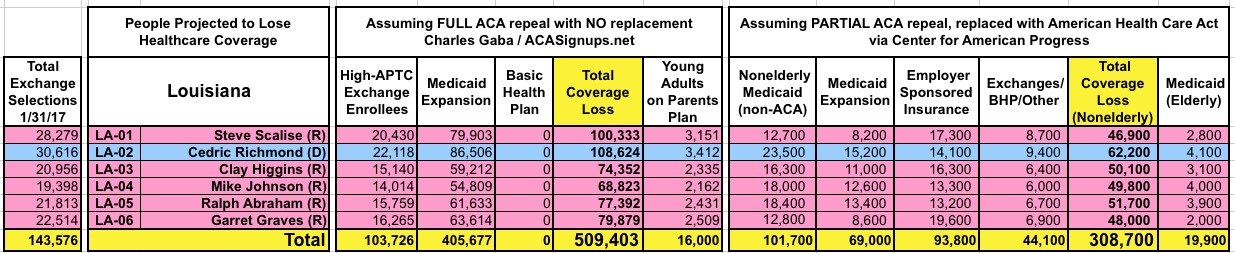
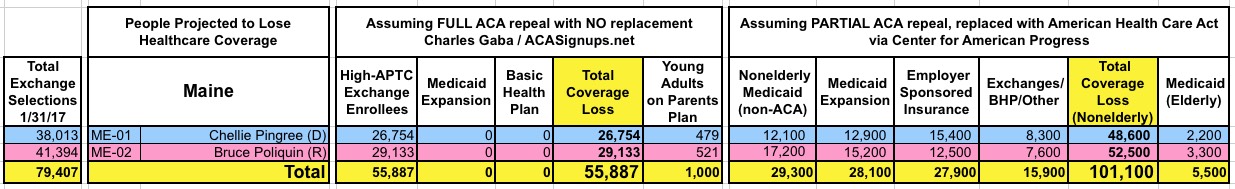
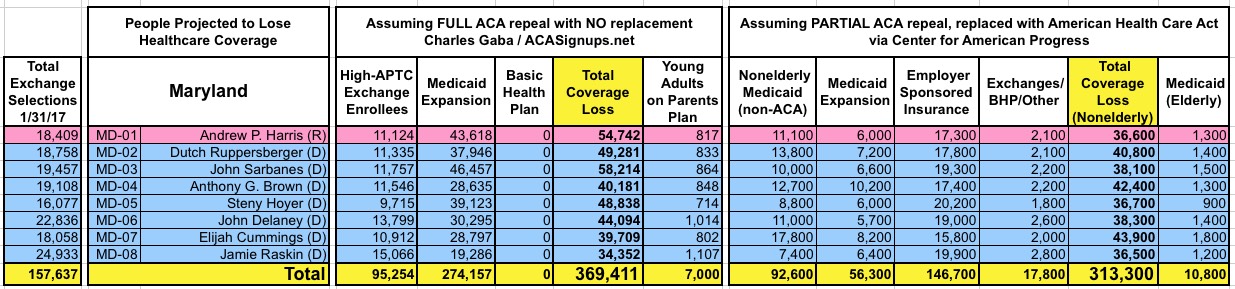
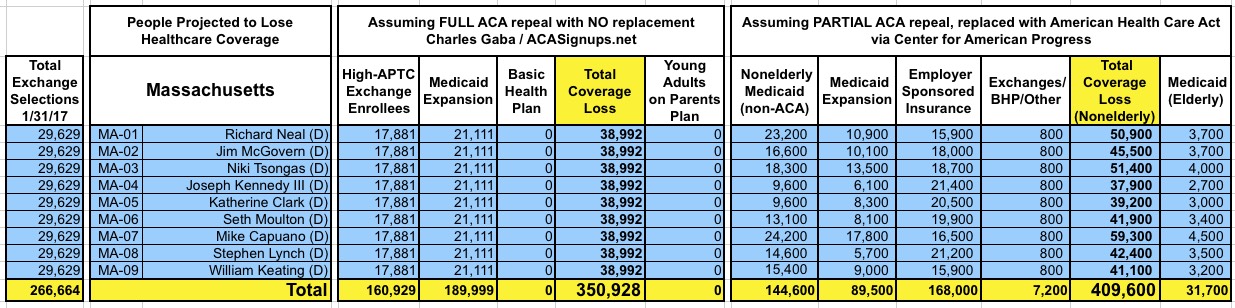
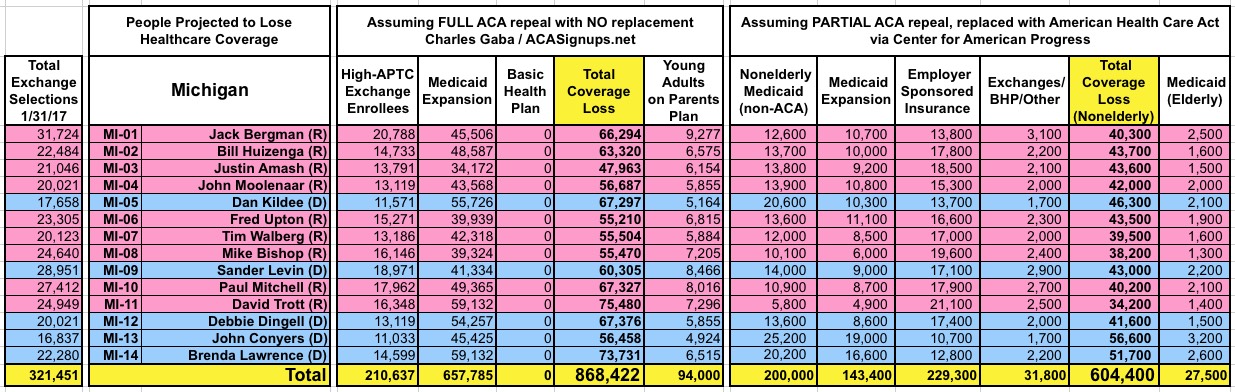
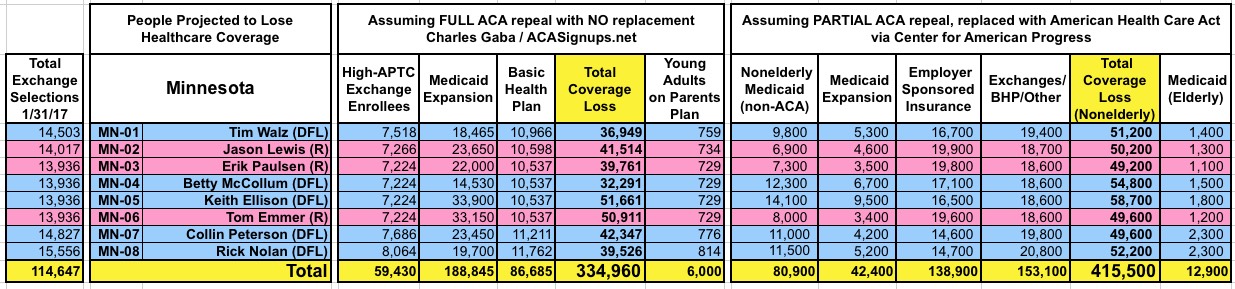
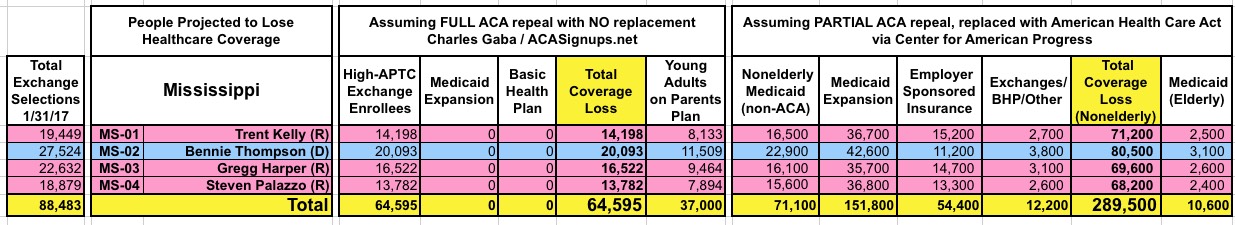
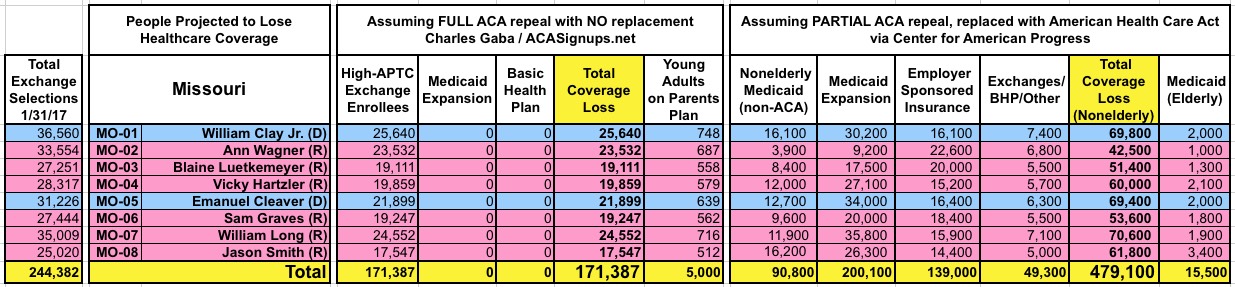
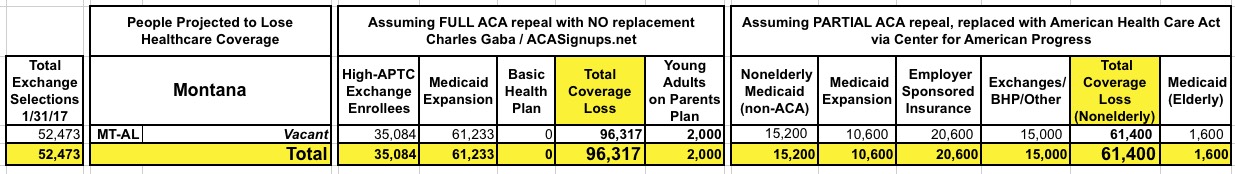
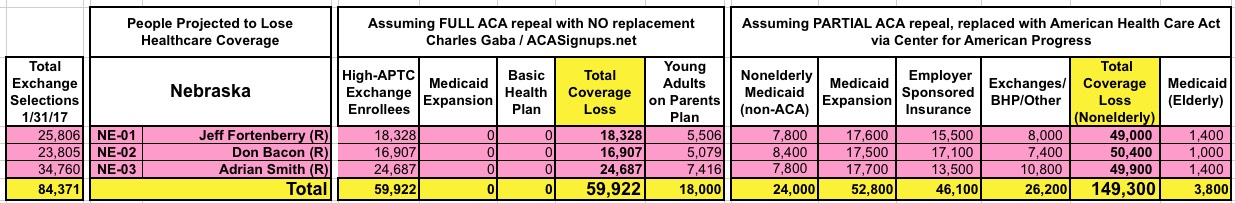
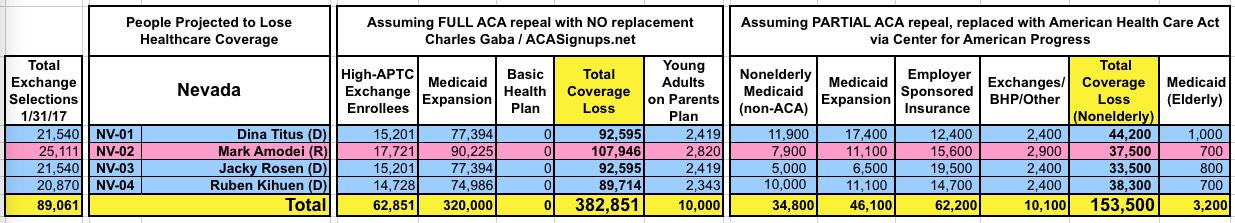
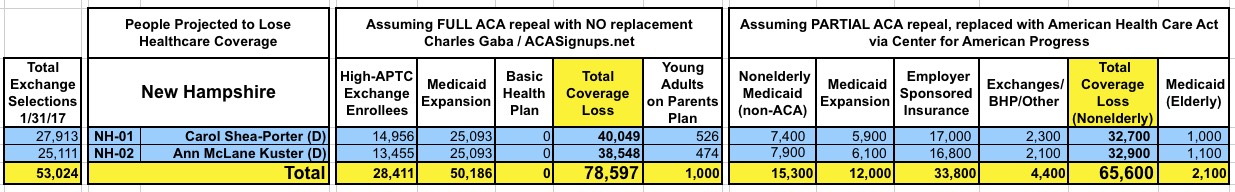
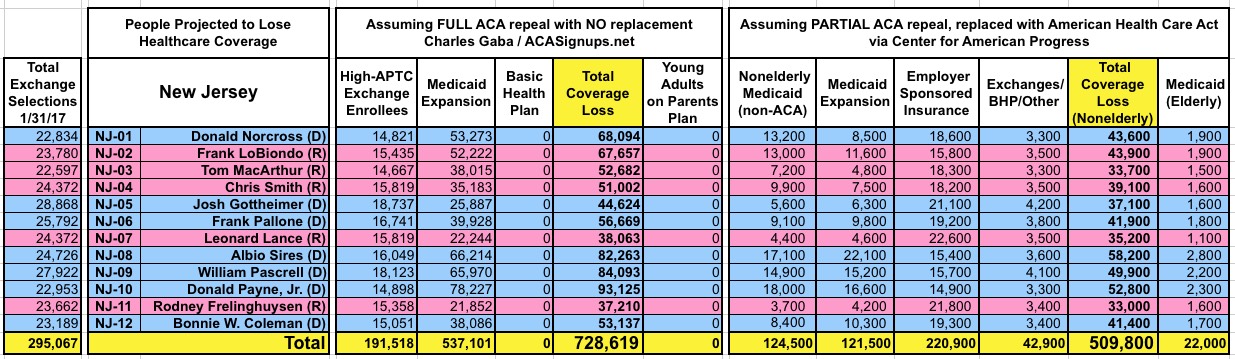
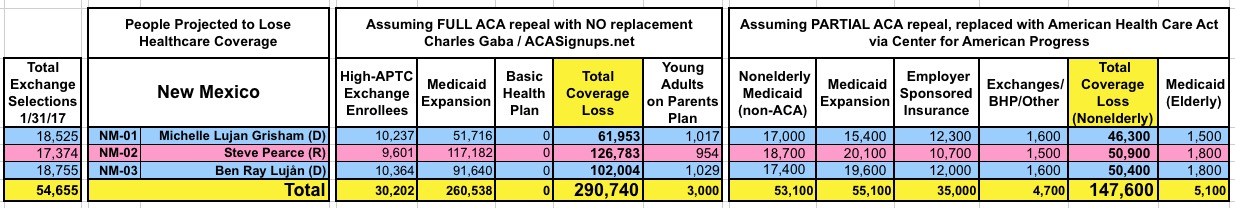
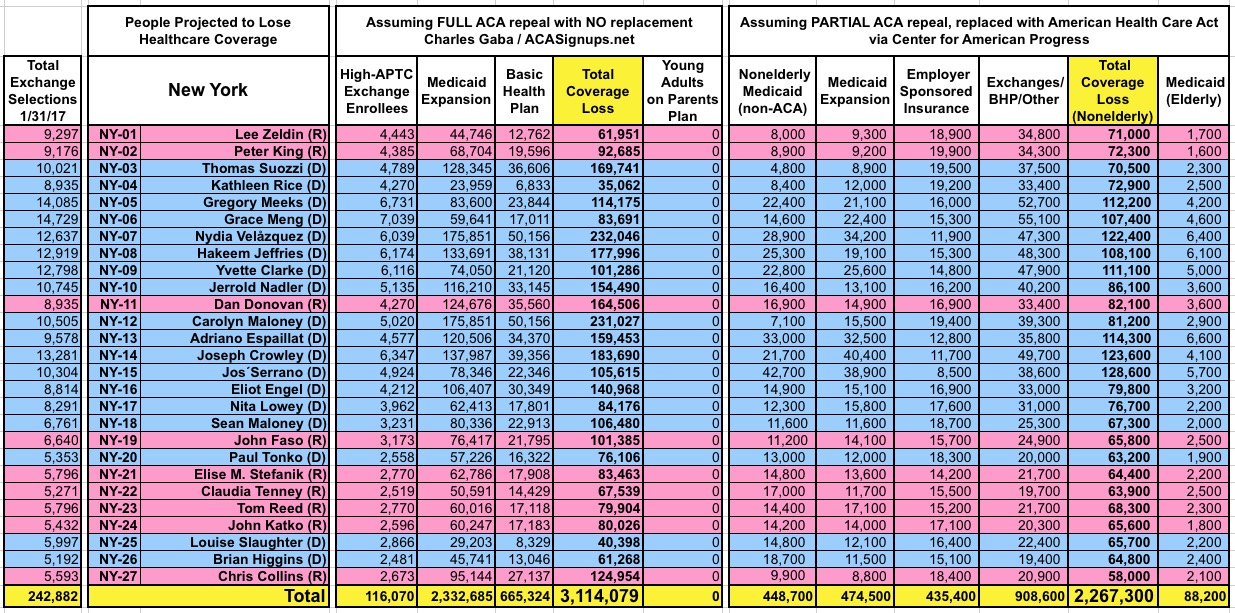
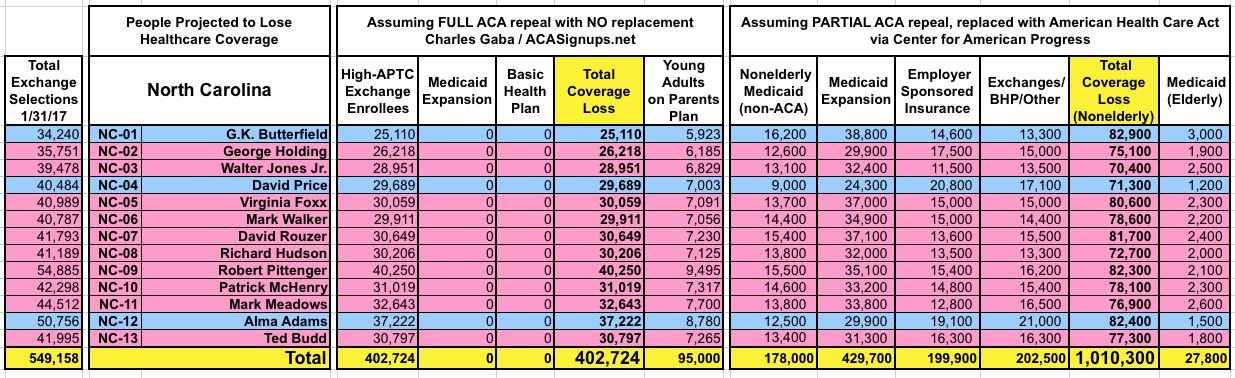
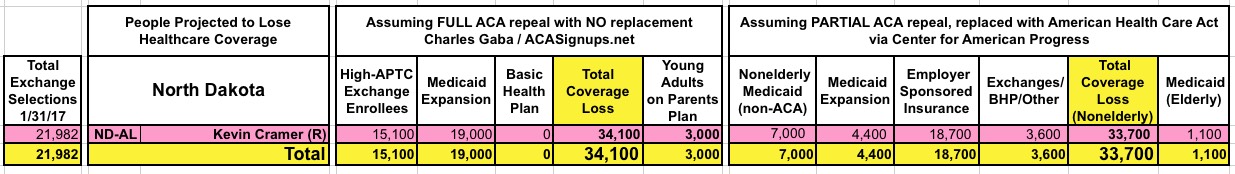
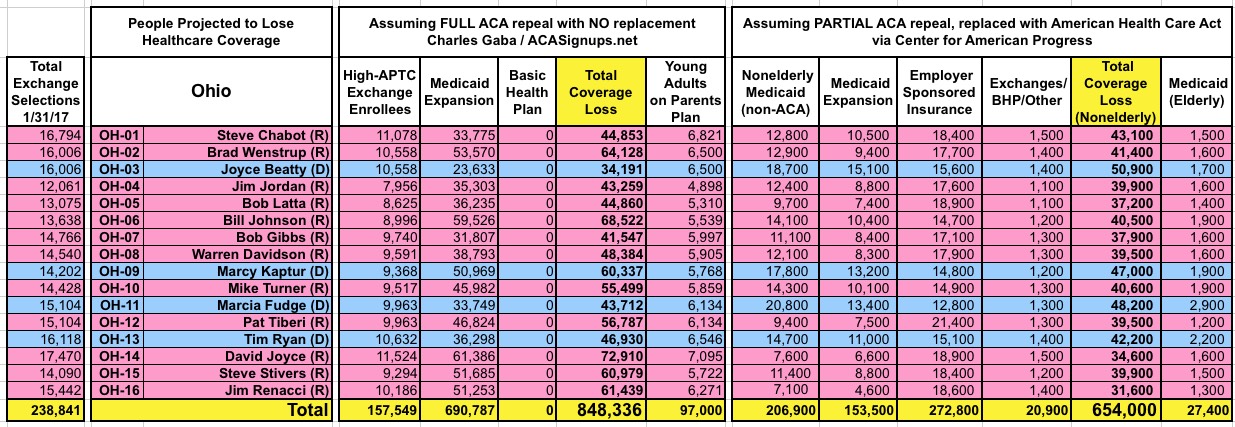
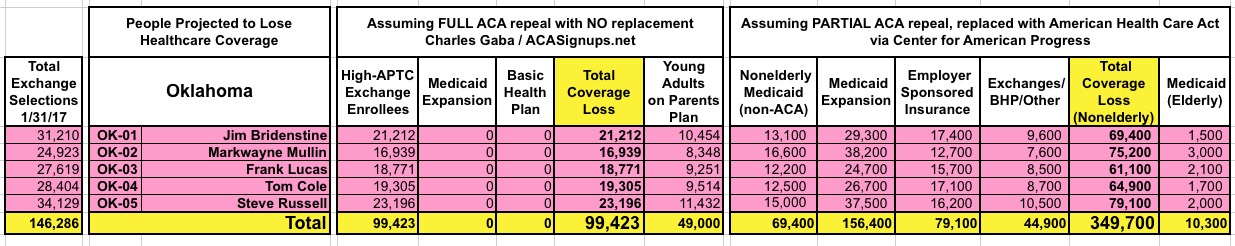
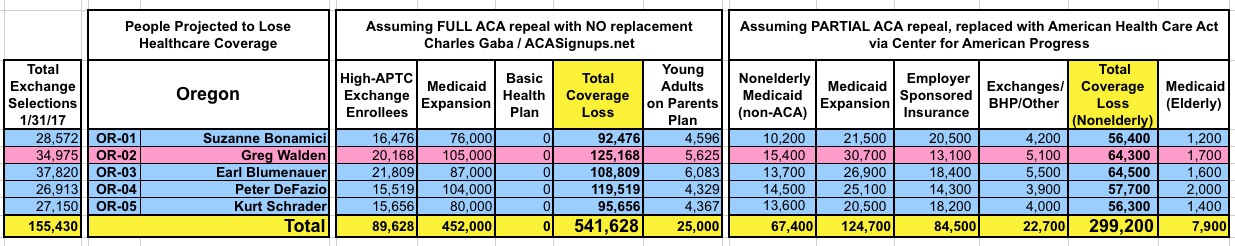
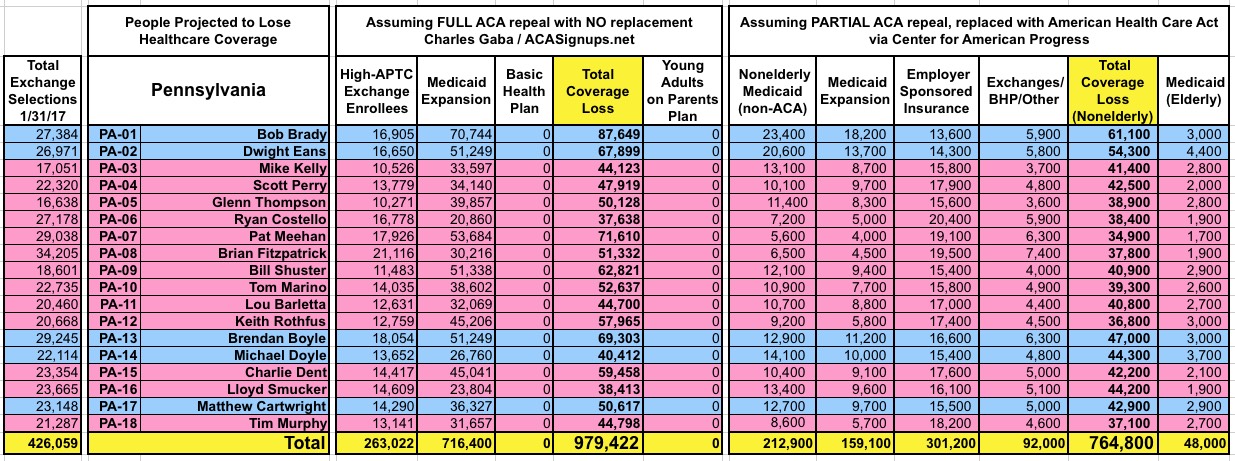
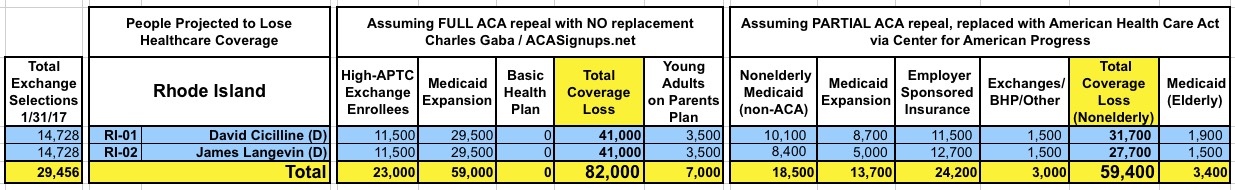
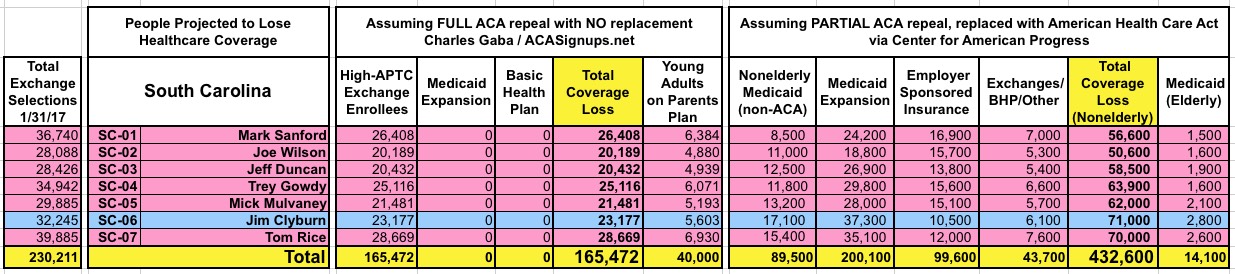
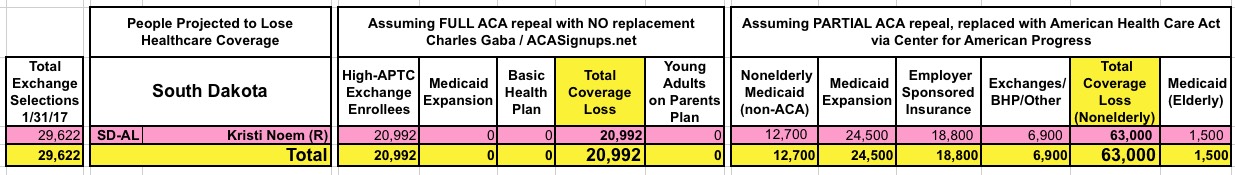
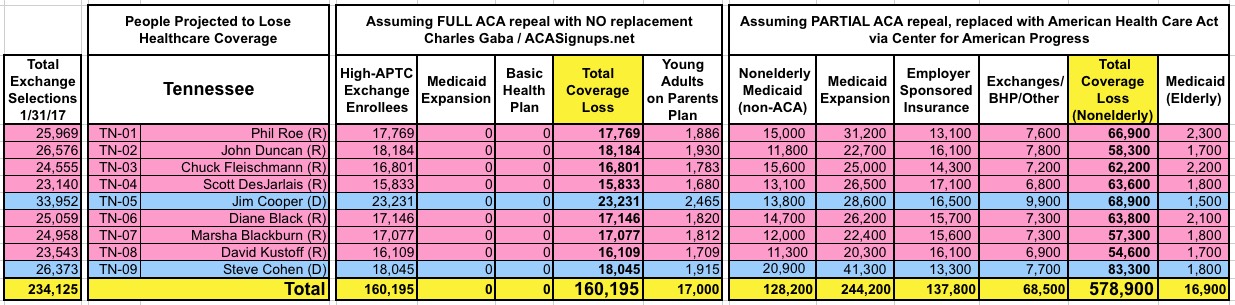
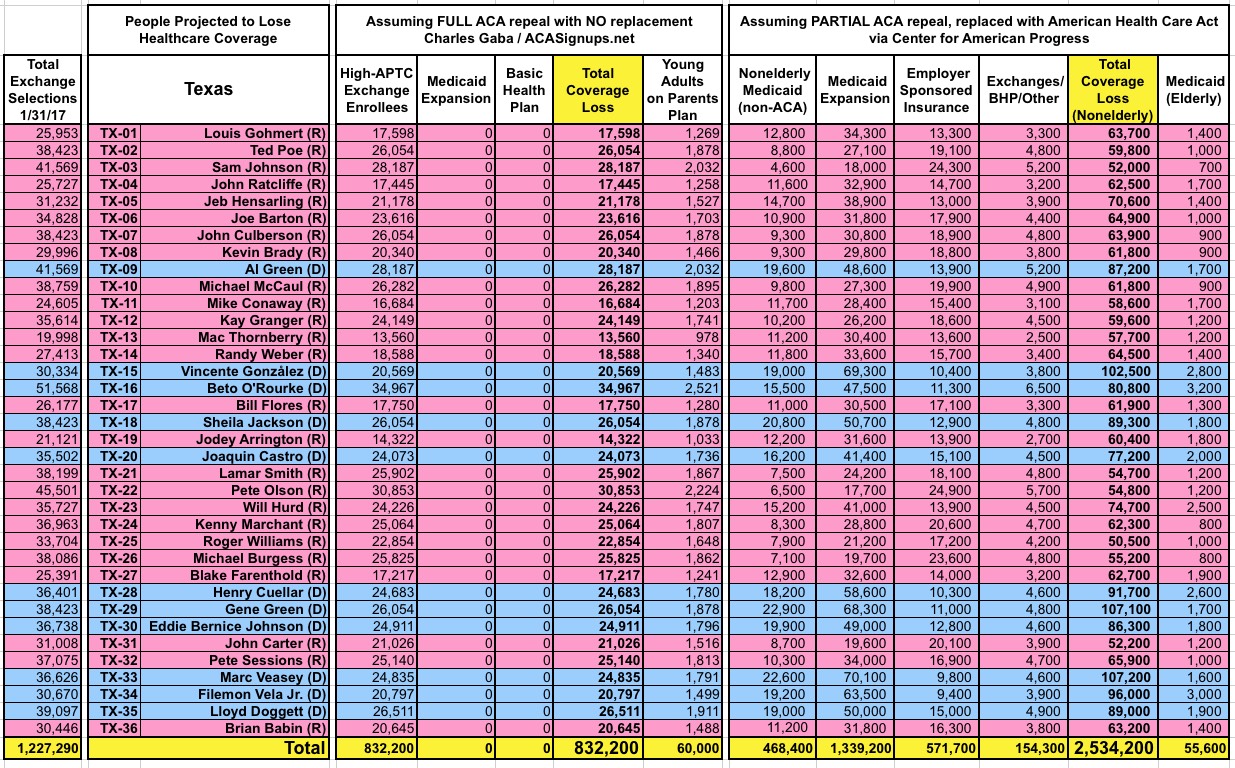
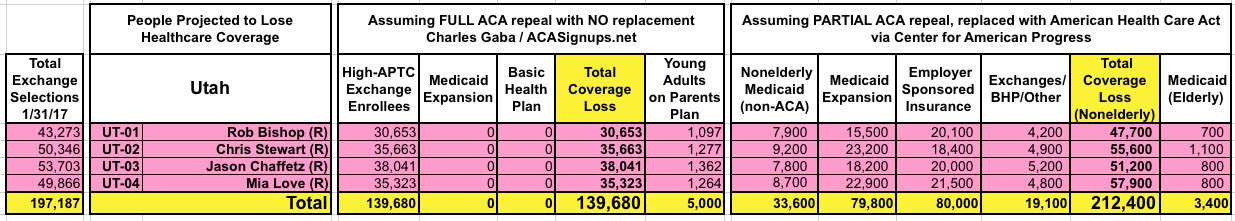
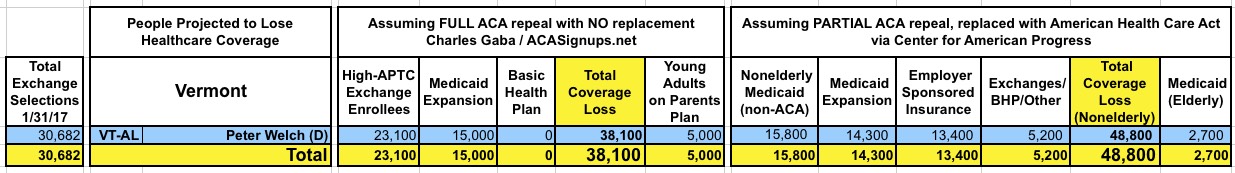
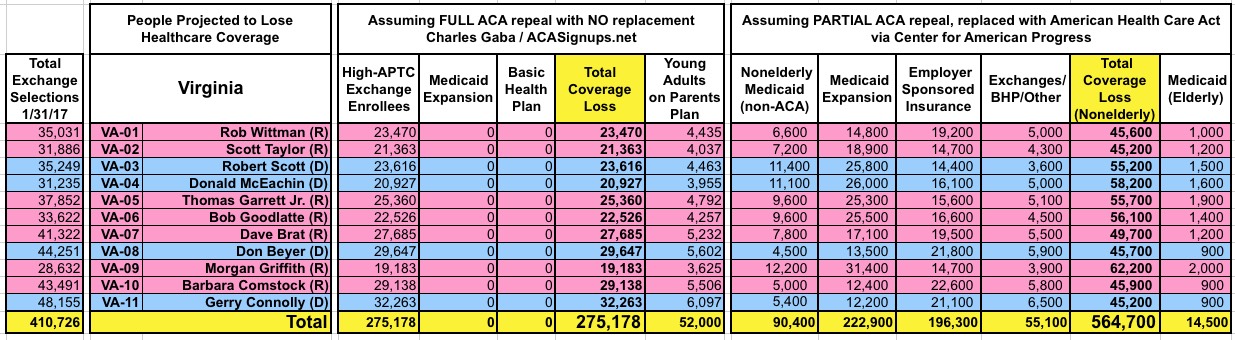
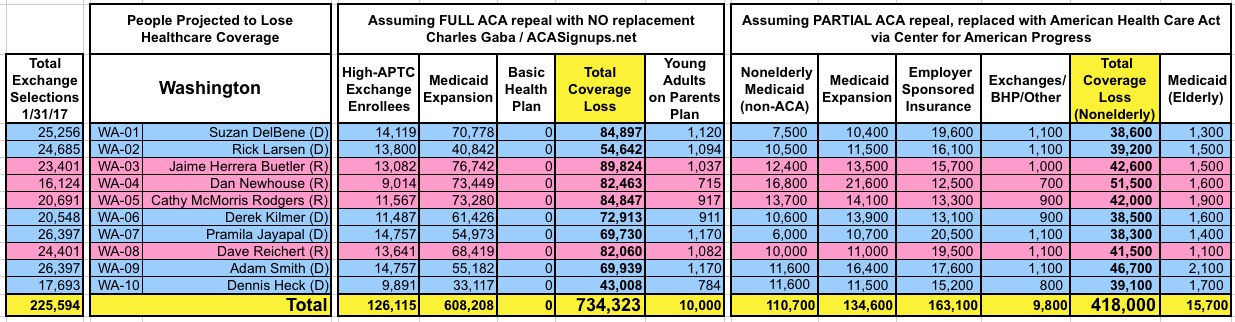
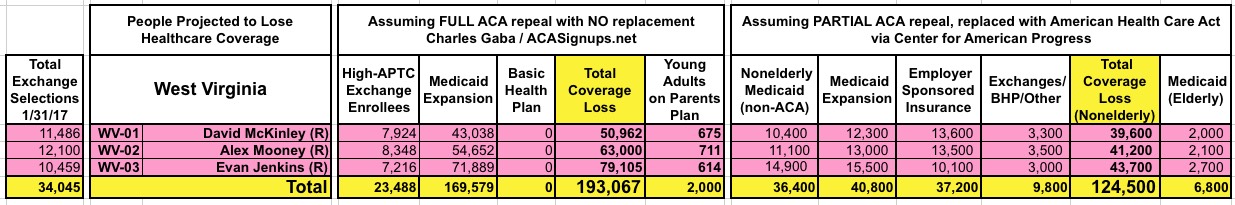
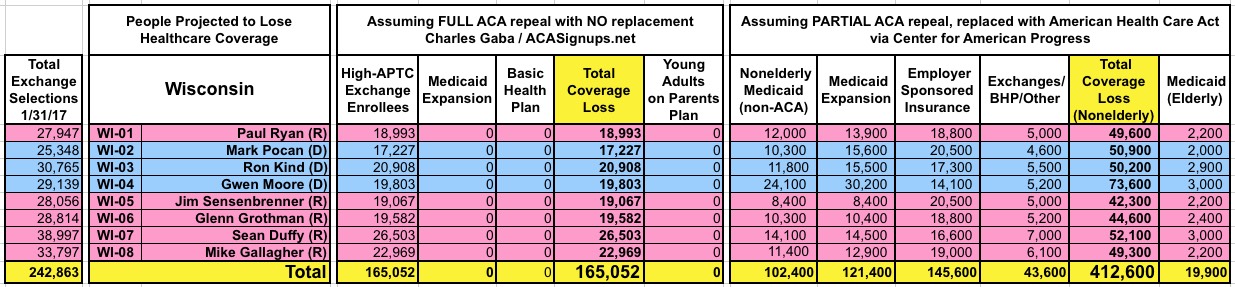
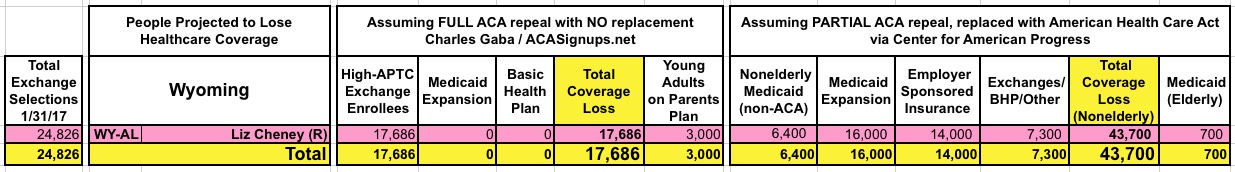
With that in mind, here's state-by-state tables comparing the projected coverage losses in all 435 Congressional Districts under either scenario: Full repeal with no replacement vs. partial repeal/replace via the Trumpcare bill. As you can see, the totals within each CD or state are considerably higher or lower in some cases...but the grand total still somehow ends up being roughly the same nationally.
Note that the CAP tables utilize the revised version of the CAP analysis released Tuesday evening, which include the latest tweaks to the House bill.
I should also note that I admit to not being so sure about the Medicaid expansion projection made by the CBO (and therefore CAP) in the current non-expansion states. Here's how the CBO words it:
The reductions in insurance coverage between 2018 and 2026 would stem in large part from changes in Medicaid enrollment—because some states would discontinue their expansion of eligibility, some states that would have expanded eligibility in the future would choose not to do so...
...Some of that decline would be among people who are currently eligible for Medicaid benefits, and some would be among people who CBO projects would be made eligible as a result of state actions in the future under current law (that is, from additional states adopting the optional expansion of eligibility authorized by the ACA).
In other words, the CBO is pretty certain that if the ACA stays around as is, at least some of the 19 non-expansion states will come around and expand Medicaid over the next few years. I suspect they're correct about this, but that isn't easy to explain in the tables. Furthermore, they don't specify which states they think would do so, which made CAP's job more difficult; here's how they handled it:
Estimating reductions in Medicaid by district required more assumptions. The CBO projects that a total 14 million fewer people would have Medicaid coverage by 2026 under the House bill: 5 million fewer would be covered by additional Medicaid expansion in new states, and 9 million fewer would have Medicaid coverage in current expansion states and among pre-ACA eligibility groups in all states. The CBO projects that, under the ACA, additional Medicaid expansion would increase the proportion of the newly eligible population residing in expansion states from 50 percent to 80 percent by 2026. It projects that, under the House bill, just 30 percent of the newly eligible population would be in expansion states. Extrapolating from the CBO’s numbers, we estimate the bill results in a Medicaid coverage reduction of 3.3 million enrollees in current expansion states by 2026.
...Because we do not know which individual states would participate in Medicaid expansion in 2026 in either scenario, our corrected estimates give nonexpansion states the average effect of forgone expansion and all expansion states the average effect of rolling back eligibility. We divided the 5 million enrollment reduction due to forgone expansion among nonexpansion states’ districts proportionally by the number of low-income uninsured. We made each expansion state’s share of that 3.3 million proportional to its Medicaid expansion enrollment in its most recent CMS report and then allocated state totals to districts proportional to the increase in nonelderly adult enrollment between 2013 and 2015. For Louisiana, which recently expanded Medicaid, we took our statewide total from state data and allocated to districts by the number of low-income uninsured adults.
In other words, CAP took the 5 million people who the CBO assumes would otherwise be covered via additional expansion states and divides them up proportionately among all 19 of the current non-expansion states. I'm not sure this is the best way to do it, but under the circumstances I suppose it makes about as much sense as anything else.
But wait, it gets even more surreal: Those who've been following this project for the past couple of months know that at the national and statewide level, I also included one additional category of people who could potentially lose coverage: Young adults age 18-25 on their parents plan thanks specifically to the ACA. The grand total on this is officially in the 3 million range nationally, but many states already had a similar law on the books prior to the ACA anyway, so I estimated that only perhaps 1.4 million of them are actually at risk of being kicked off of their policy if the ACA were to be fully repealed.
I never bothered including this breakdown at the county or congressional district level before today because these numbers are the fuzziest of all, and I wasn't sure how to break them out within each state anyway. For the sake of completeness, however, I've included them in the updated tables below as a sort of "supplemental" column; they still aren't included in the grand total.
As it happens, the Center for American Progress analysis also includes a sort of "supplemental" category of people who are in sort of a special case: Elderly Medicaid patients. Remember, while pretty much everyone over 65 is enrolled in Medicare, that doesn't cover all of their medical expenses, and there are several million seniors on Medicare who are also enrolled in Medicaid. CAP has projected that due to Trumpcare's non-ACA Medicaid per-capita and/or block grant provisions, some of these folks would be kicked off of the program. Guess how many? Yes, around 1.4 million.
In other words, by a weird quirk of math, it works out to around 24 million plus around 1.4 million "special cases" either way...even though the specific populations affected are quite different. Huh.
Advertisement
