

ALL-NEW: How many would lose coverage under Trumpcare in YOUR State/District (BCRAP Edition)??
Tue, 06/27/2017 - 3:05pm
UPDATE 7/20/17: The CBO score of BCRAP 2.0 has just been released, and while there are some tweaks/changes to their conclusions here and there, they still project about 22 million people to lose coverage by 2026 if BCRAP 2.0 is signed into law. They still expect about 15 million Medicaid enrollees to lose coverage by 2026. The only significant change on the "net loss of coverage" front is that they estimate that instead of 7 million people losing individual market coverage, they now project a net indy market reduction of 5 million...but also now expect about 2 million people with employer-based coverage to lose that, resulting in a net loss of...22 million.
I don't know if CAP plans on recrunching their numbers, since the BCRAP 2.0 bill still doesn't include the Cruz amendment which is supposedly going to be part of the final version voted on, but in the meantime, I'd imagine all numbers below could be updated by simply lowering all Individual Market column numbers by 29%...and just adding those numbers over to a new, Employer Coverage column.
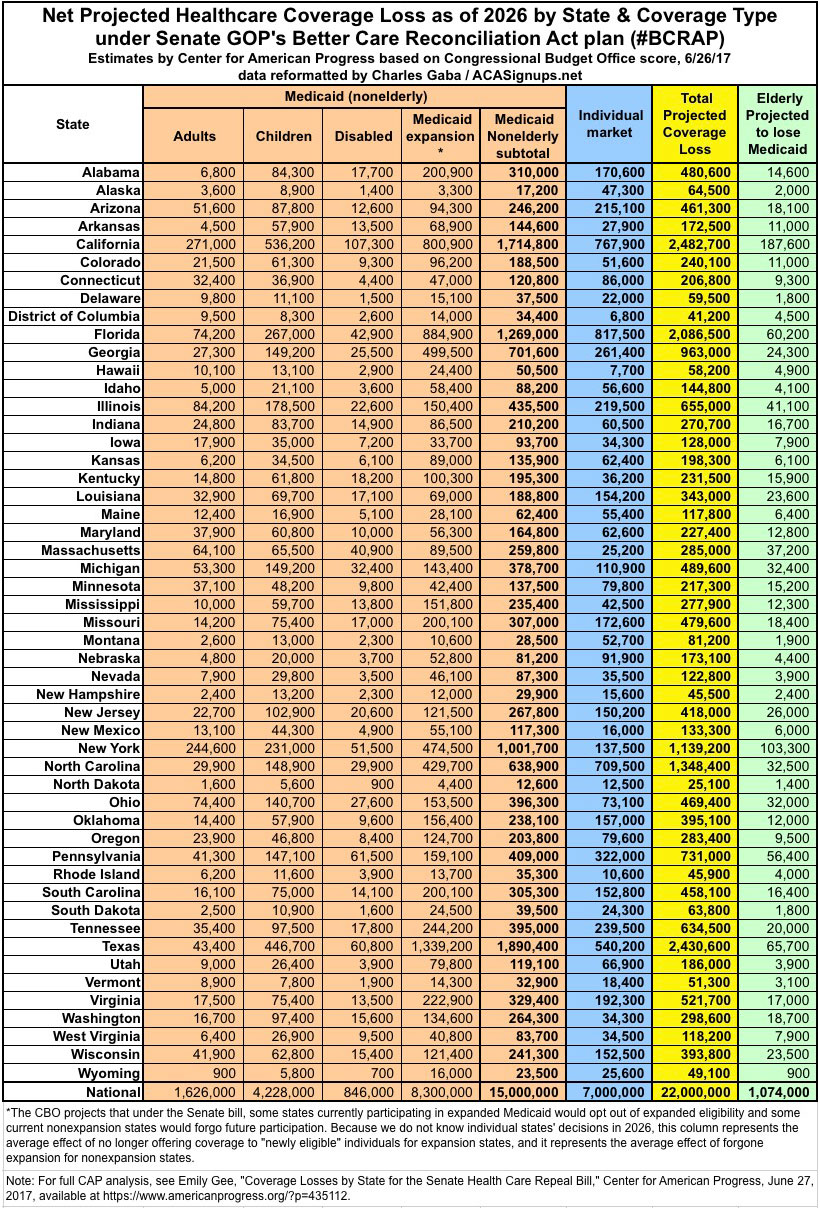
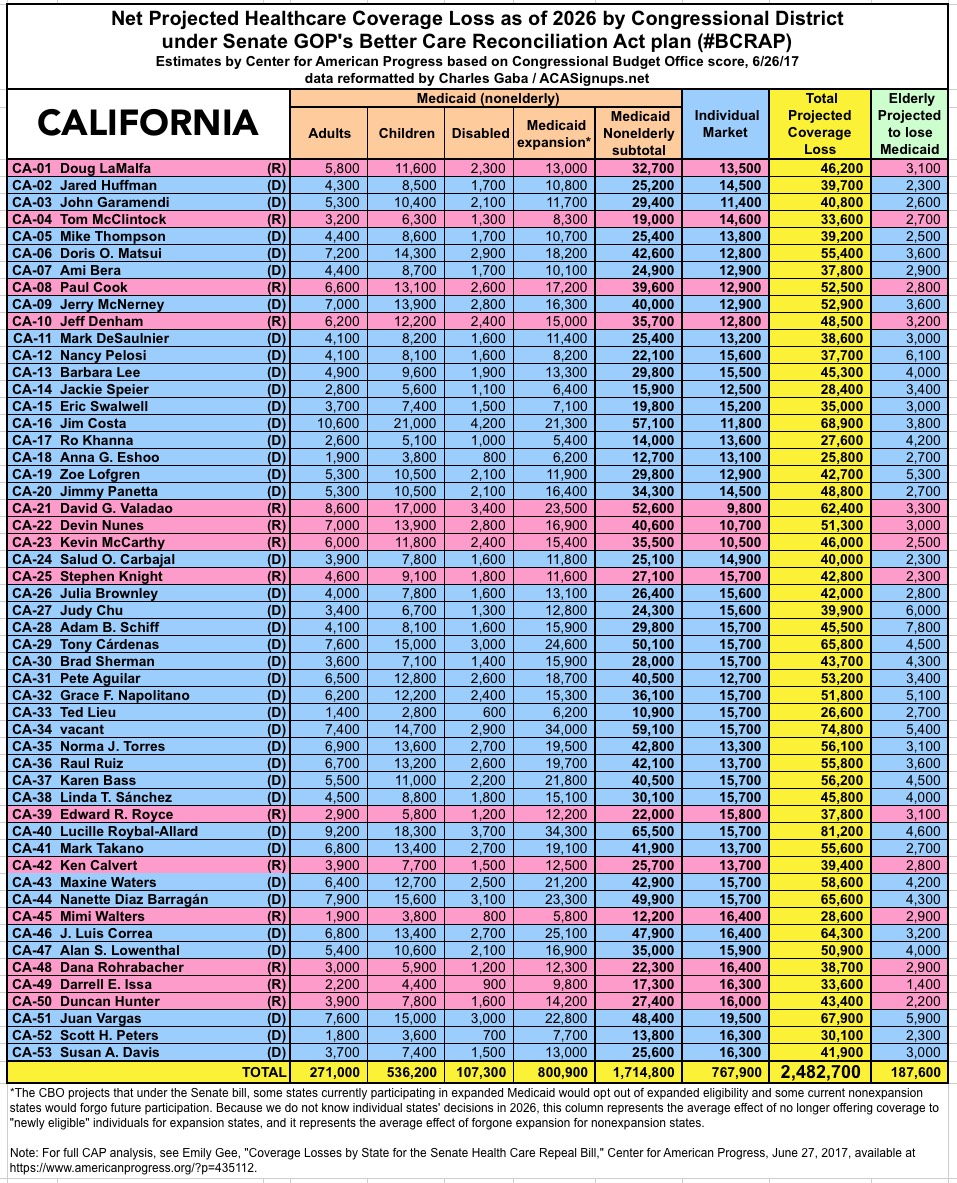
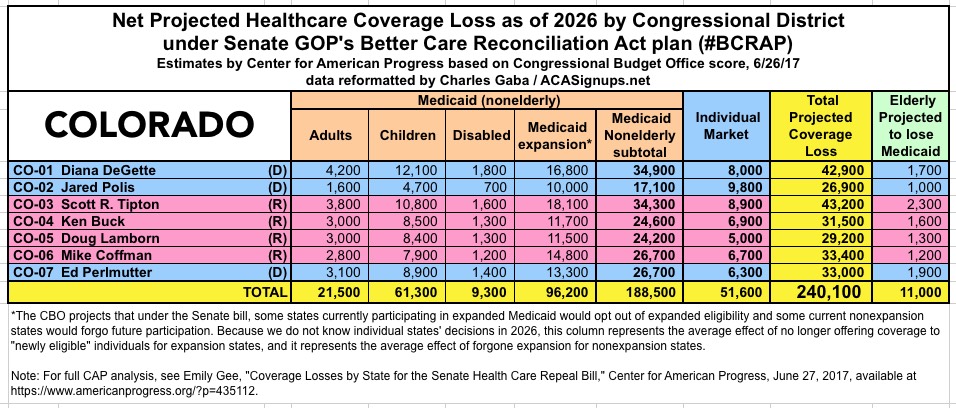
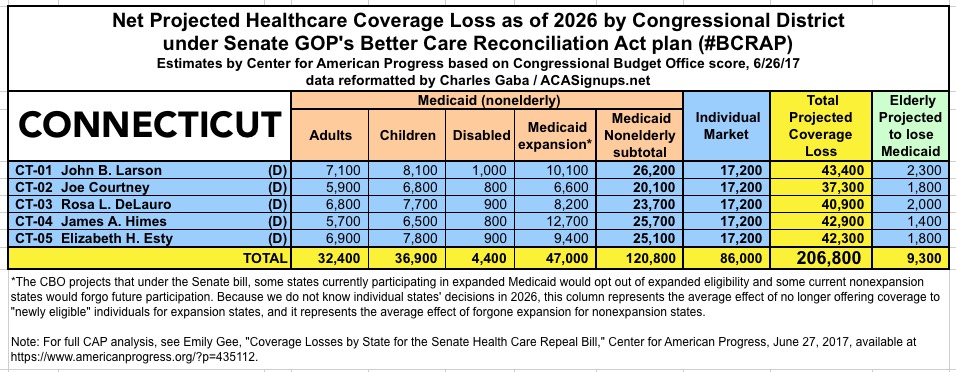
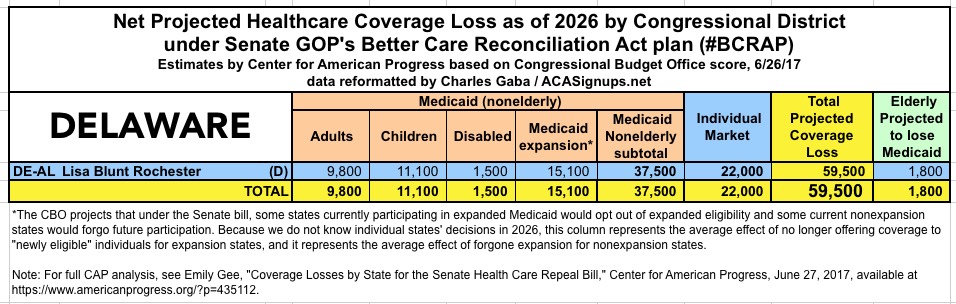
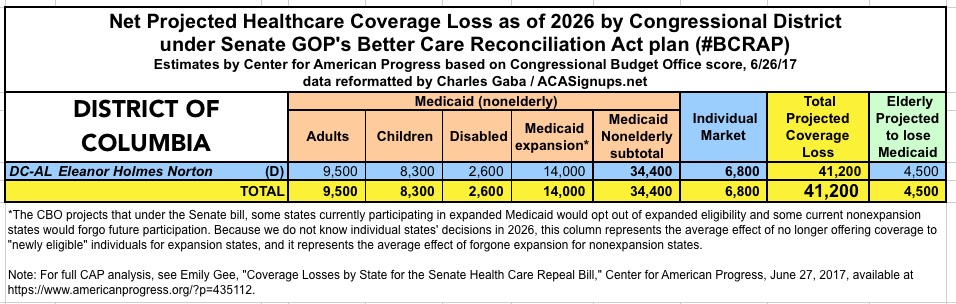
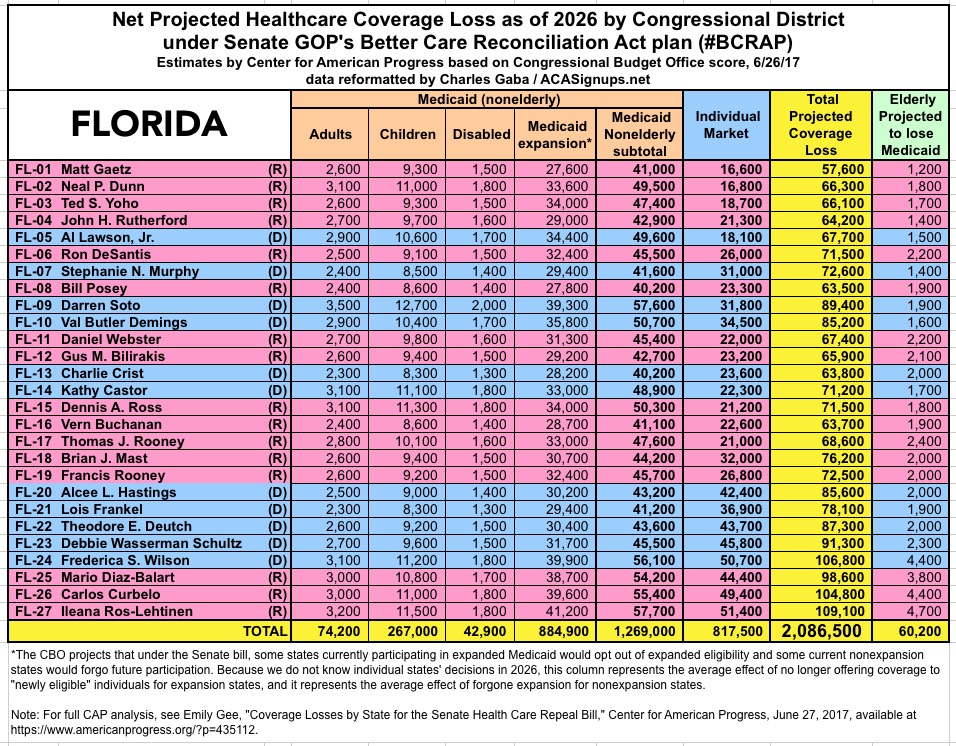
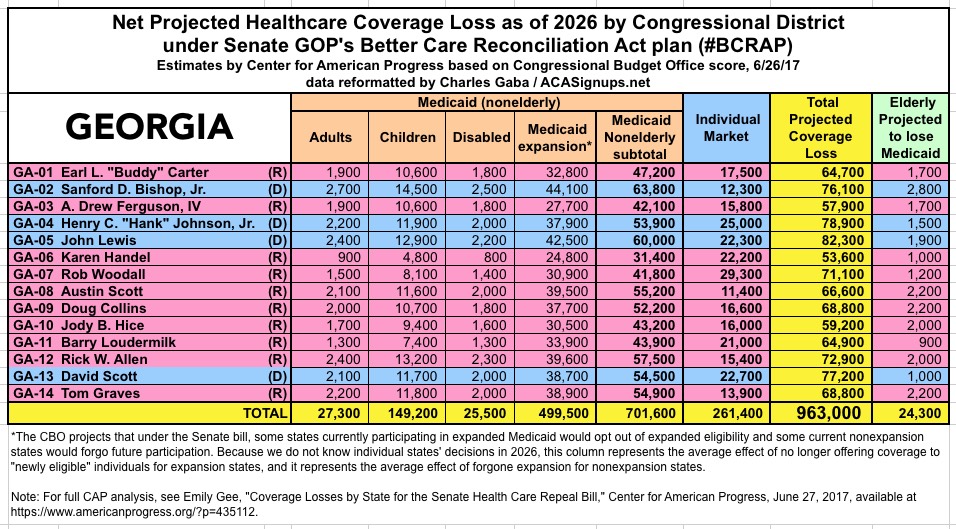
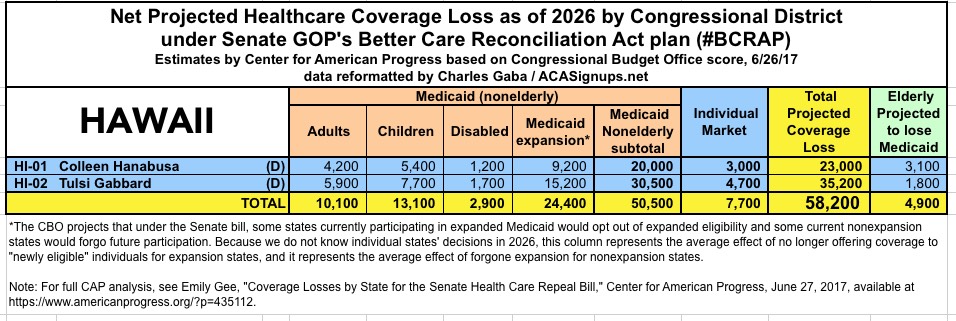
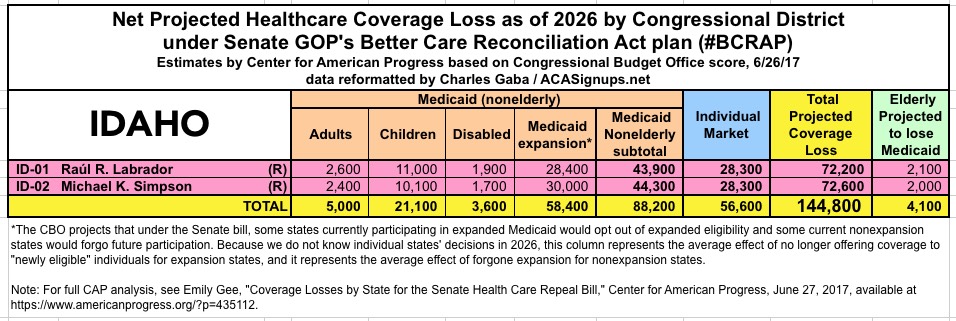
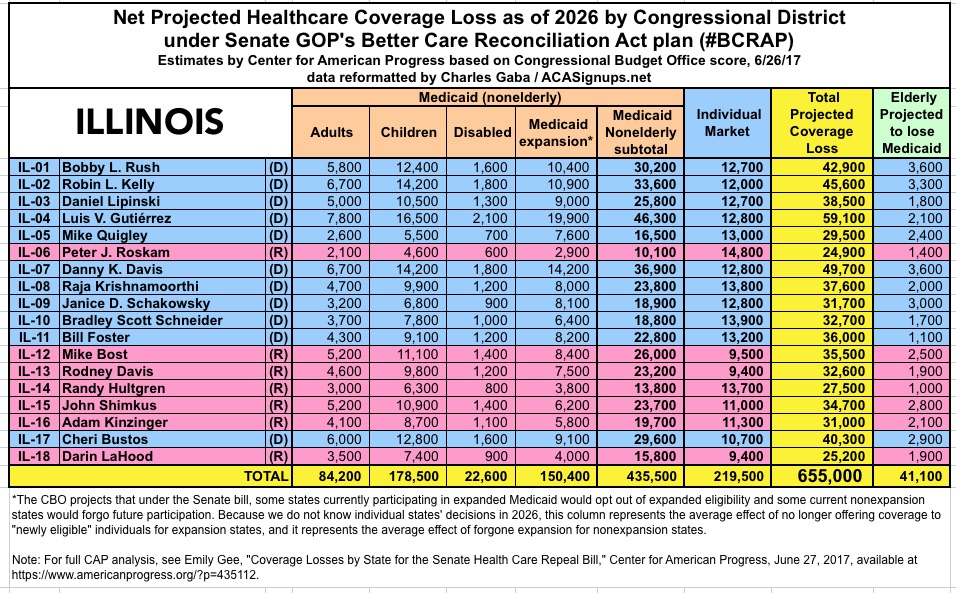
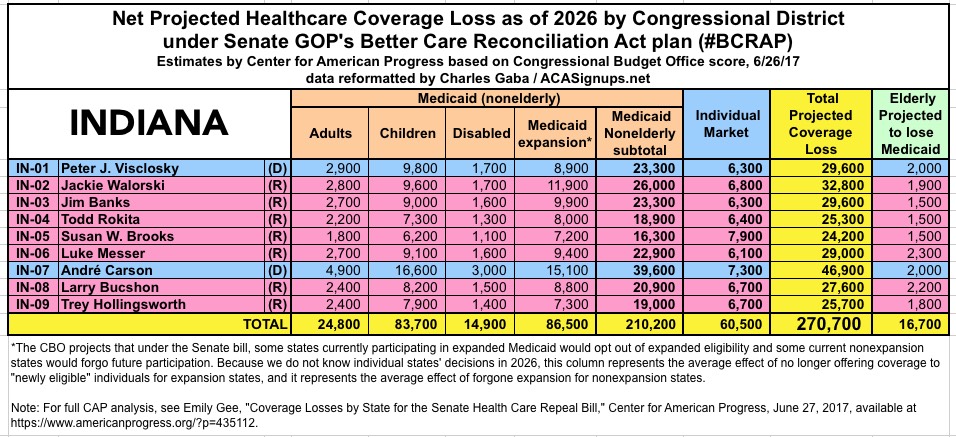
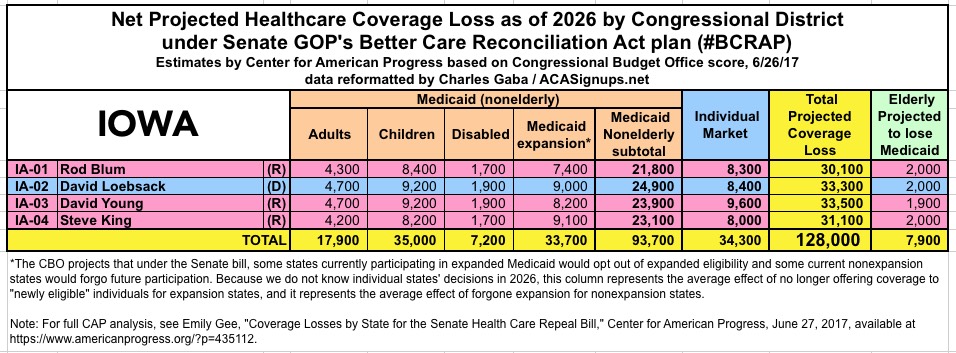
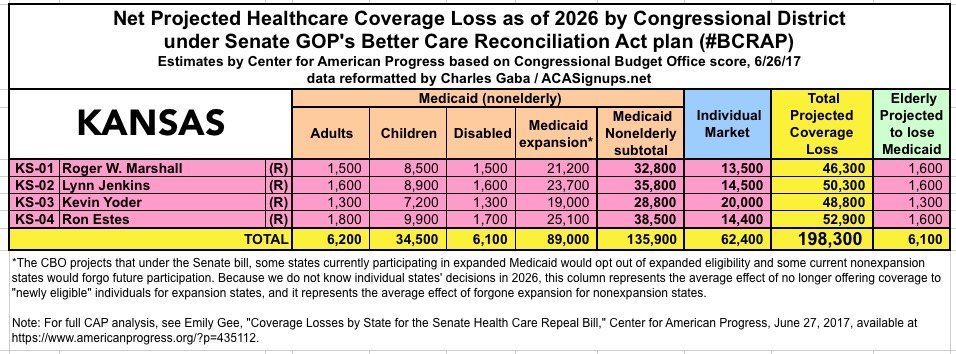
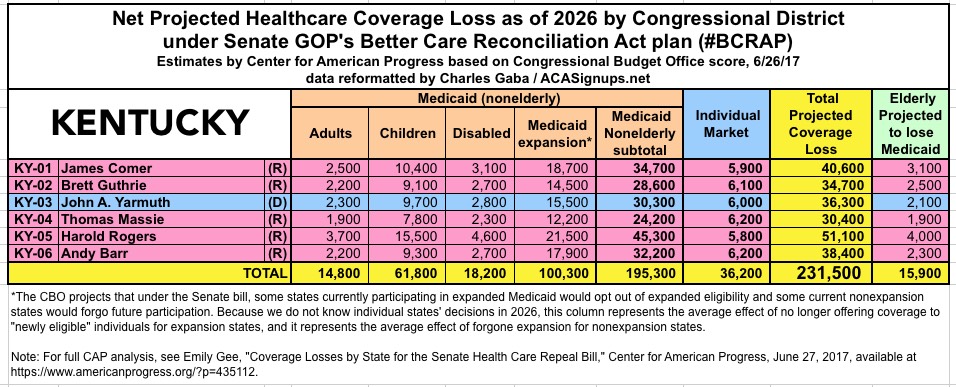
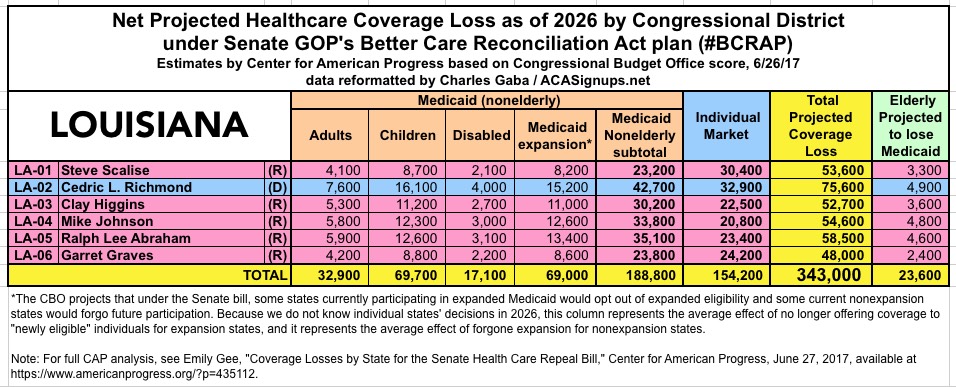
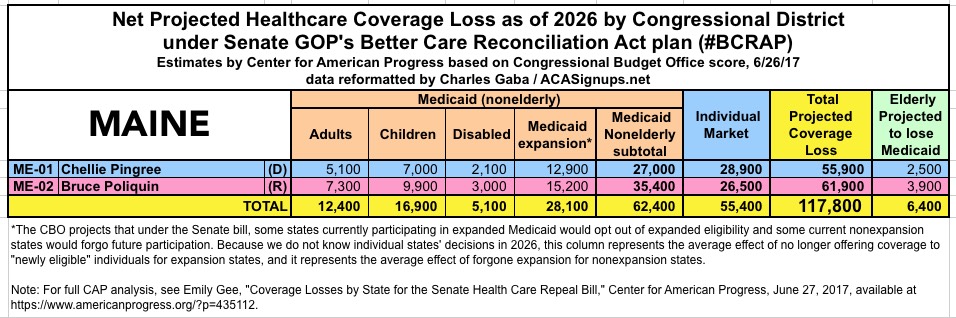
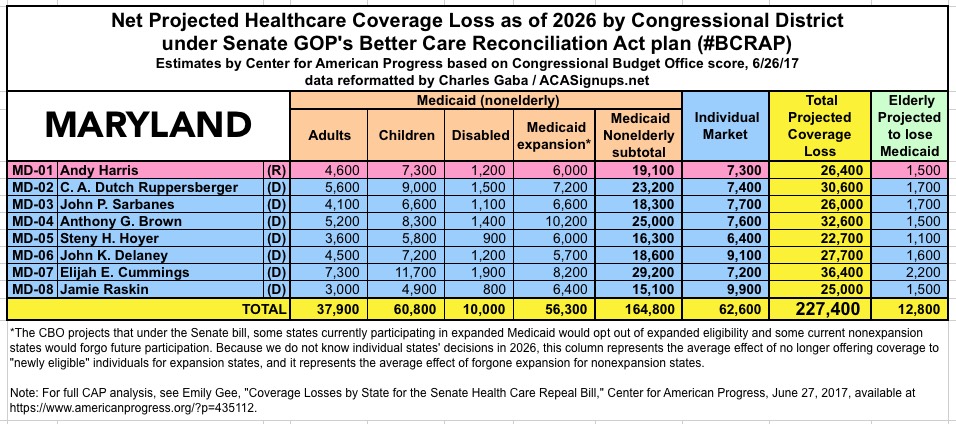
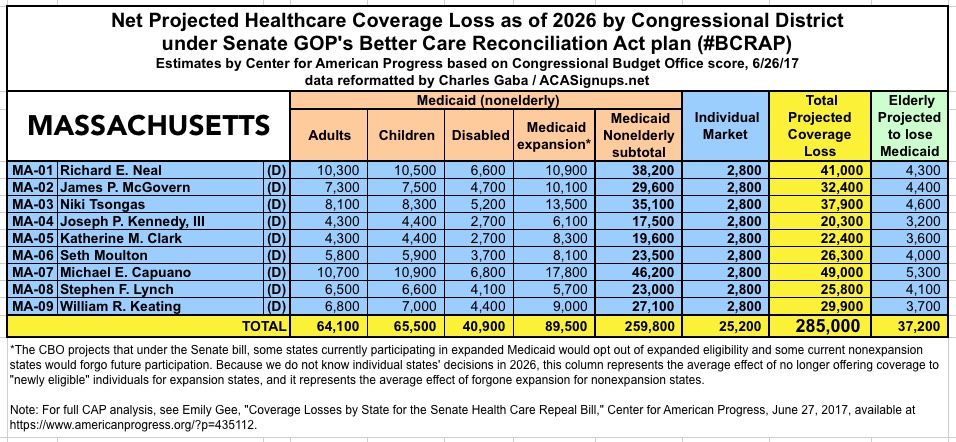
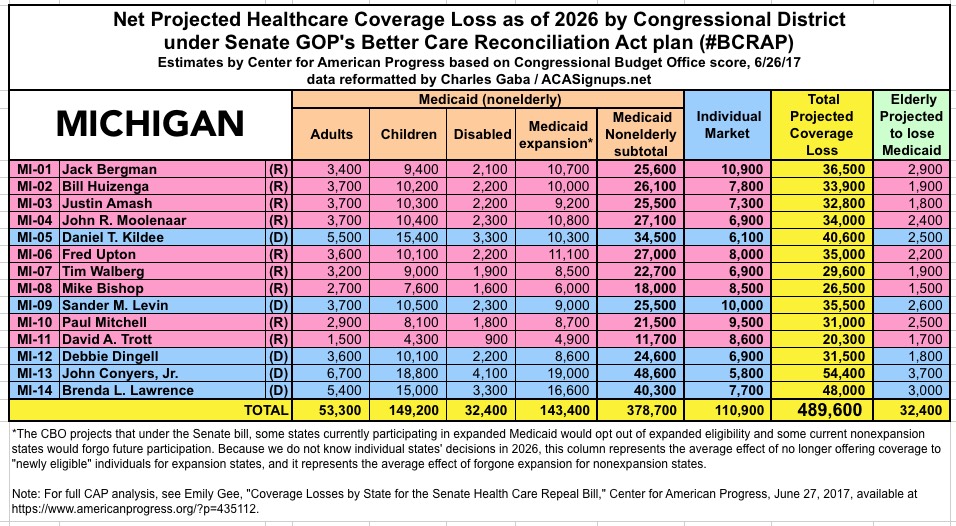
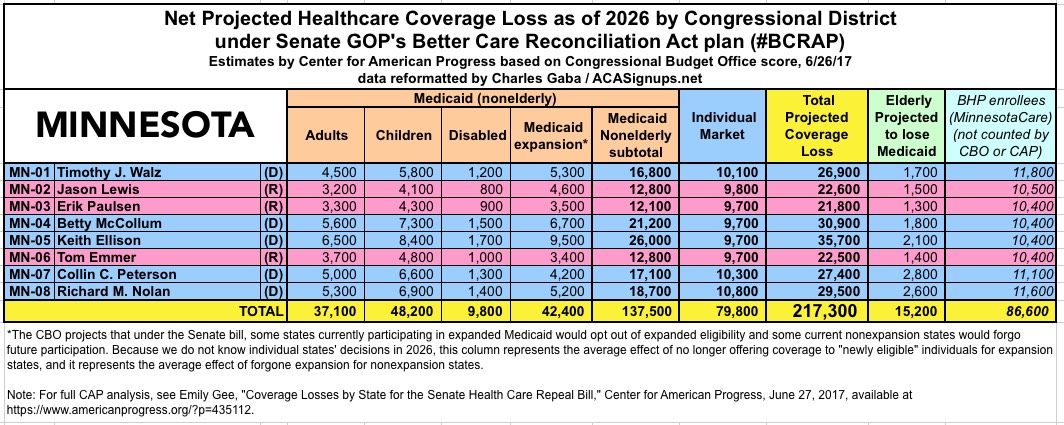
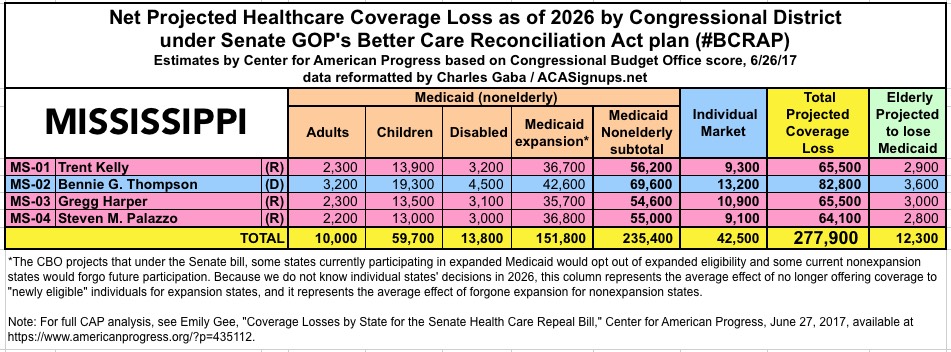
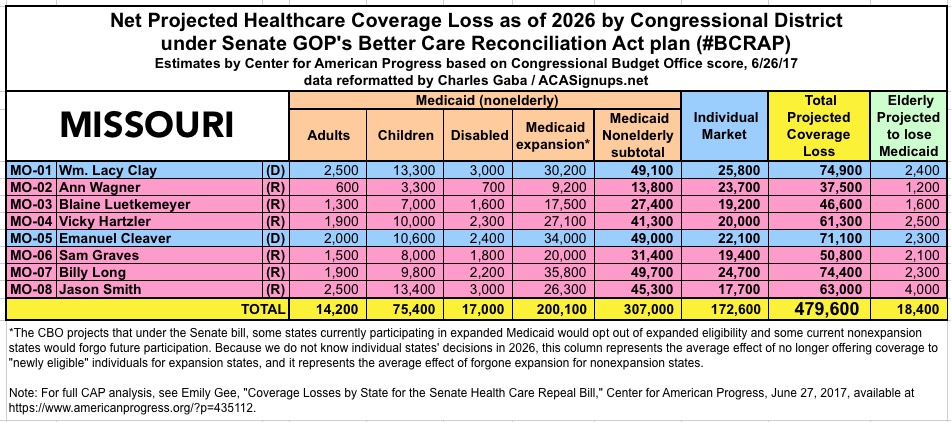
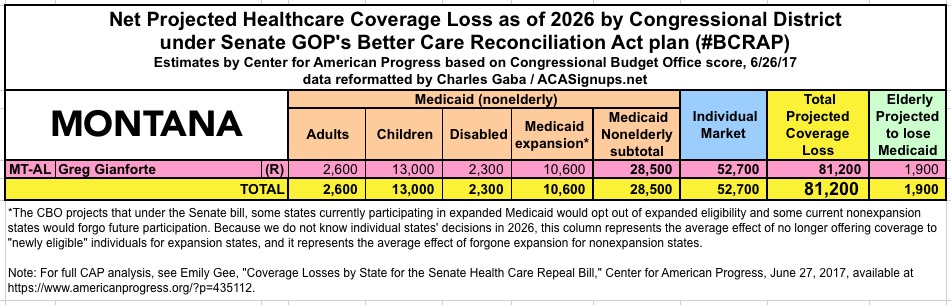
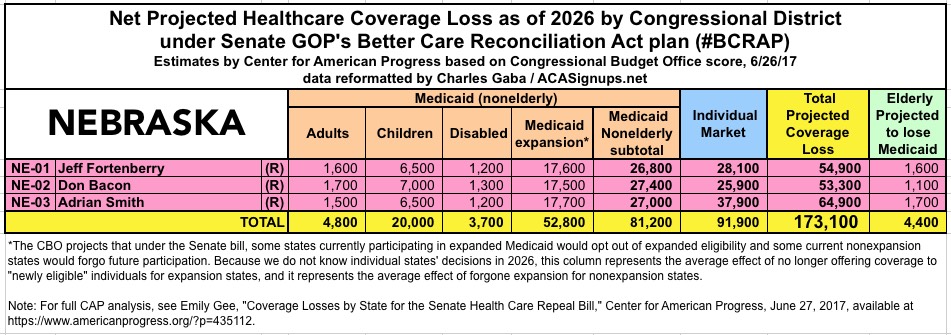
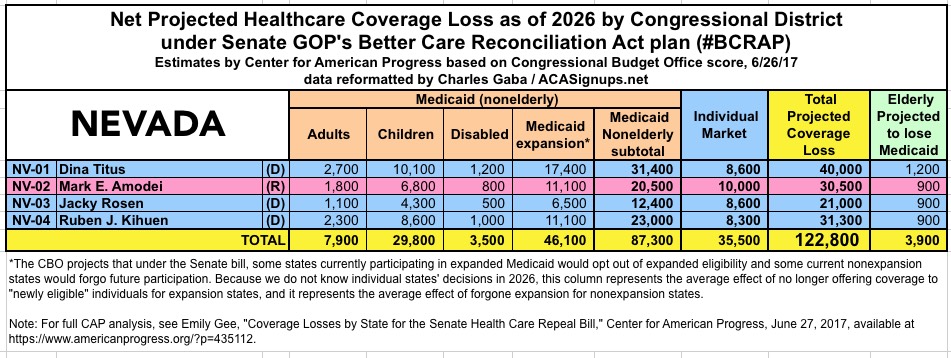
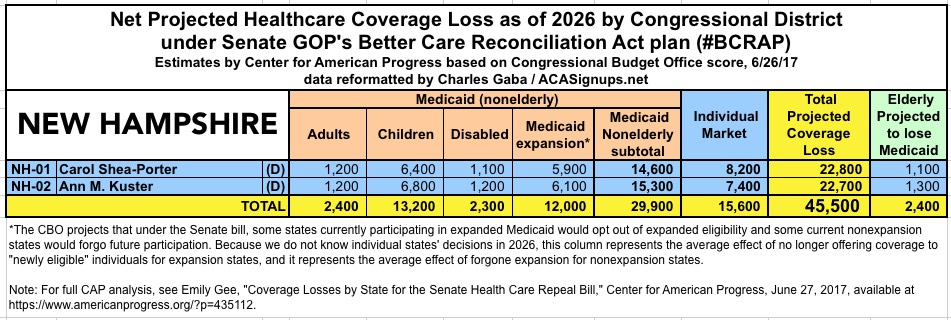
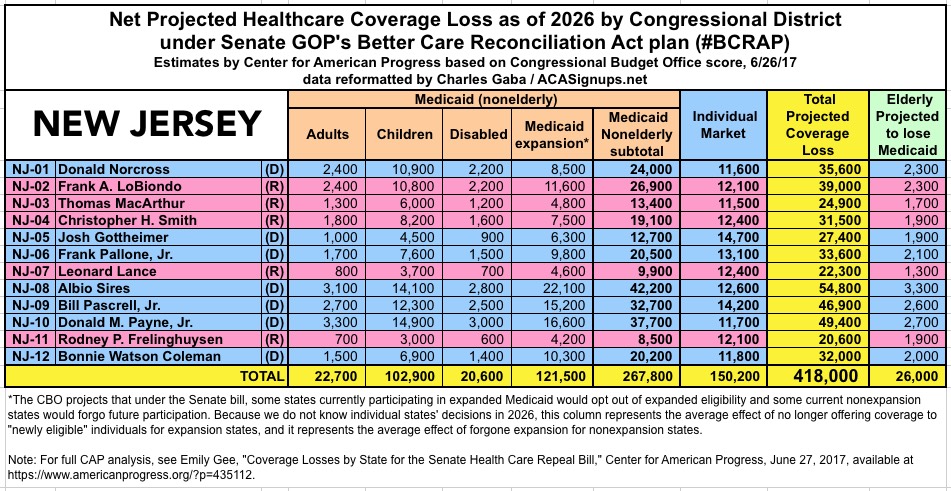
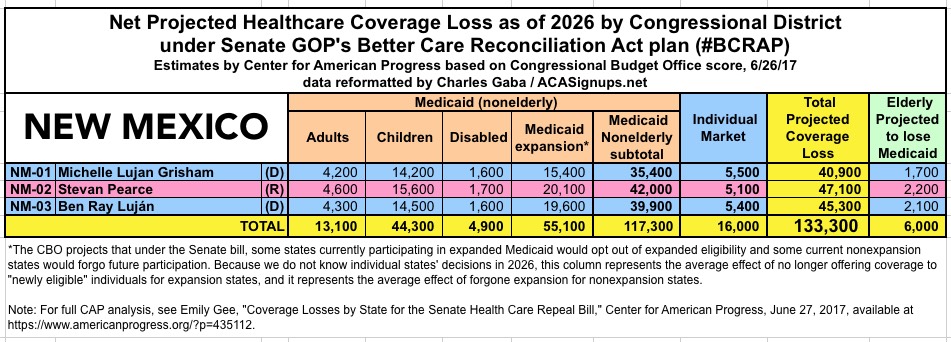
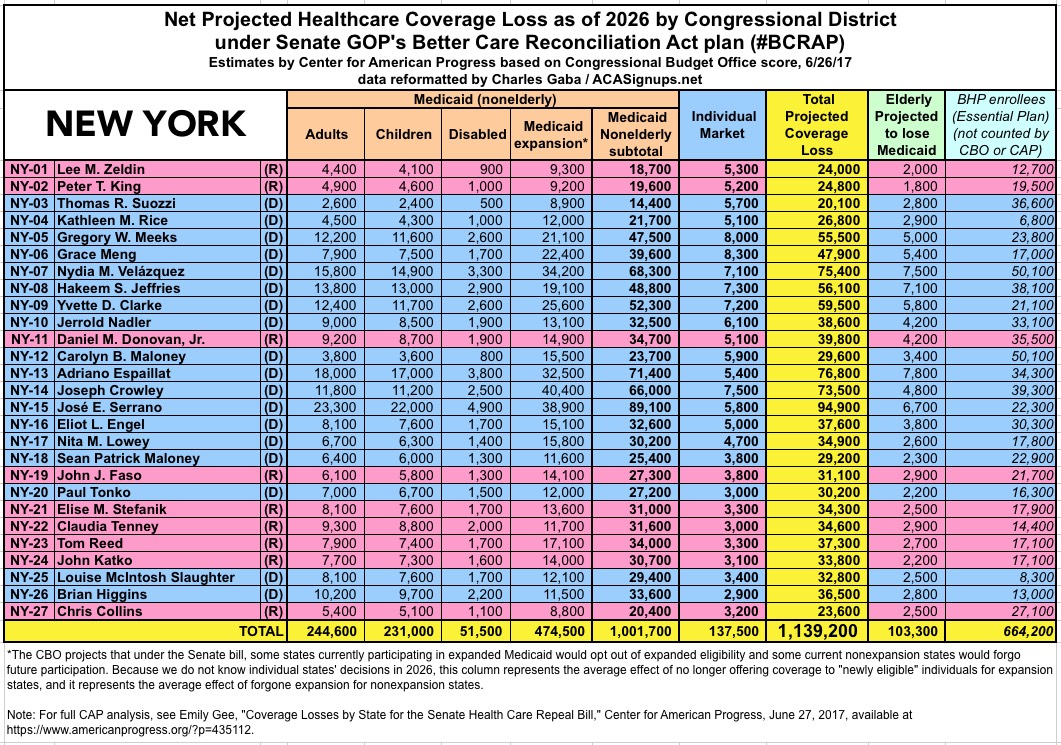
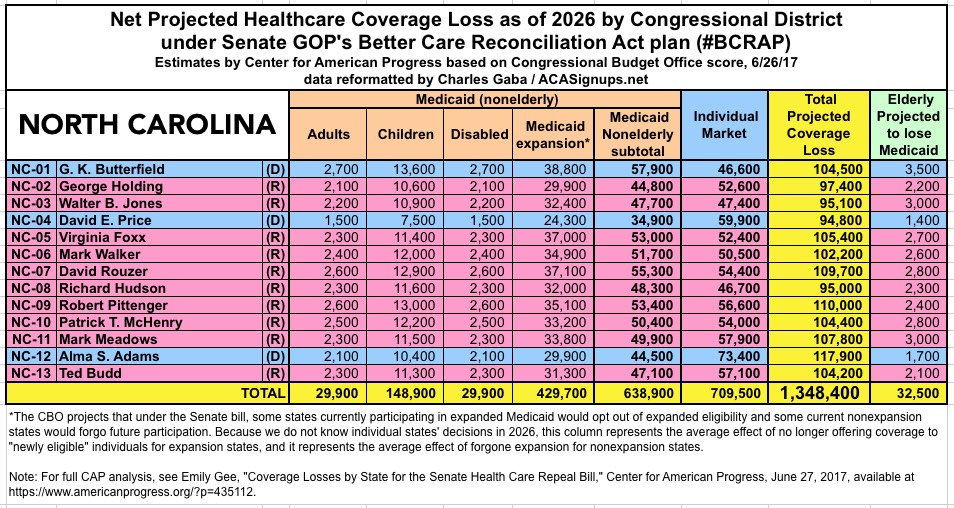
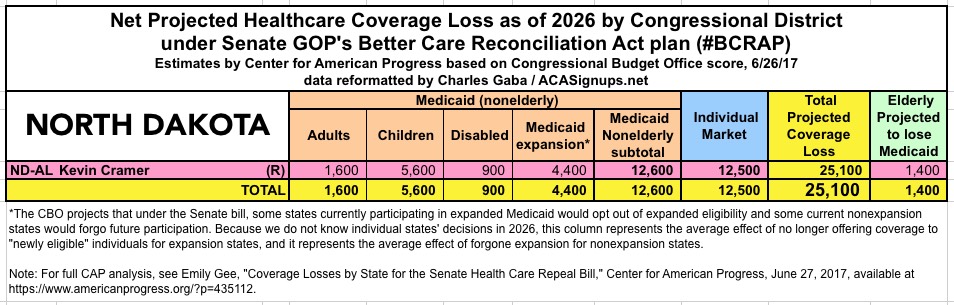
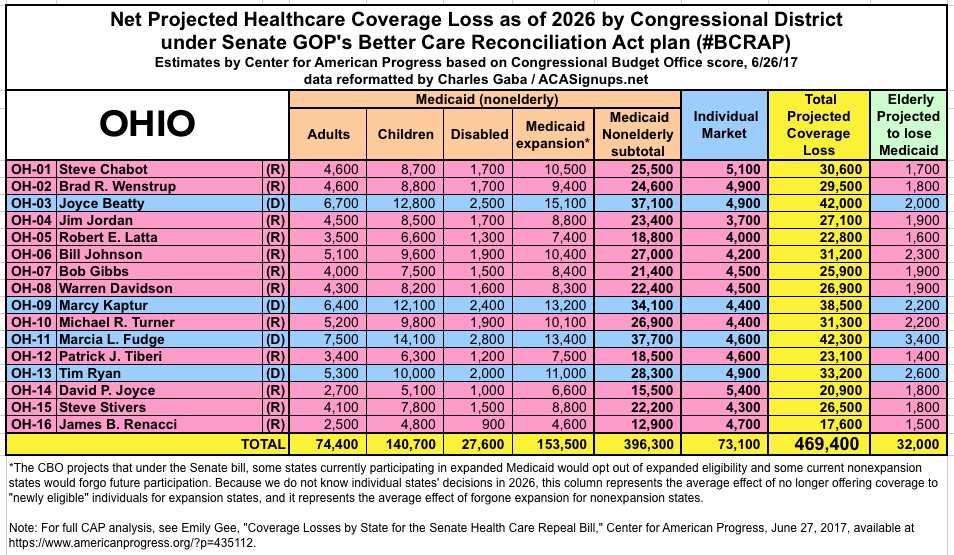
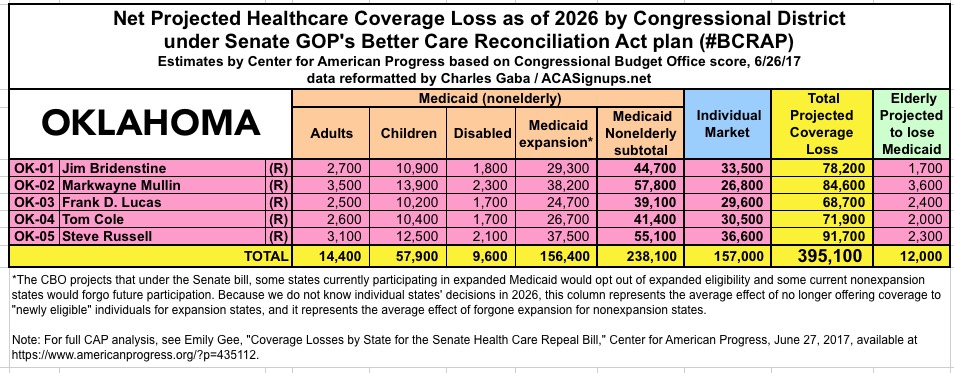
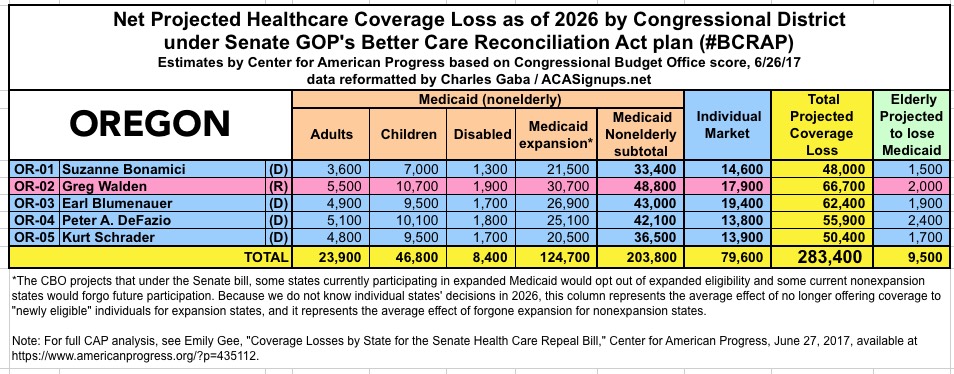
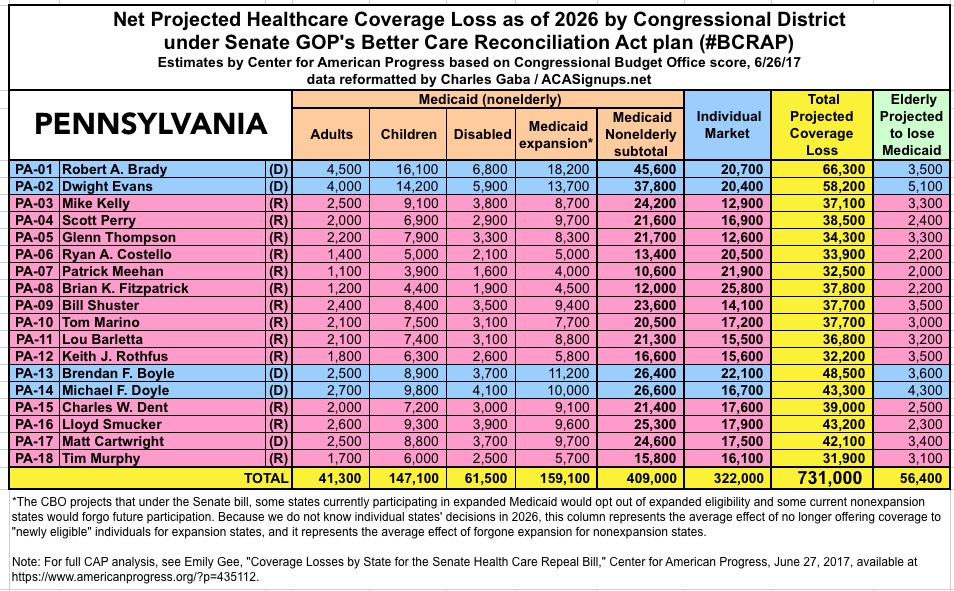
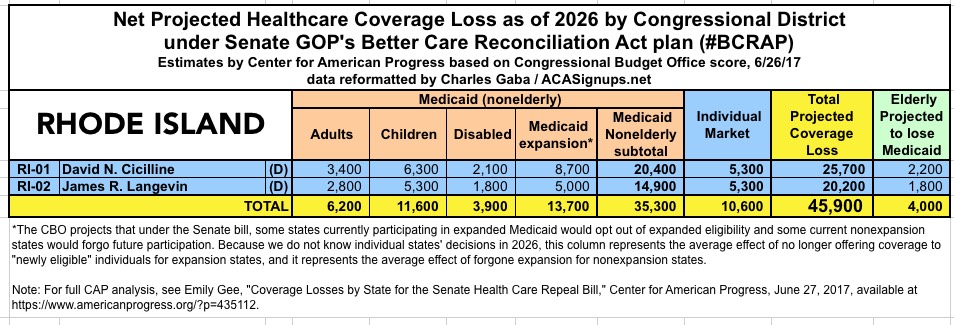
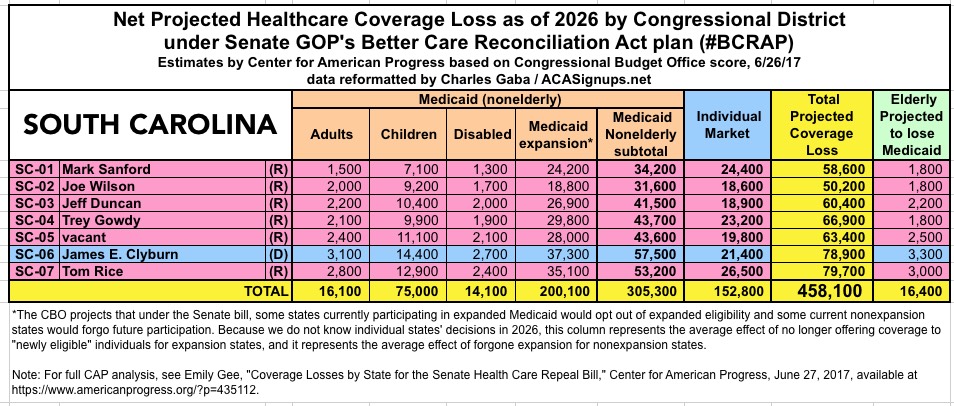
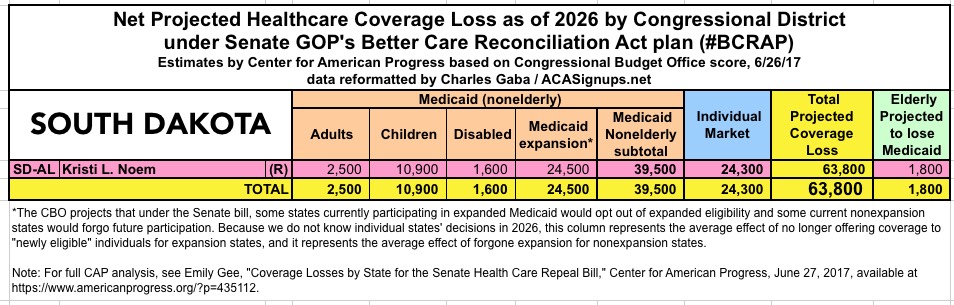
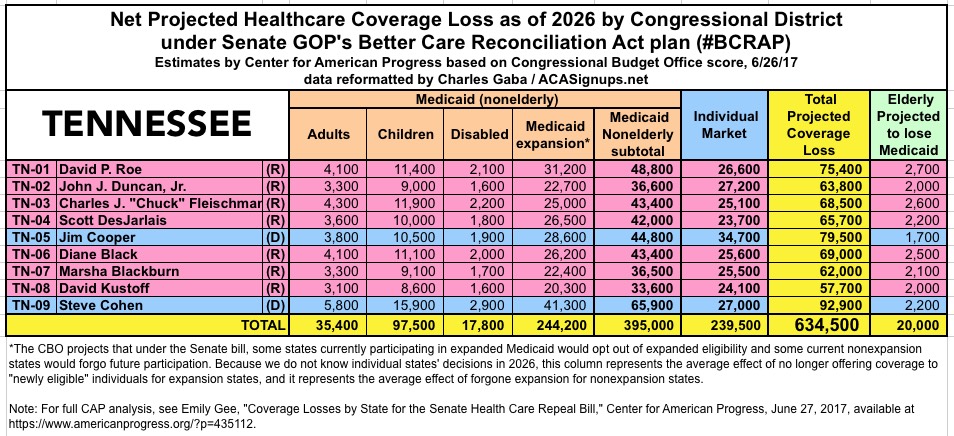
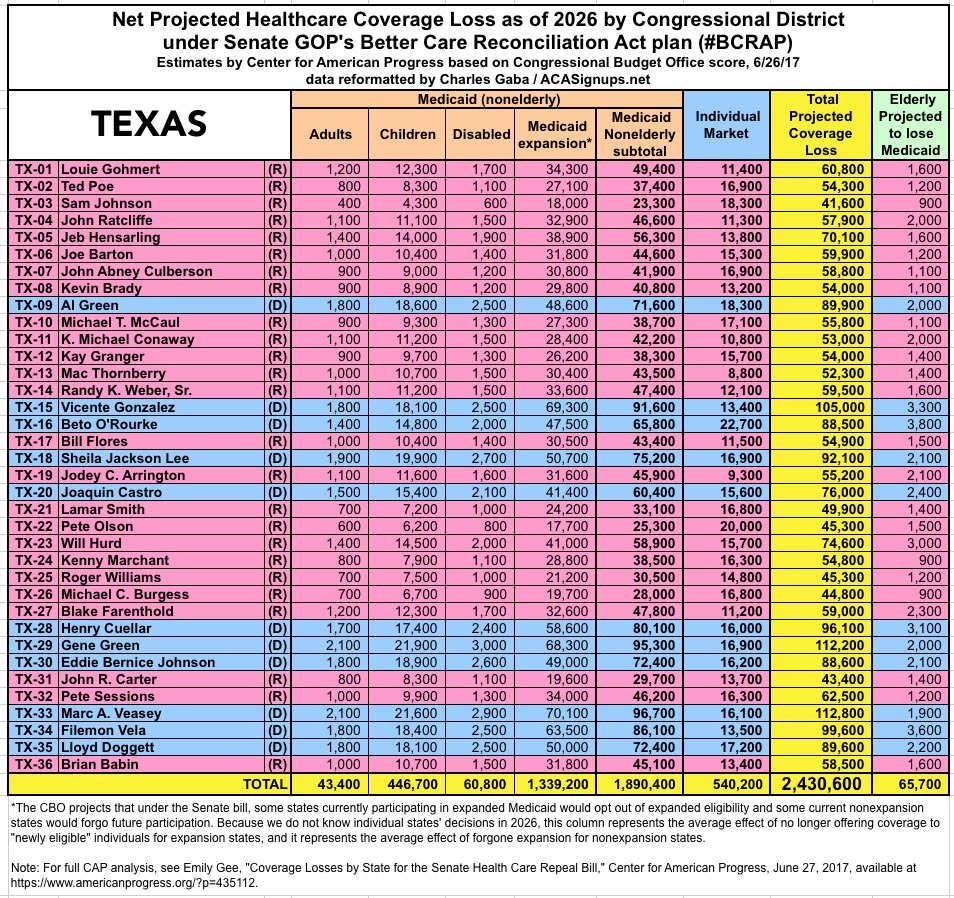
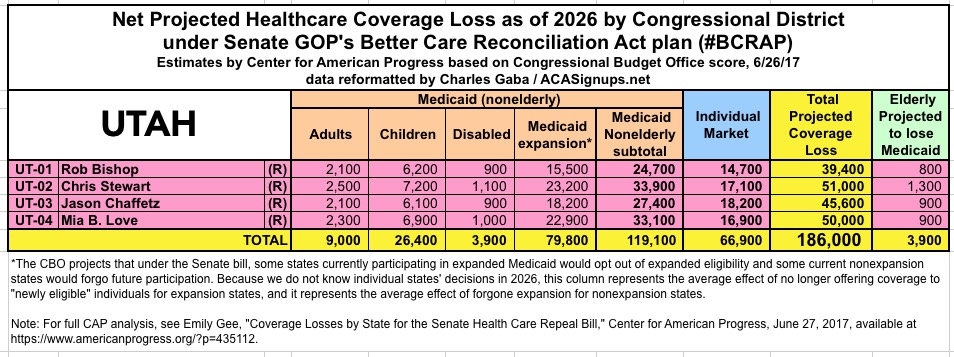
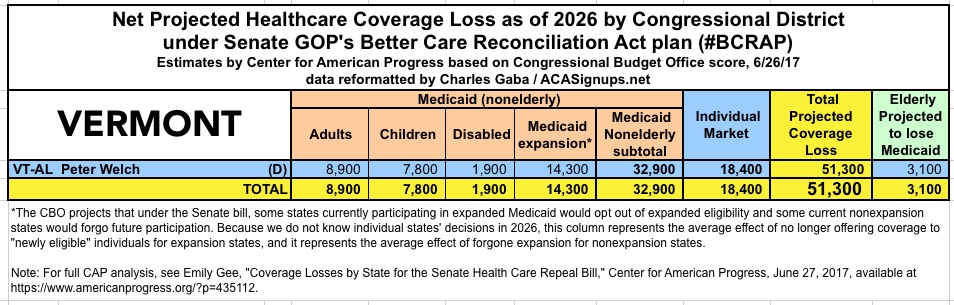
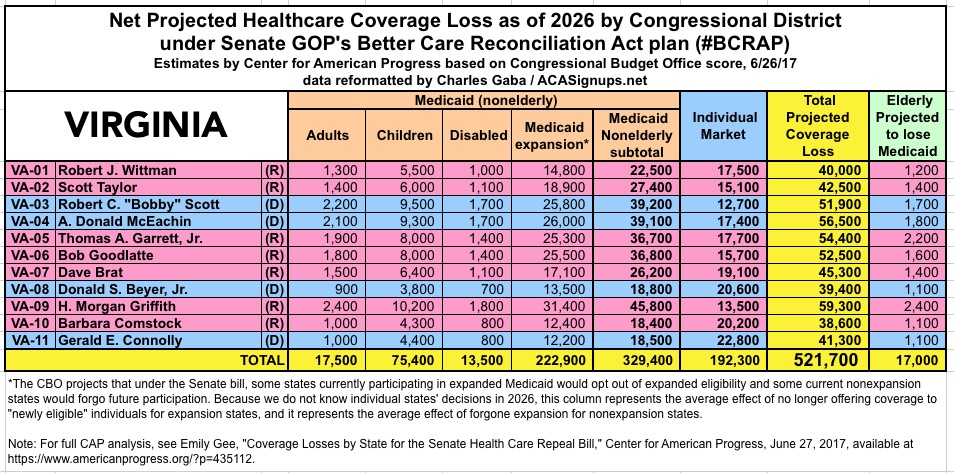
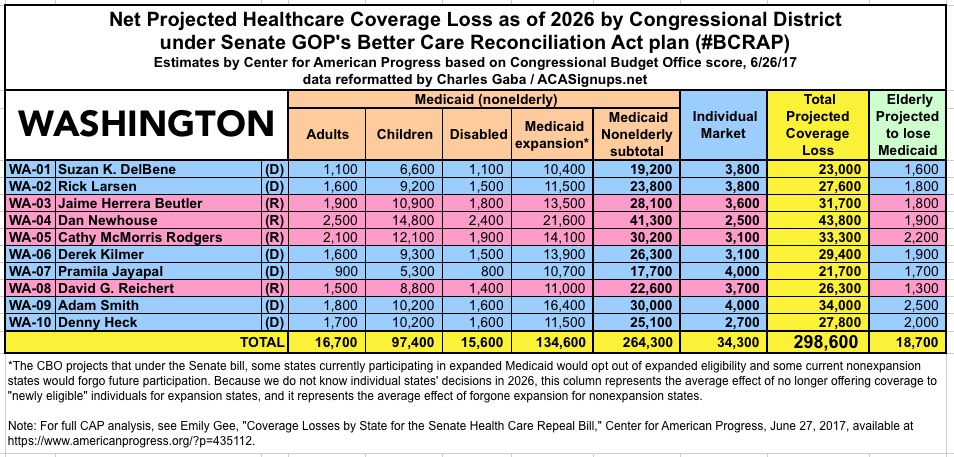
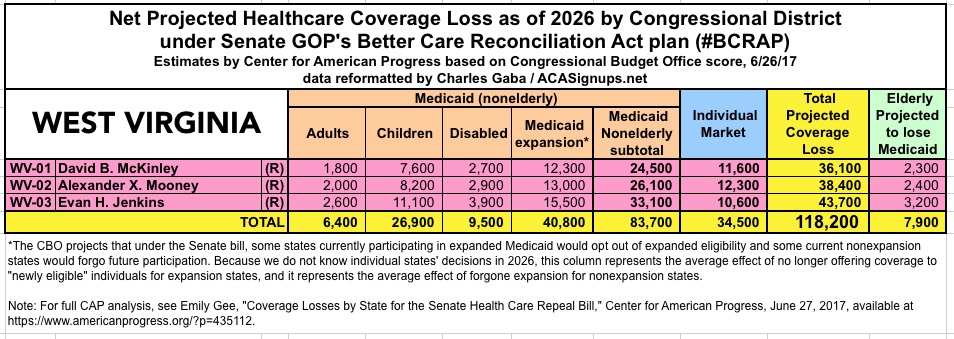
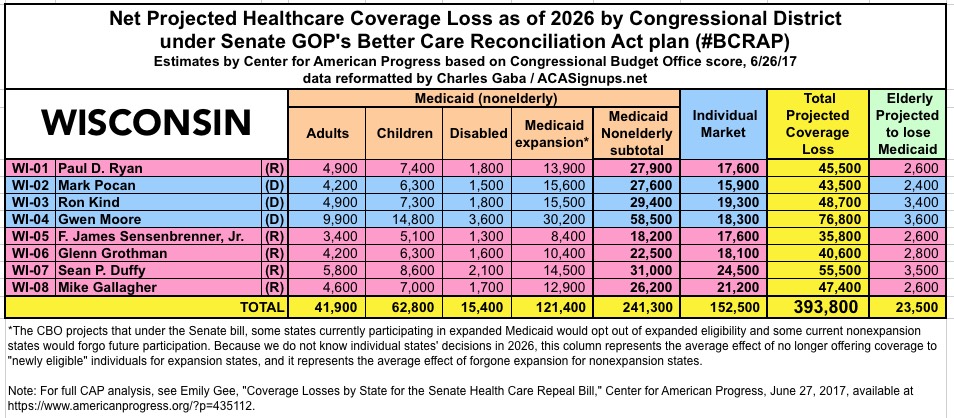
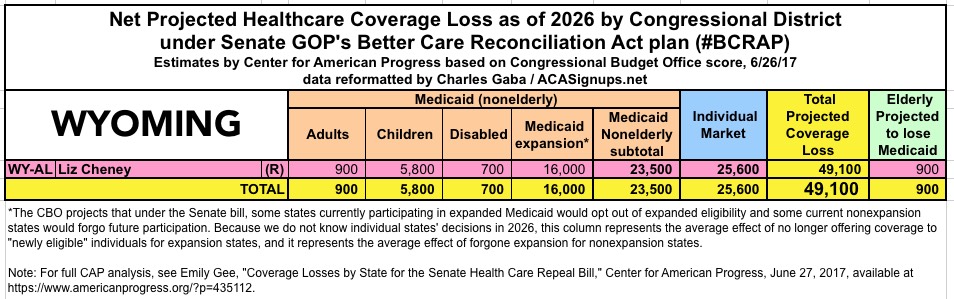
The Center for American Progress has put together their own state-based and Congressional-District-based breakout of the latest score by the CBO of the Republican Senate's "BCRAP" healthcare bill.
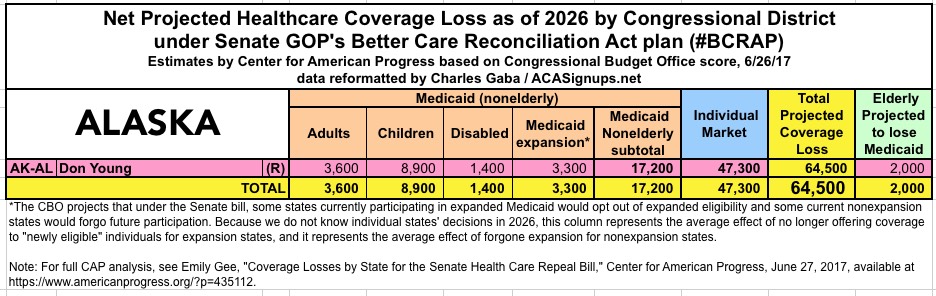
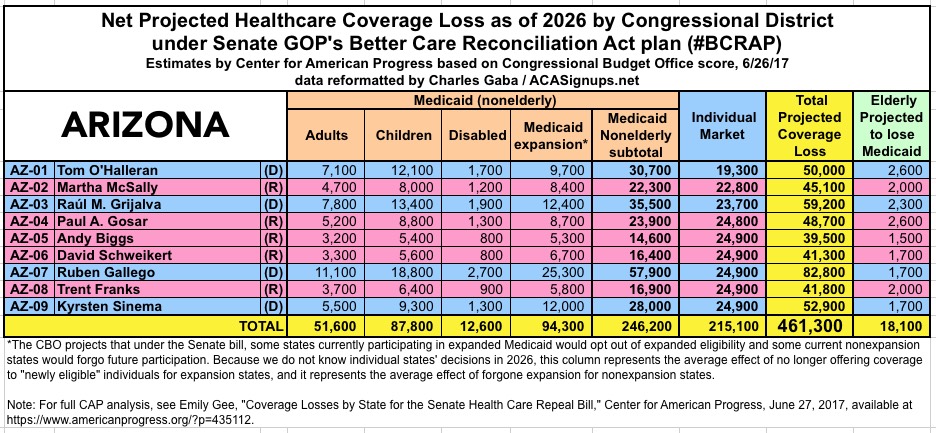
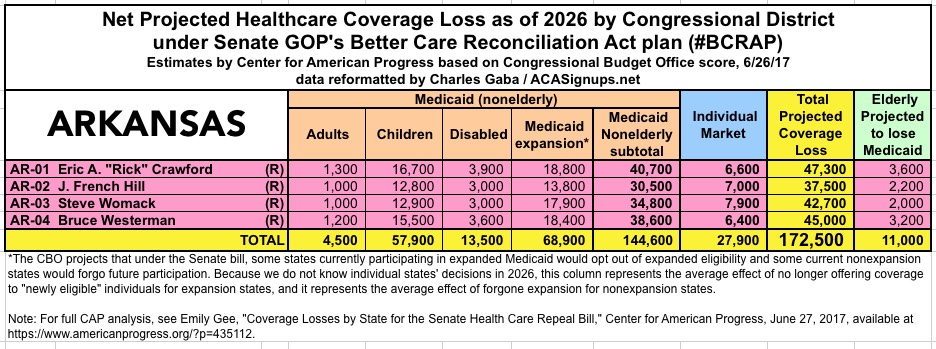
They've once again taken the CBO's total estimates for net coverage losses as of 2026 (15 million nonelderly people losing Medicaid, 7 million losing individual market coverage) and done their best to break that 22 million total out by state, district and even the type of Medicaid coverage (Adults, Children, the disabled and ACA expansion), along with the million or so elderly Medicaid enrollees who would likely lose partial coverage (they'd still have Medicare but lose Medicaid). I'm once again taking their raw data and reformatting/color coding it into individual state-level infographics, suitable for sharing via social media.
On the one hand, the timing of this is a bit ironic, since Mitch McConnell just announced that he's delaying the Senate BCRAP vote for another week or two (giving him more time to screw around with the bill to make it either less horrible or more horrible, depending on whether he's going after hardline conservatives or so-called "moderates"). That means even these estimates could be outdated by the time I'm done compiling the graphics...but I'm doing so anyway, to make sure that people have the most up-to-date projections available.
Here's the state-by-state breakout; the individual state/district tables will added as quickly as I'm able to put them together...

Advertisement
