

How much more will #ACASabotage cost unsubsidized enrollees in YOUR Congressional District?
Mon, 08/06/2018 - 1:00am
HERE WE GO AGAIN...
As regular readers know, each year I analyze hundreds of insurance carrier rate filings for the following year, then crunch the numbers to get an estimate of how much average premiums will increase (or in a few cases, decrease!) statewide.
As they also know, last year and again this year I've expanded on this by breaking out the portion of the annual rate increase which can be tied directly to sabotage efforts by the Trump Administration and Congressional Republicans. For 2018, this boiled down to roughly 17 points of the total nationwide increase being sabotage-related. It varied greatly by state, carrier and plan, but nationally, I estimated that without last year's ACA sabotage efforts, average premiums would have gone up around 11% instead of around 28%.
For 2019, I've competed analyzing the actual preliminary rate filings for all 50 states (+DC), and it looks like average rates are "only" increasing by about 5.4% nationally. This may sound like good news, but if it weren't for the latest round of sabotage efforts by Trump/the GOP (mainly repeal of the Individual Mandate and expansion of Short-Term and Association Plans), I estimate that average 2019 premiums would be dropping around 3.6%.
Since this can cause confusion, I've therefore also started reporting the actual dollar impact that ACA Sabotage will have on unsubsidized enrollees next year. This is more relatable to most people anyway, since it reveals the actual impact on the enrollees' wallets.
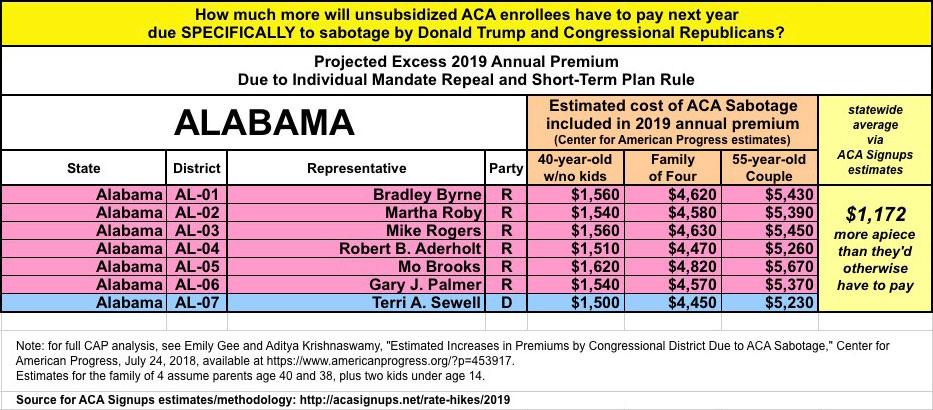
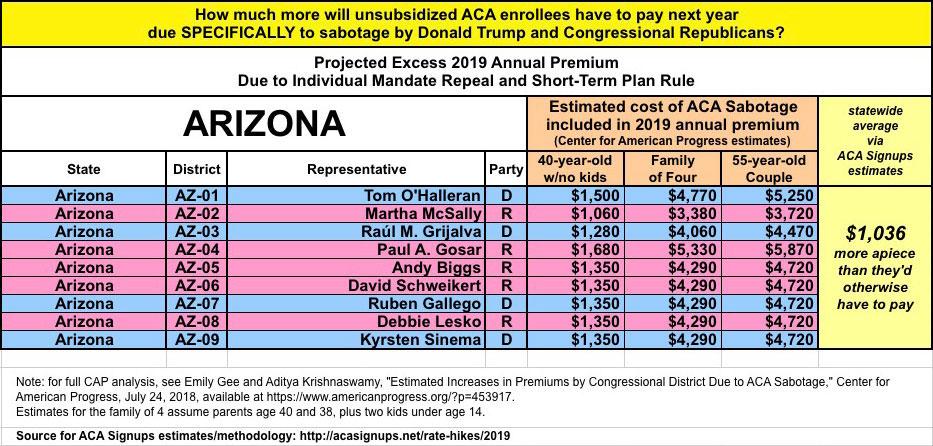
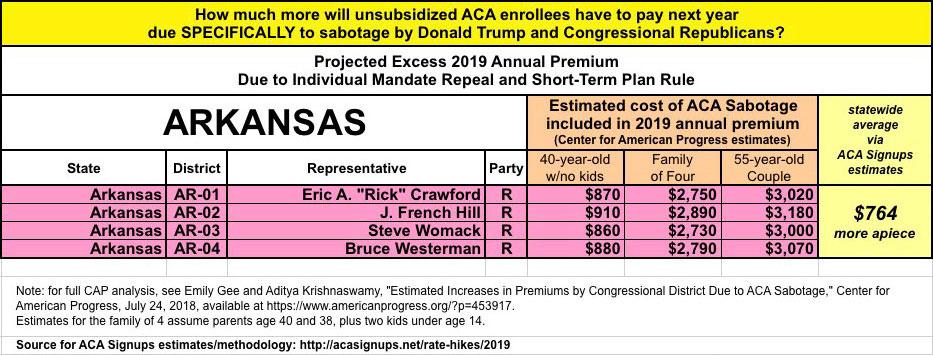
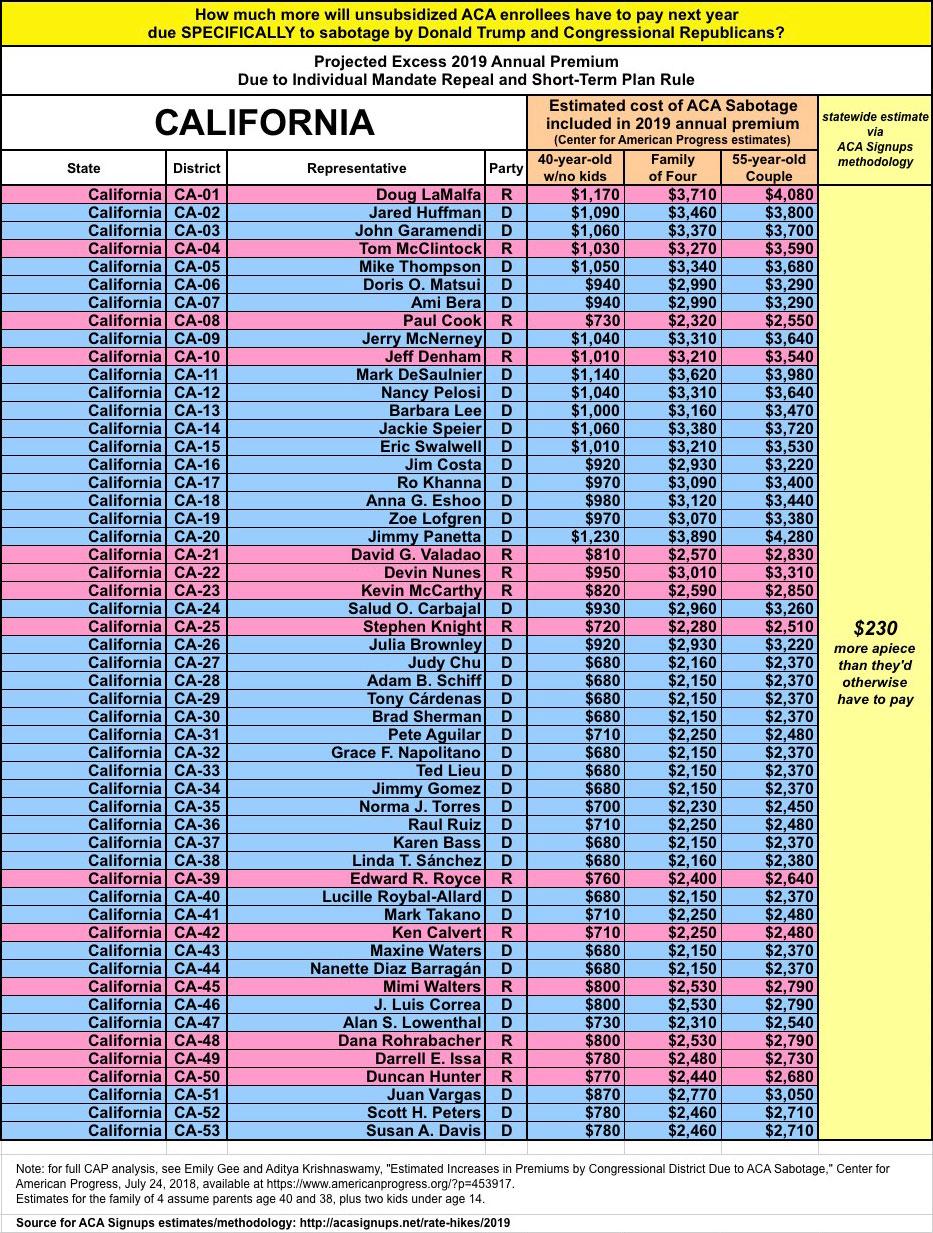
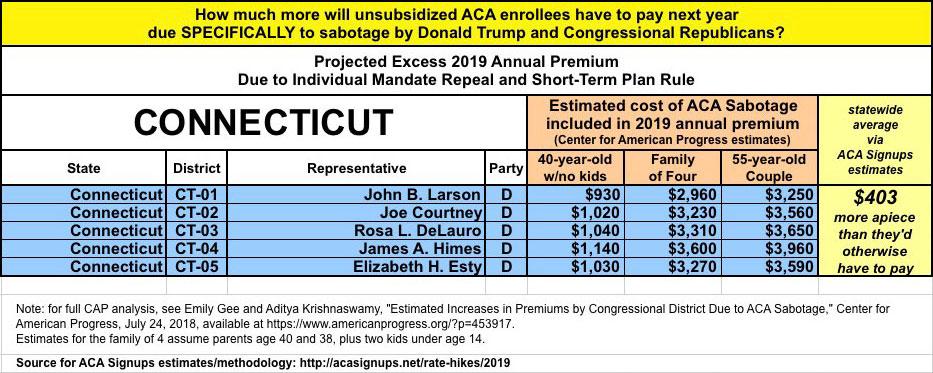
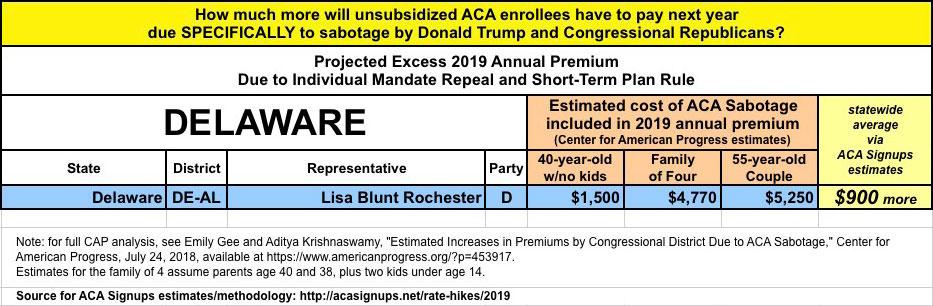
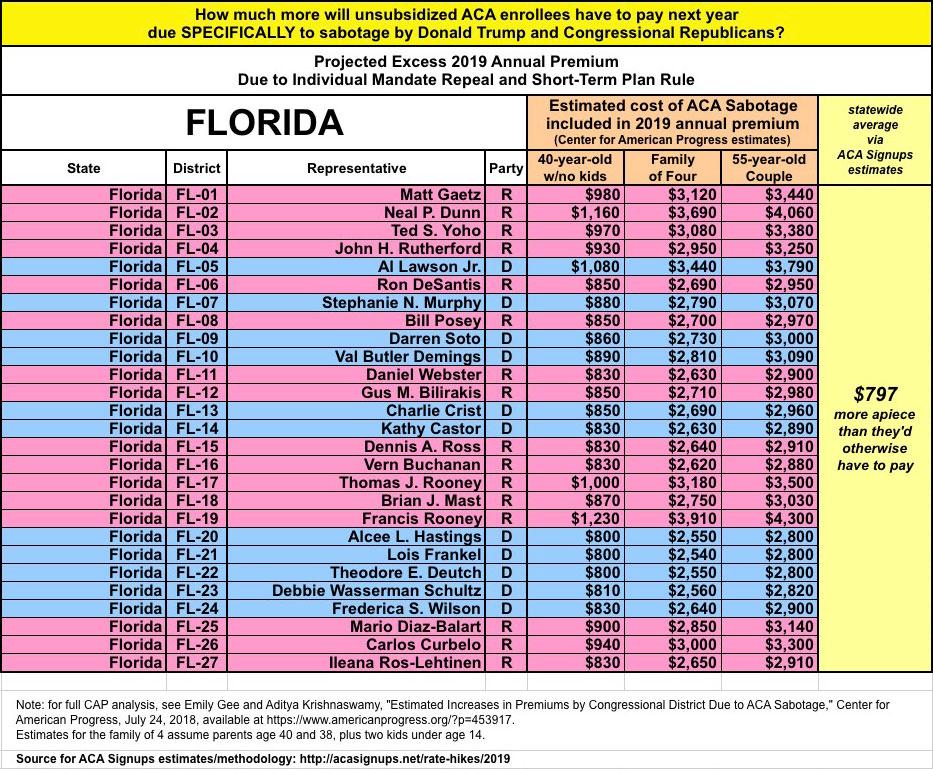
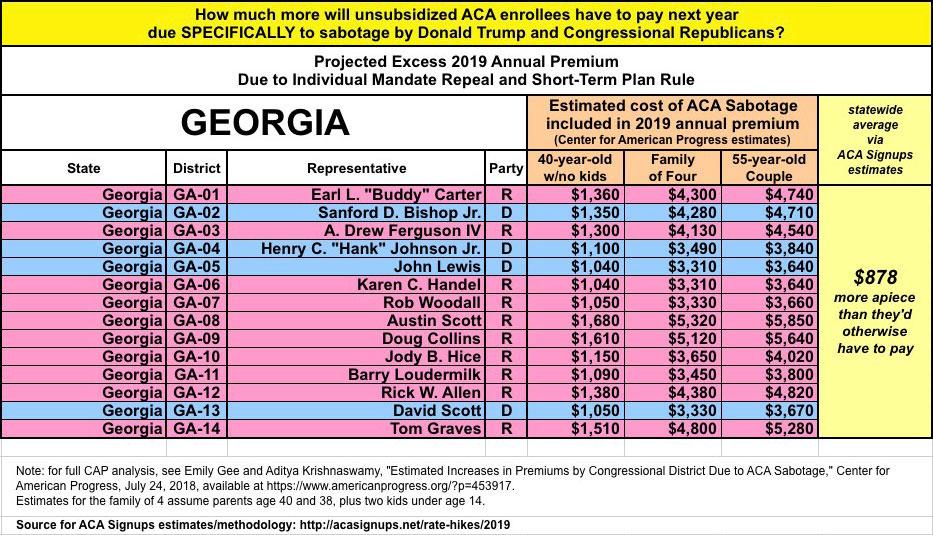
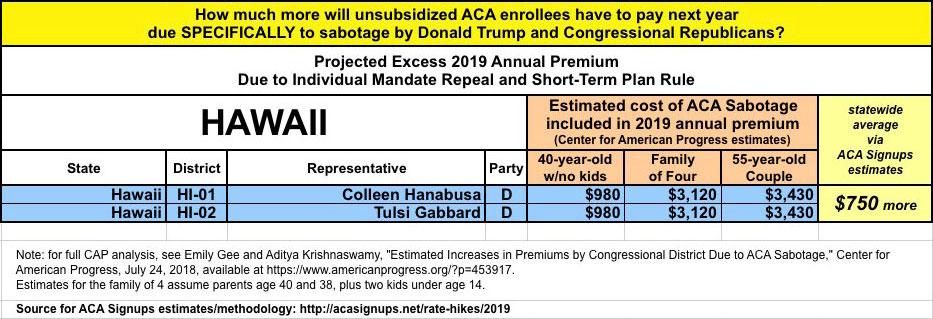
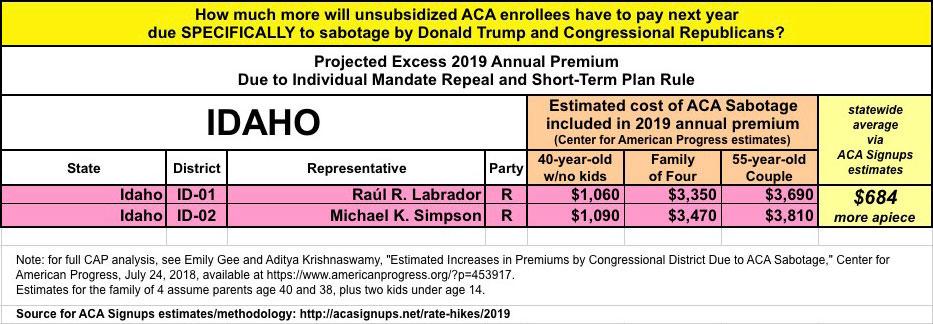
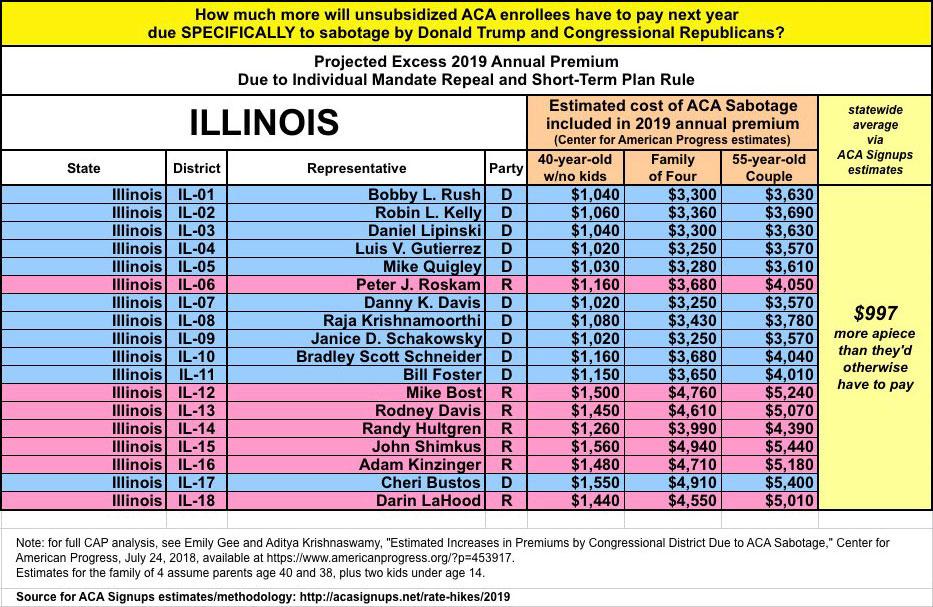
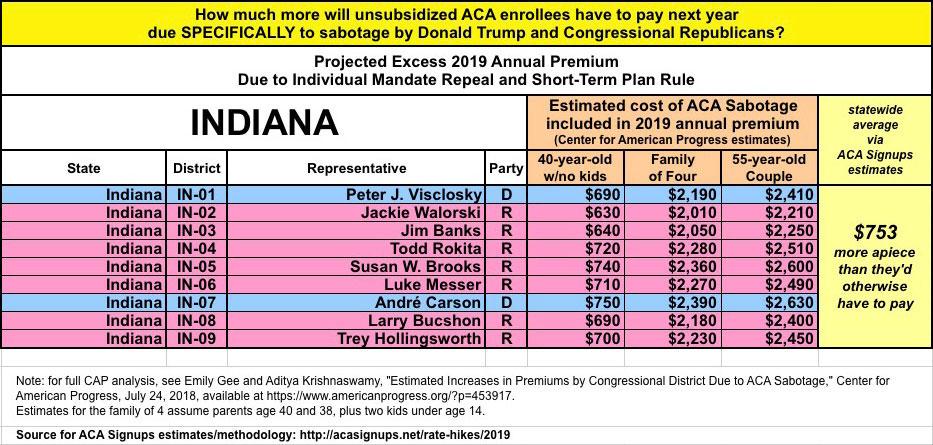
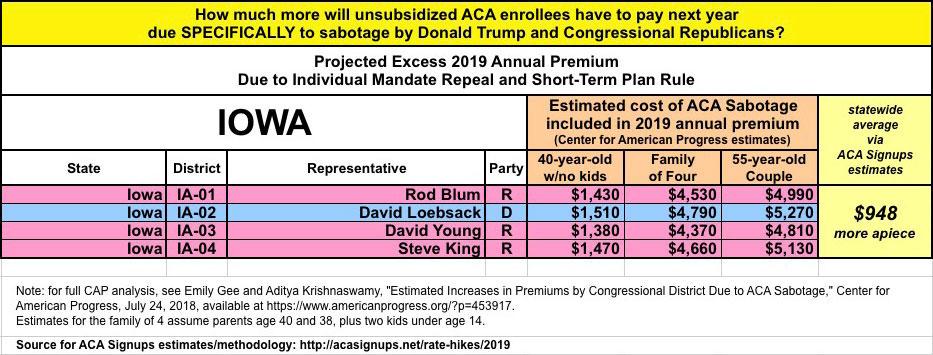
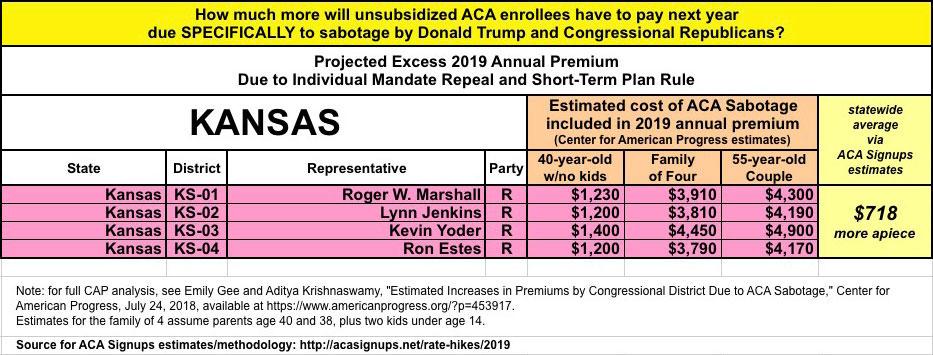
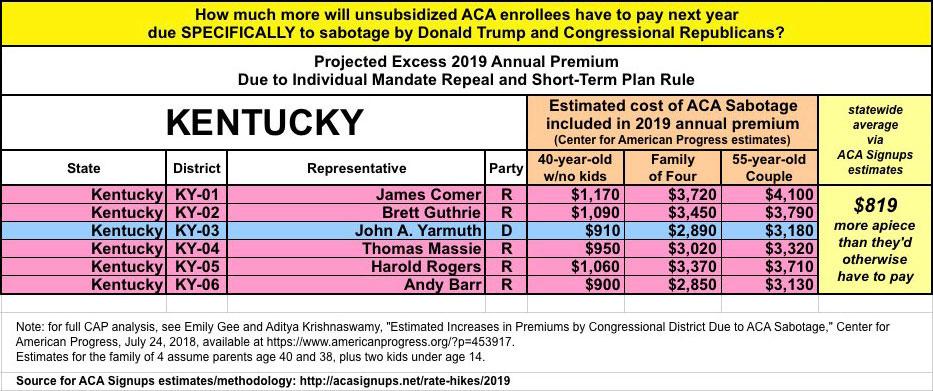
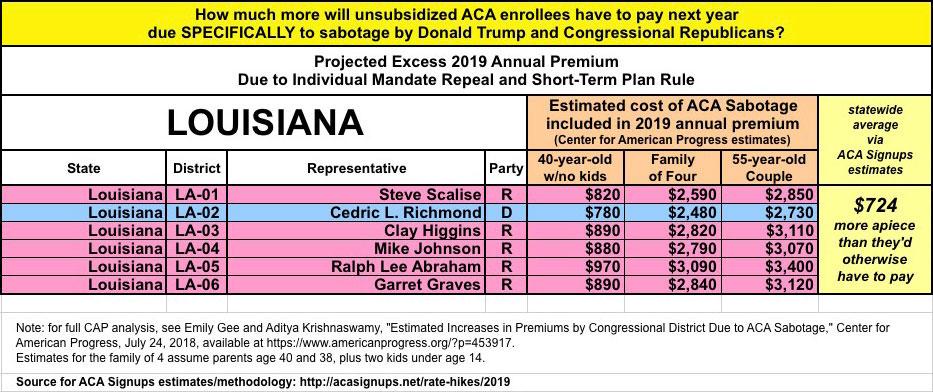
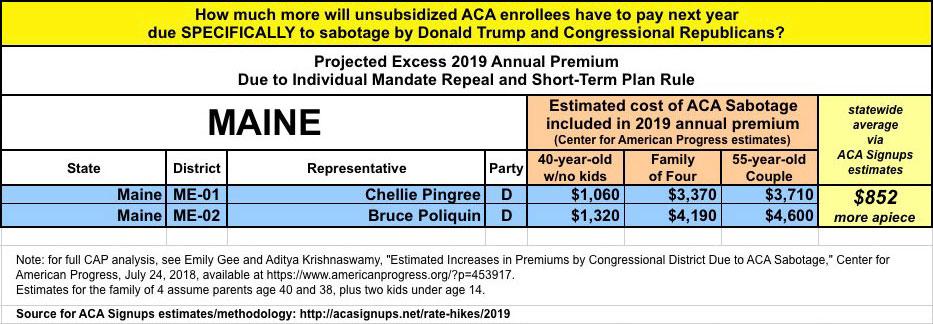
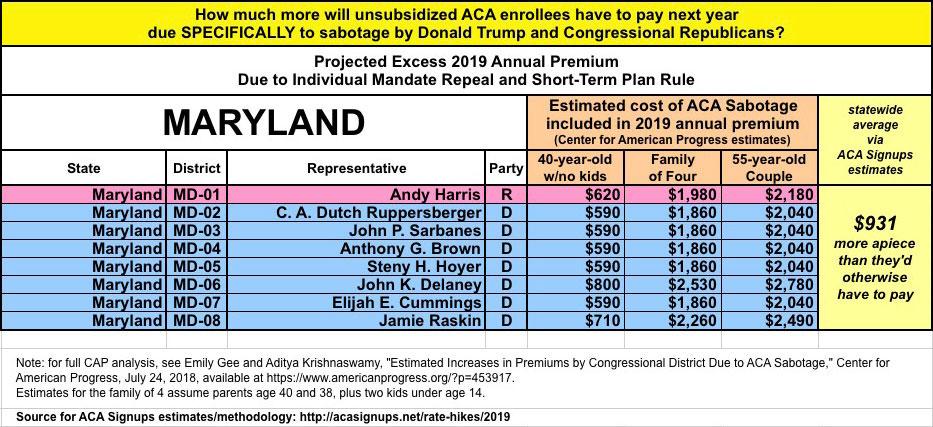
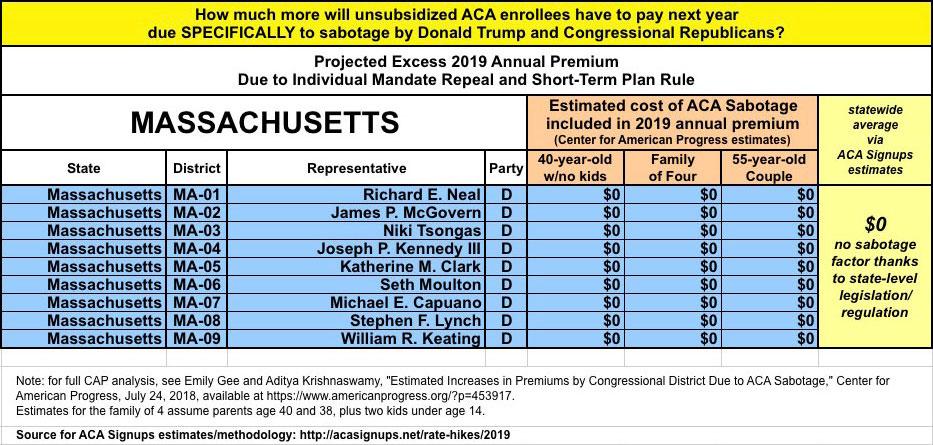
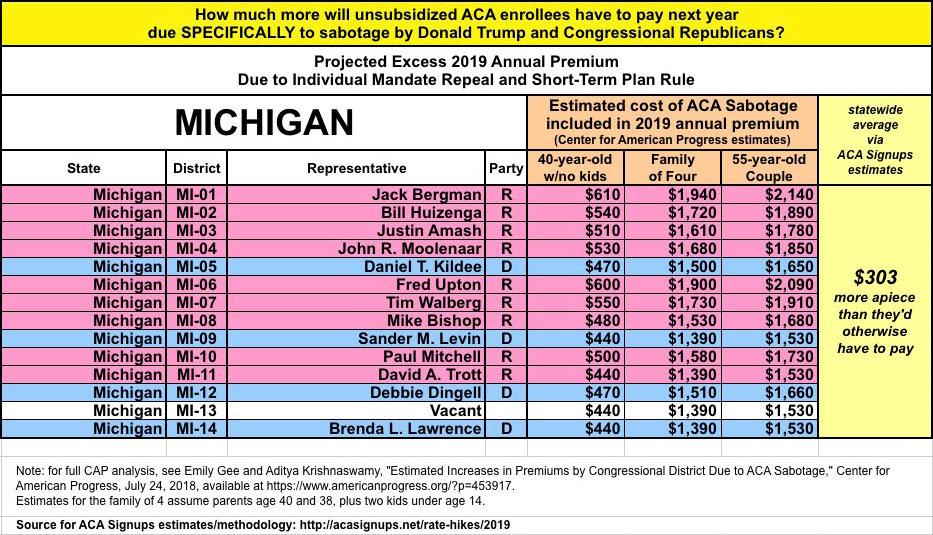
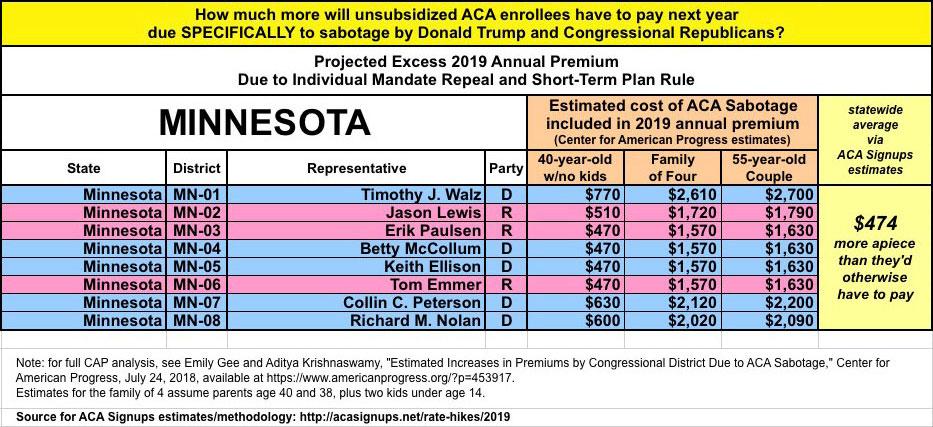
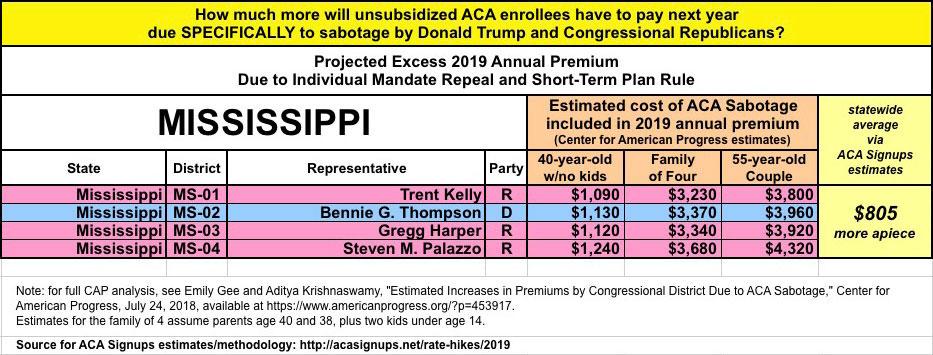
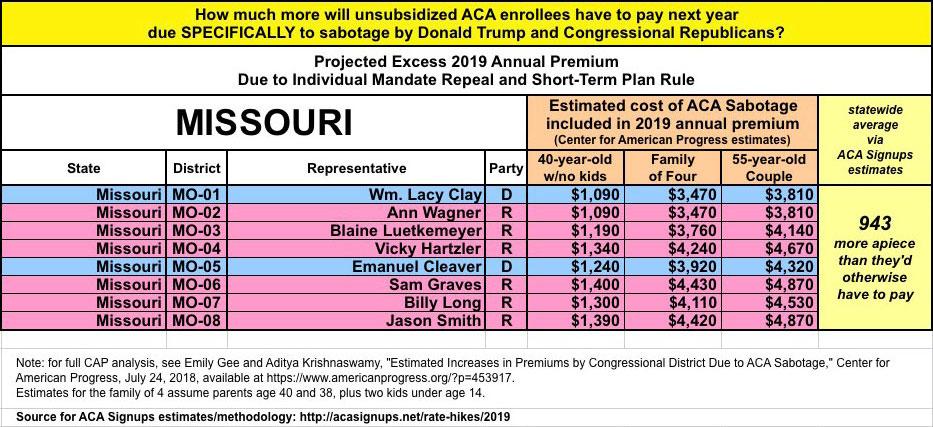
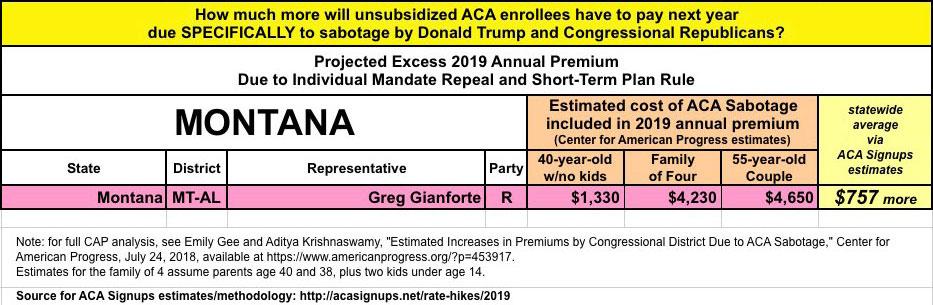
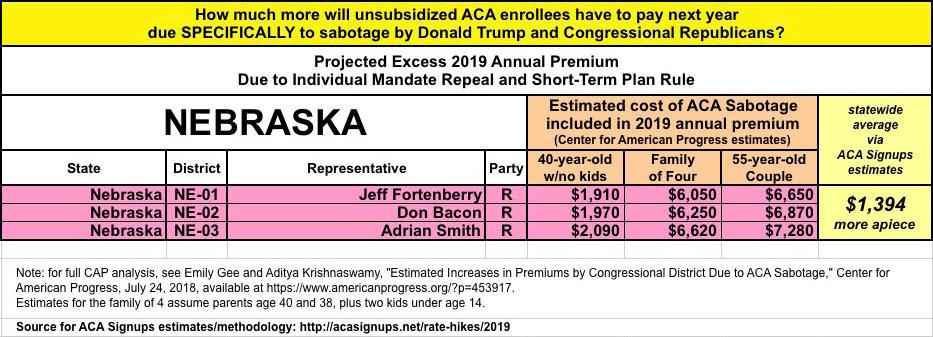
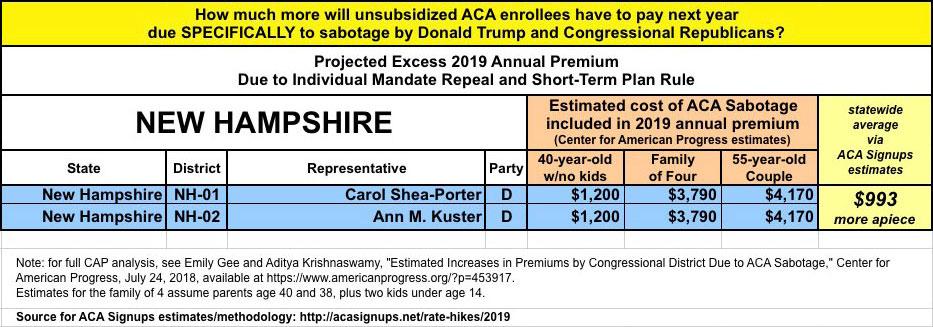
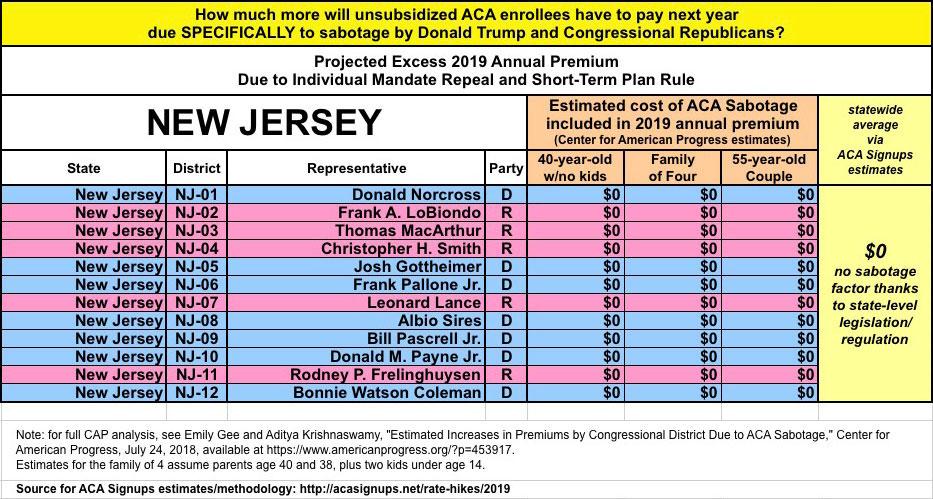
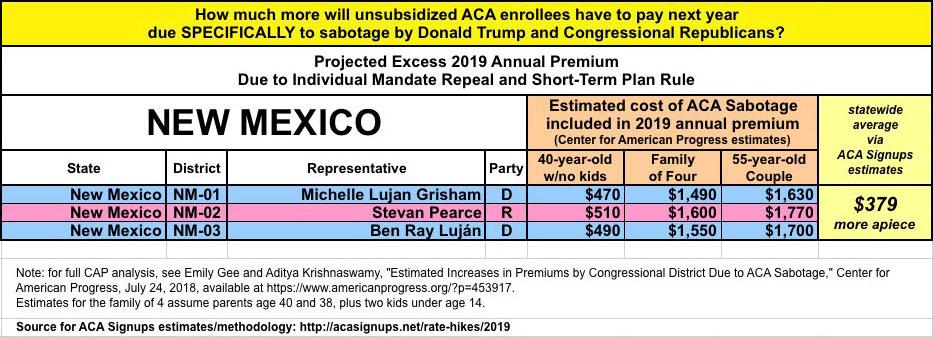
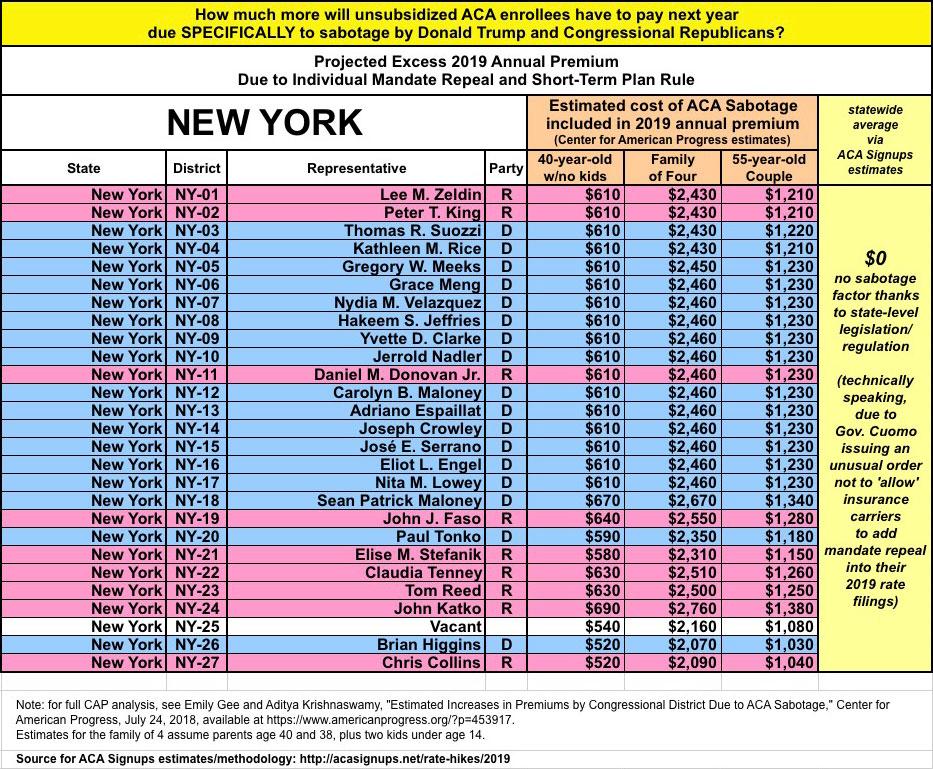
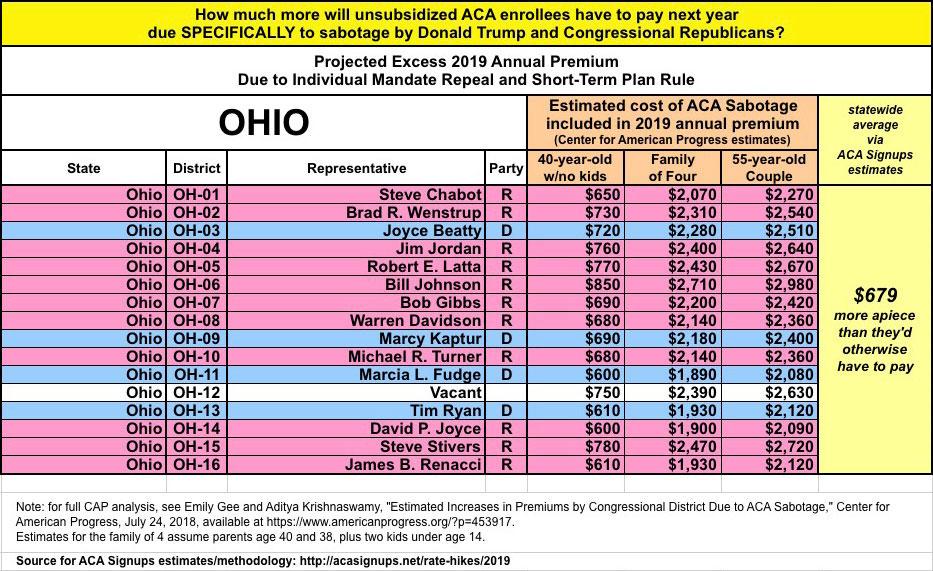
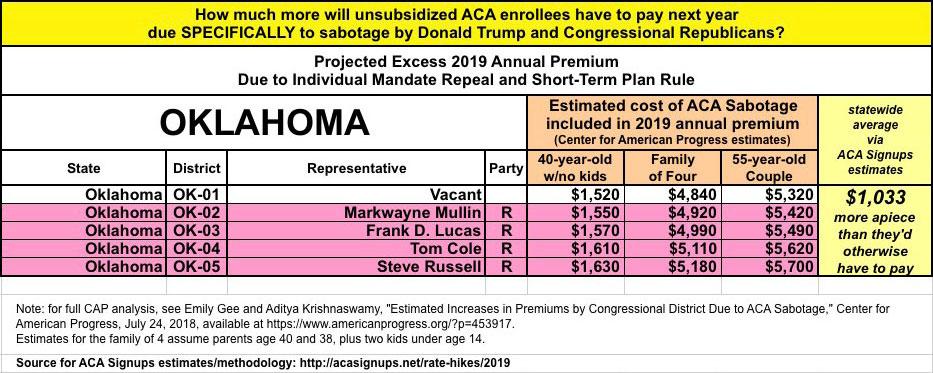
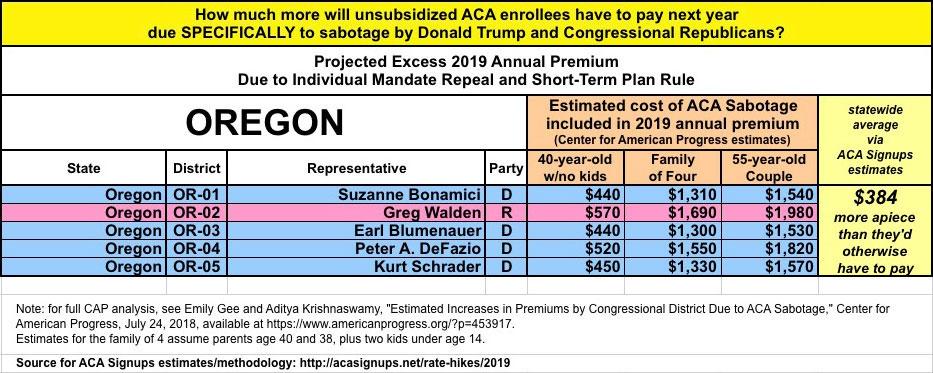
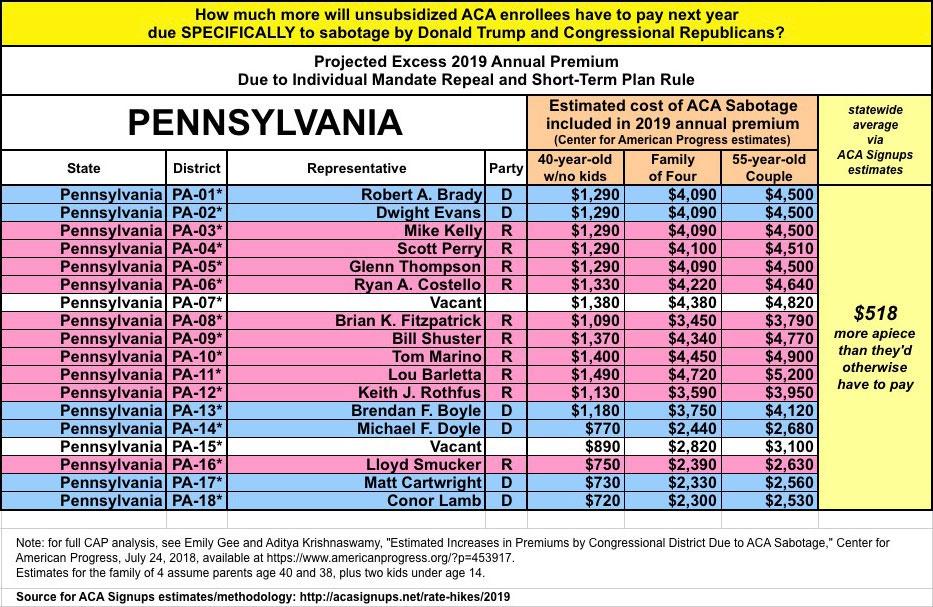
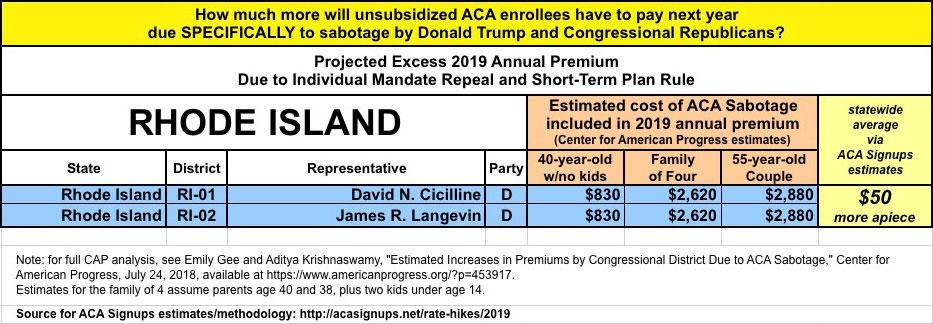
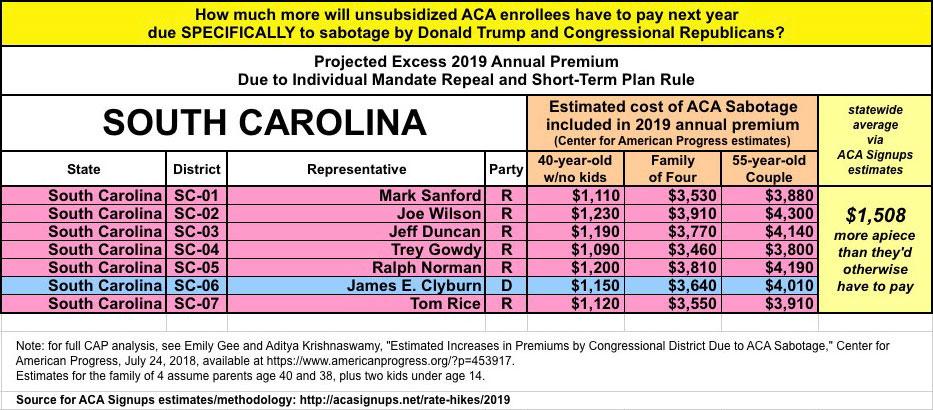
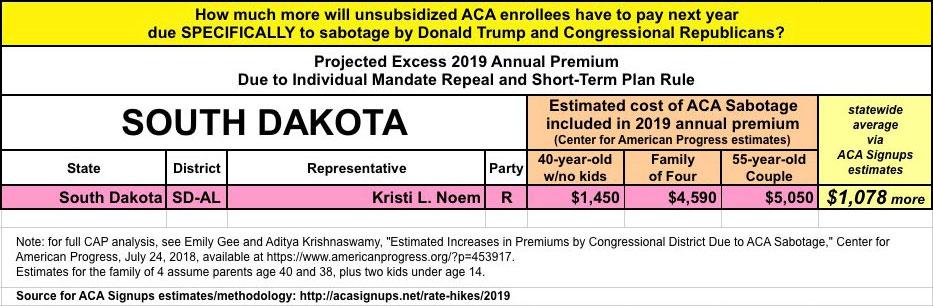
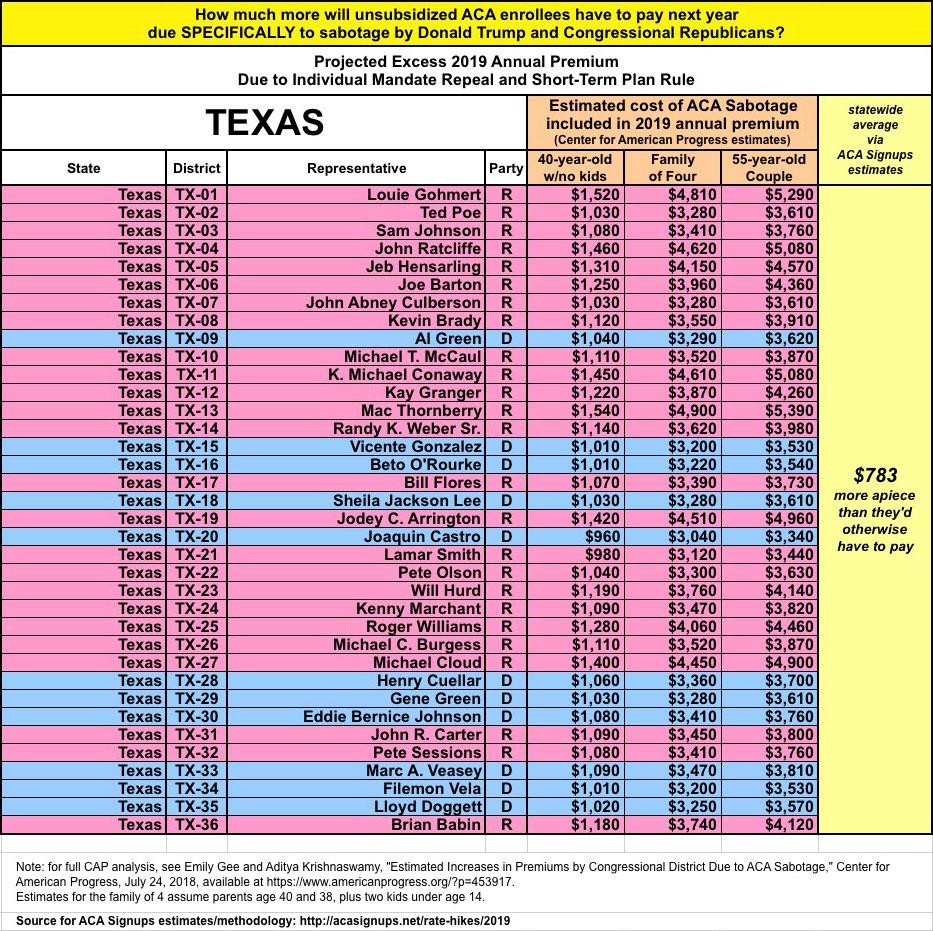
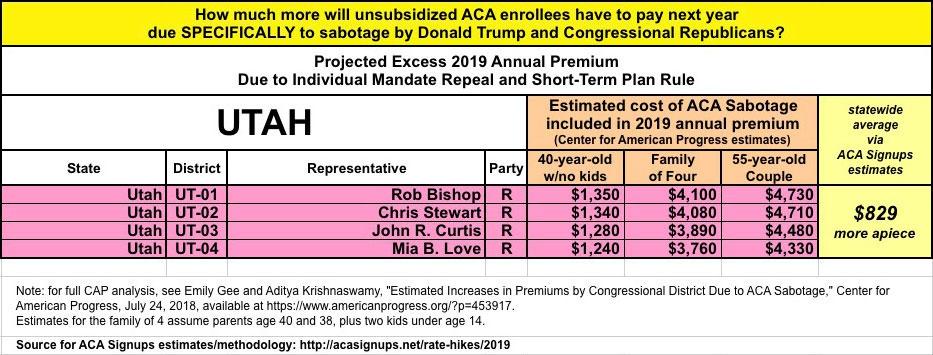
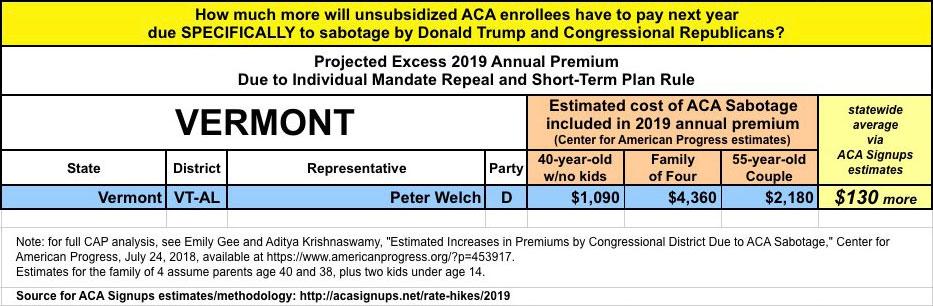
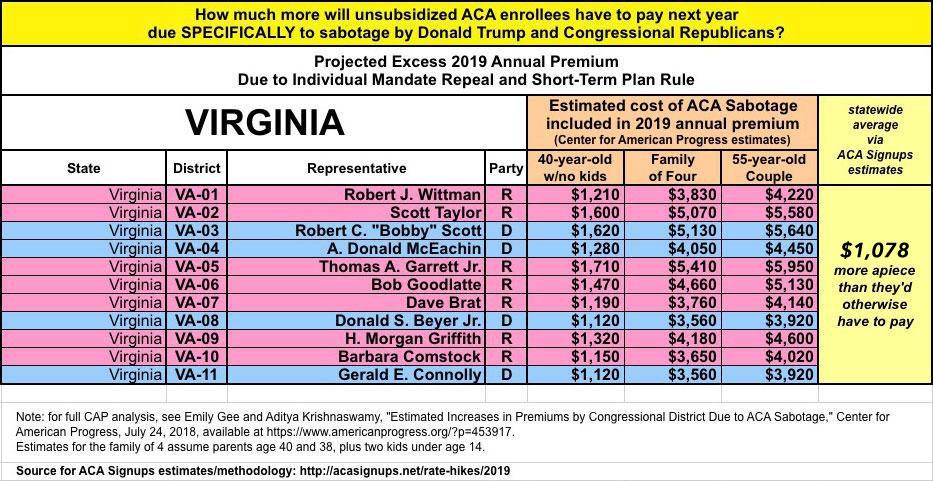
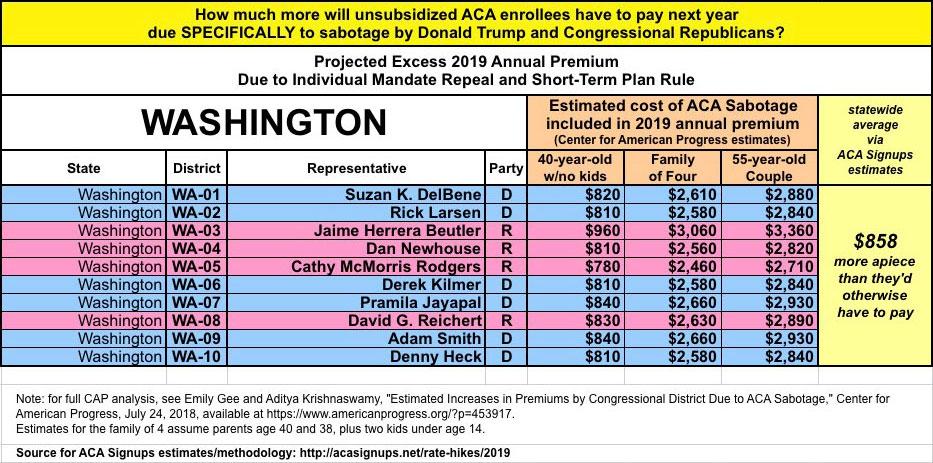
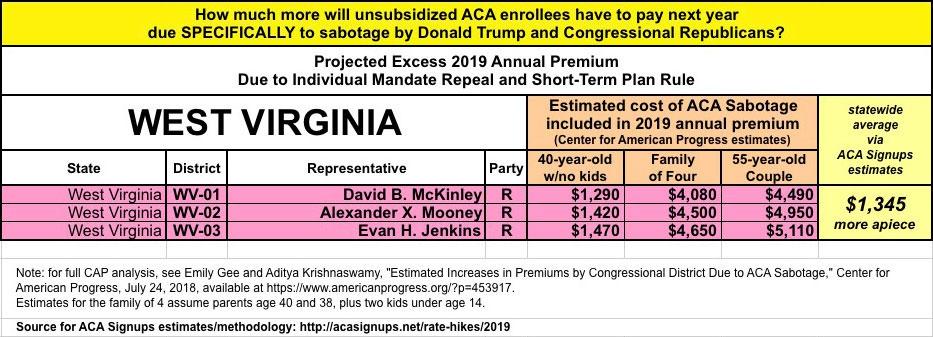
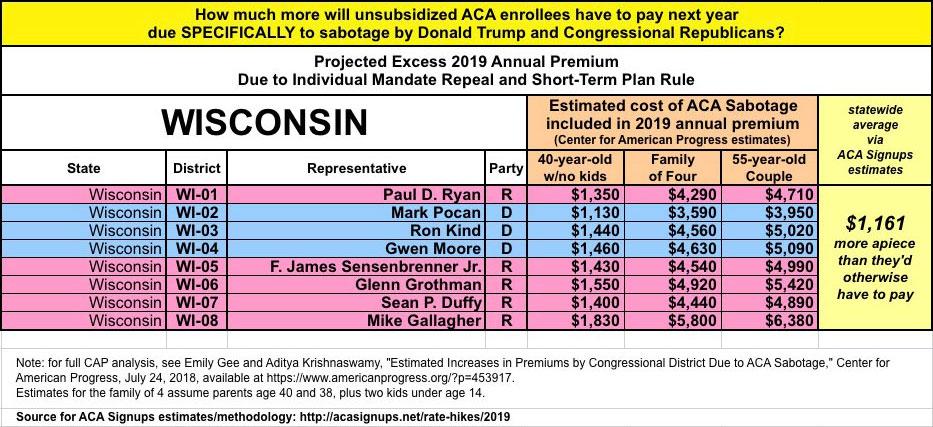
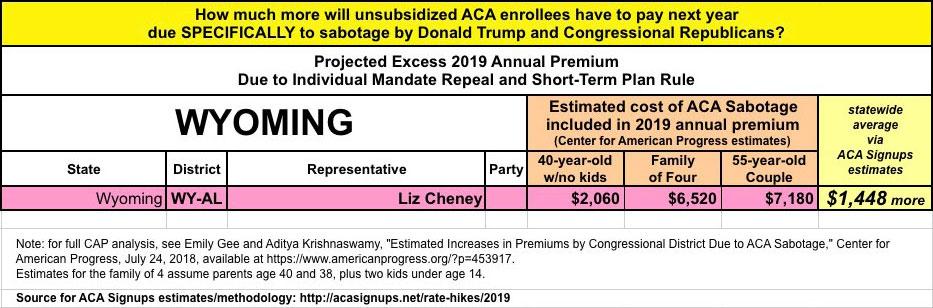
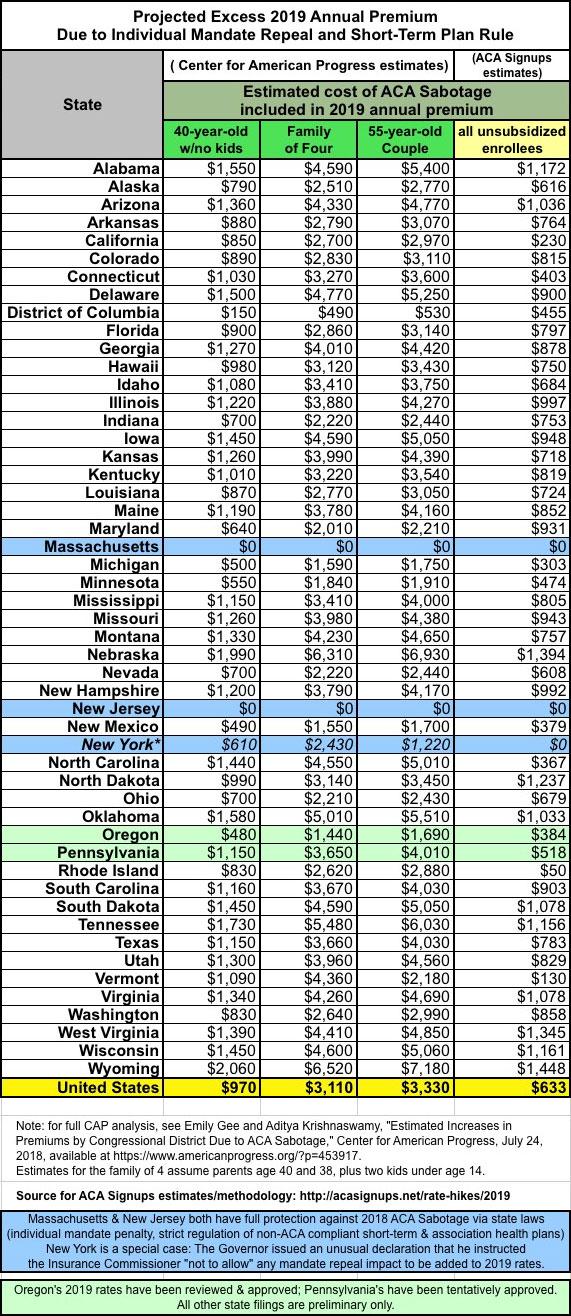
Recently the left-leaning Center for American Progress (CAP) took my ball and ran with it by running their own "sabotage impact" analysis, but they took it a step further by breaking their estimates out by Congressional District.
In addition to breaking it out by CD instead of the entire state, their methodology differs from mine in several important ways. For one thing, instead of an aggregate average increase for every individual market enrollee statewide, they look at three specific household examples: A single 40-year old adult with no children; a family of four; and a 55-year old couple.
In addition, while my own statewide estimates are based primarily on actual insurance carrier filings (which is why I'm missing 21 states at the moment) combined with Urban Institute projections from last March (which I then dropped by 1/3 to err on the side of caution), CAP is basing theirs on a combination of data and projections from the Kaiser Family Foundation, the American Community Survey, Covered California and the Urban Institute projections. As a result of all fo these variables, in most states my statewide average estimates vary from CAP's "household example" estimates, sometimes substantially.
With all that in mind, I've taken CAP's Congressional District-level spreadsheet and reformatted it into a more reader-friendly format, including which party each Representative is a member of. I've also added my own statewide dollar impact estimate on the right side.
Note that there will likely still be some modifications to the averages in some states as insurance department regulators review and tweak the approved rate changes. In particular, I wouldn't be surprised to see significant changes in Maine and Virginia (due to Medicaid expansion), Maryland and New Jersey (reinsurance program approval) and Tennessee (BCBS will likely refile now that the Risk Adjustment crisis has passed). However, aside from Tennessee, the first four wouldn't really change the sabotage impact, since Medicaid expansion and reinsurance programs are completely separate from #MandateRepeal and #ShortAssPlans impact.


Advertisement
