

CMS Effectuation Report, Part 2: "How Many Have Paid??" and Non-payment trends
Thu, 07/05/2018 - 10:05am
A few days ago, the Centers for Medicare & Medicaid released three important new reports on the 2018 Open Enrollment Period and trends in the individual market. There's a lot of data to go over, so I'm breaking my analysis into several smaller posts for easier readability.
Overview • Part One • Part Two • Part Three • Part Four
- Here's the link to the February 2018 Effectuation snapshot report.
- Here's the link to the report on Trends in Subsidized and Unsubsidized Enrollment
- Here's the link to the Exchange Trends Report
OK, next up: HOW MANY HAVE PAID???
The left side of the table below comes directly from this week's CMS effectuation report. The right side comes from the April Open Enrollment Period report which lists the raw QHP selections as of the end of the Open Enrollment Period, as well as what percentage of those folks were still actually enrolled in paid, effectuated policies as of February 2018.
Why is this a big deal? Well, long-time readers may recall that throughout the crazy first Open Enrollment Period, there was a near obsession among the GOP and other ACA dectractors with the burning question of "BUT HOW MANY HAVE PAID???" to the point that it became a joking meme among activists and reporters. It became so all-consuming that the House Republican Energy & Commerce Committee went so far as to send out a survey to insurance carriers and then make a big spectacle of their conclusion which claimed that only 67% of enrollees were paying for their first monthly premium (which, as I painstakingly pointed out at the time, was utterly full of garbage).
At the time, I repeatedly pointed out that while it's a perfectly valid question to ask, the timing of the question is extremely important, since most people don't pay their cable or electric bills the moment the invoice shows up in the mail; they usually wait until near the due date. I crunched a lot of numbers and concluded that the actual payment rate was closer to around 88% or so, and that it likely nudged up a bit to around 90% after that.
In the case of ACA open enrollment, someone who selected a policy on November 1st, 2017 had until around mid-December to actually pay their January premium, so the number of paid enrollees as of, say, November 15th is kind of meaningless.
In addition, as I noted in Part One, anyone who enrolled in coverage between 12/16 - 12/31 didn't have their policy actually go into effect until February 1st anyway, so they have until mid-January to pay up. Finally, there were a few states which kept OE5 going through the end of January; anyone who enrolled between 1/16 - 1/31 wouldn't have their policy start until March 1st. This was a pretty nominal number for 2018 since it was only CA, DC & NY (plus MA, which held enrollment open through 1/23); I estimate no more than 65,000 peopel enrolled after 1/15 this year.
In prior years, CMS used the end of Q1 (March) as their "as of" effecuation report cut-off date. The March effectuation number was 85-87% of the total QHP number for 2015, 2016 and 2017...but there was some "churn noise" mixed in with all of that, since some people drop their coverage after the first or second month while a good 8,000 or so other folks sign up every day during the off season via Special Enrollment Periods.
This year, however, they changed that to February. This one-month discrepancy causes some problems (as I noted in Part One), but it also does have one advantage this year: Since over 99% of all QHP selections were January or February start dates, it makes for a "cleaner" measure of HOW MANY HAVE PAID their first monthly premium. Virtually every one of the 10.6 million effectuated as of February 1st come from the official Open Enrollment Period itself. Behold!
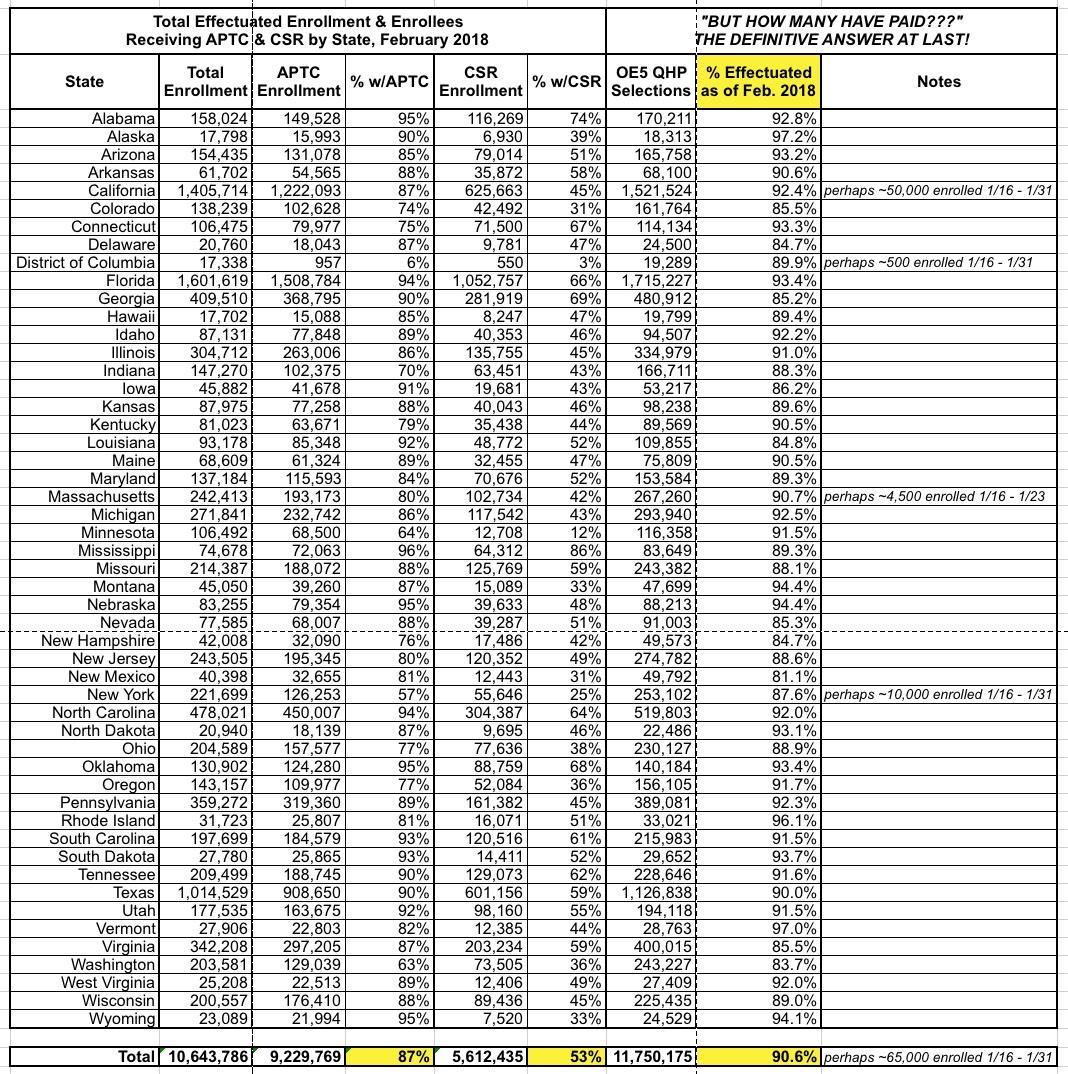
There you have it: 90.6% of those who selected QHPs during the 2018 Open Enrollment Period paid their first (and for the most part, second) monthly premium. In fact, it's actually slightly higher than that, since perhaps 65,000 of them didn't start their coverage until March 1st, and therefore didn't have their first premium due as of February 1st.
If you subtract them from the February-start total, you get a 91.1% payment rate for those who started coverage in either January or February. In other words, I was right all along. Note that this rate varies widely, from as low as 81% in New Mexico to as high as 97% in Alaska. Why? I'm sure there are various reasons depending on the specific demographics, plan offerings, networks and so forth in each state.
Keep in mind that this doesn't have anything to do with how many only pay for their first or second month; as I've written about many times before, there's still some degree of a "gaming" problem with people only paying for a few months, having expensive treatments/procedures and then dropping their coverage afterwards...a problem which is bound to get worse now that the individual mandate penalty has been repealed, I should note.
However, the "How Many Have Paid" brouhaha was such a big deal during the first year of Open Enrollment that I thought it was worth drawing some attention to the answer all these years later.
SUBSIDIZED ENROLLMENT ONLY DROPPED 5.6% AS OF FEB. 1st...
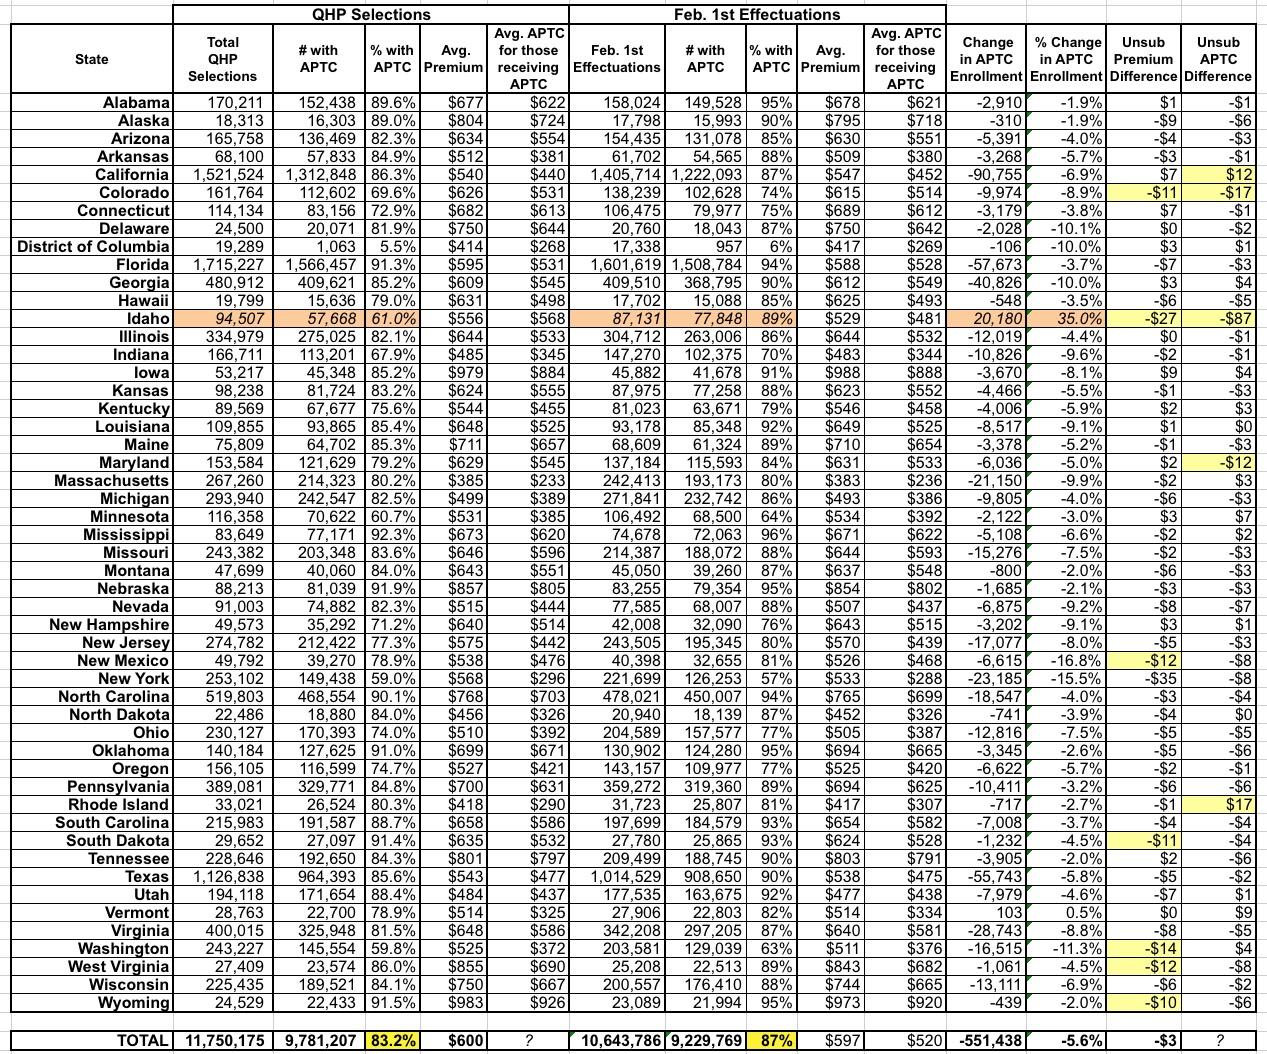
The next two tables look complicated but it really aren't. In the first table (subsidized enrollees), the first few columns come from the 2018 Public User File...these are the raw QHP selection numbers from the 2018 Open Enrollment Period through December 15 (or as late as January 31 in CA/DC/NY). The second batch of columns are the exact same data as of effectuated enrollees on February 1st...that is, again, after subtracting those who didn't pay and/or cancelled their policies before they even began.
As you can see, around 550,000 subsdizied enrollees (about 5.6% of the total who selected QHPs) never paid their first (or second, in some cases) month's premium.
There's one obvious discrepancy here in Idaho, however (marked in beige)...according to the OE5 PUF, only ~58,000 ID enrollees were supposed to receive APTC assistance (61% of the 94.5K total), but as of February that number had somehow increased to nearly ~78,000 (89% of the 87K still enrolled). There's simply no possible way that this could have happened. Either the 57.7K figure or the 77.8K figure must be wrong, and my guess is that it's 57.7K that's off.
One other mildly noteworthy item here: Because of slight fluctuations in which people paid or didn't pay their first premium, both the average premium and average subsidy amount changed slightly in each state. Most of these are fairly nominal amounts, but in a few states they either increased or dropped by more than $10/month (highlighted).
The one which really stands out is, again, Idaho: According to the official CMS OE5 PUF and Effectuation reports, the average full-price premium dropped by $27 as of February, while the average subsidy dropped by a whopping $87. Again, this is likely related to a data error for Idaho.
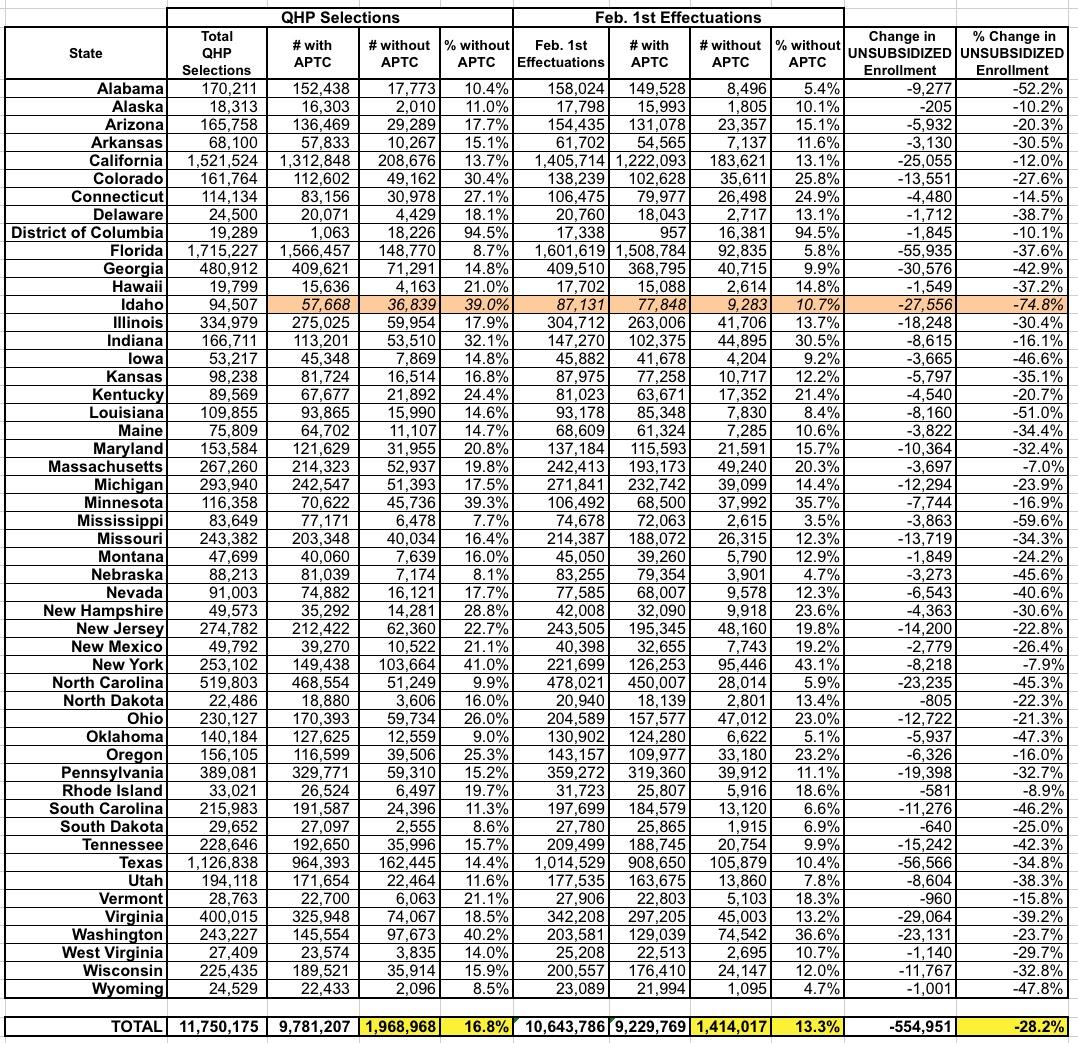
...BUT UNSUBSIDIZED ENROLLMENT DROPPED A WHOPPING 28% AS OF FEB 1st...
Here's the same comparison of unsubsidized exchange enrollment. I've removed the premium/subsidy columns (since subsidies aren't relevant here). As you can see, while Idaho remains a big question mark due to that likely erroneous "57.7K subsidized" cell, otherwise the picture is pretty eyebrow-raising: The unsubsidized enrollment total dropped more (555K, or 28.2%) than the subsidized total (551K, or 5.6%) did even though unsubsidized enrollees only make up about 1/6th of all exchange enrollees!
If you disregard Idaho, the unsubsidized percentage drop ranges from just 7% in Massachusetts to a whopping 60% in Mississippi.
This is right in line with other conclusions from the reports (which I'm still getting to) regarding off-exchange enrollment, which of course is all unsubsidized.
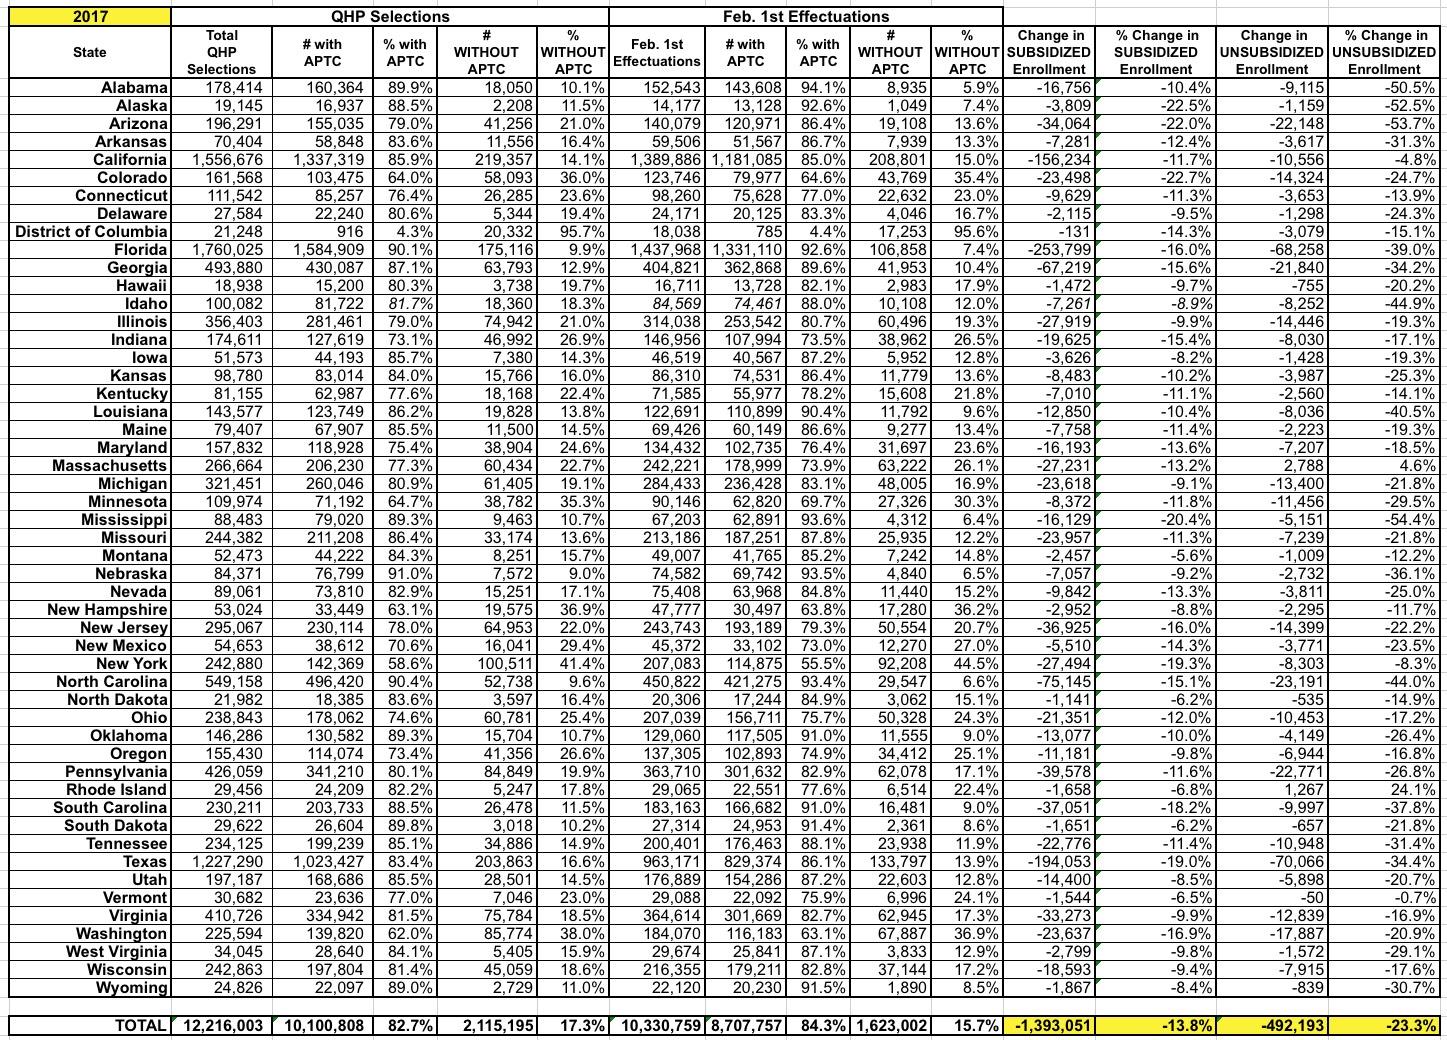
Here's how both of these figures compare to 2017...but with one really, really important caveat: In 2017, Open Enrollment continued all the way through January 31st for all 50 states +DC. Unlike 2018, when only perhaps 65,000 people enrolled after the 1/15 cut-off for February coverage, in 2017 it was more like 500,000 people.
For 2018, that's only about a 0.5% discrepancy; not much more than a rounding error. But in 2017, those 500,000 enrollees made up 4.1% of the total QHP selections, which is enough to skew the numbers and percentages significantly. There's no way of knowing what the subsidized/unsubsidized ratios were in any particular state or nationally. I'm guessing that it was the same ~83% subsidized to ~17% unsubsidized ratio that we saw overall, which would mean subtracting perhaps 410,000 subsidized and 90,000 unsubsidized enrollees from the national totals below. If so, that would mean the February drops were more like 10.1% for subsidized enrollees and 19.9% for unsubsidized enrollees from the QHP selection totals to actual effectuated February enrollment.
In summary, as far as I can tell:
- In 2017, around 10% of subsidized and 20% of unsubsidized enrollees never paid their first monthly premiums.
- In 2018, around 5.6% of subsidized and 28% of unsubsidized enrollees never paid their first monthly premiums.
The difference is striking.
Advertisement
