

State By State: Guess which states have already enrolled the highest percent of their total populations in ACA exchange policies for 2017?
Fri, 12/23/2016 - 12:37pm
With the HHS Dept. having just released the total number of 2017 Open Enrollment Period enrollees through the extended December deadline, I've been seeing a lot of comments on Twitter along the following:
Florida, Texas, North Carolina, Georgia highest Obamacare enrollees... lol... Trumpers should have listened! #ACA #lawrenceodonnell
— NastyGO (@gwenorel1) December 23, 2016
There are two problems with this:
- First, these are all relying exclusively on the HealthCare.Gov data only, which a) doesn't include the 12 states running their own exchanges and b) doesn't include the several million auto-renewals which have yet to be added to the official tally. While 6.4 million people have signed up via HC.gov, another 2.4 million have signed via in 10 of the 12 state-based exchanges (2 states, New York and Vermont, haven't released any data whatsoever).
- Second, obviously a higher-population state is generally going to have a higher number of people signing up.
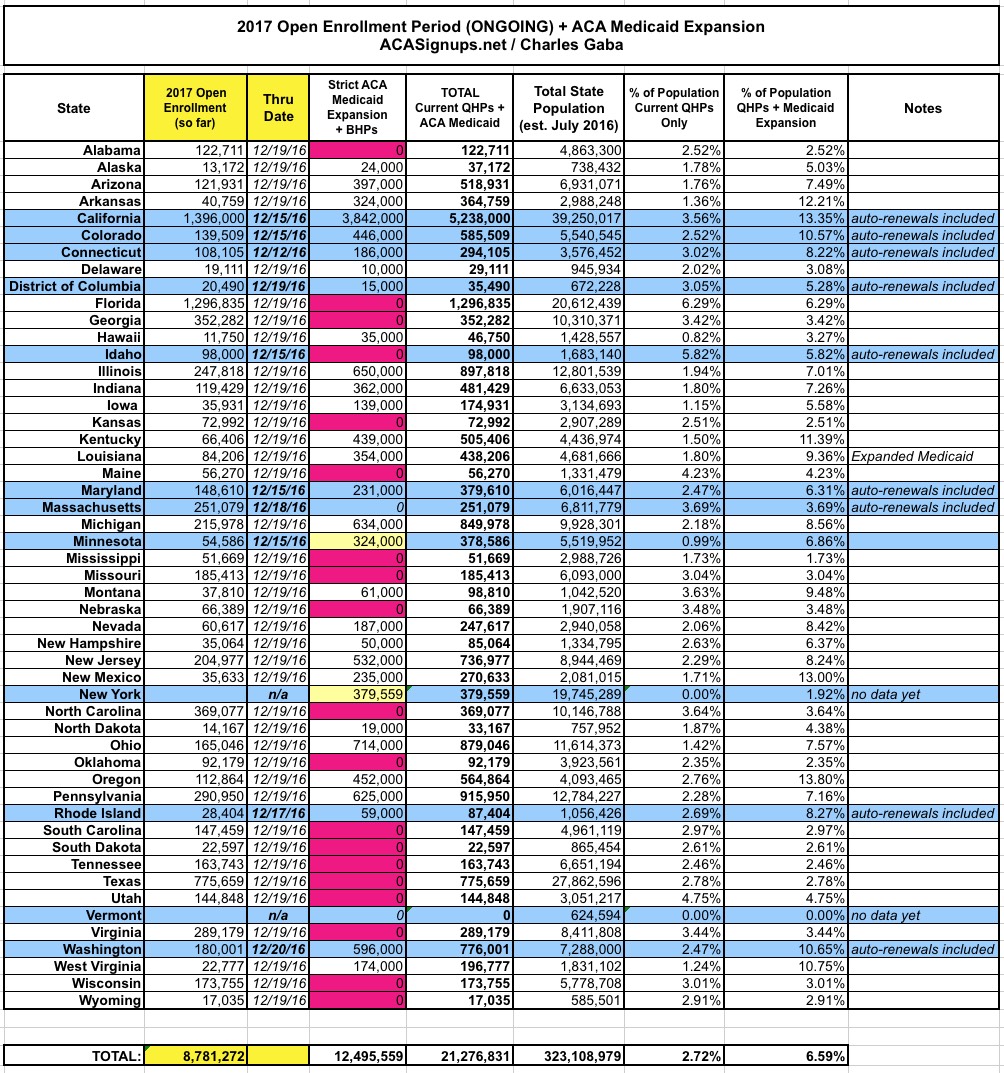
Therefore, I've compiled the following table which ranks each state by the percent of their total population who have been confirmed to have already selected a Qualified Health Plan (QHP) through the ACA exchange for 2017 as of the 12/19/16 deadline. I've also included another column, which add in the number of people enrolled in ACA Medicaid expansion.
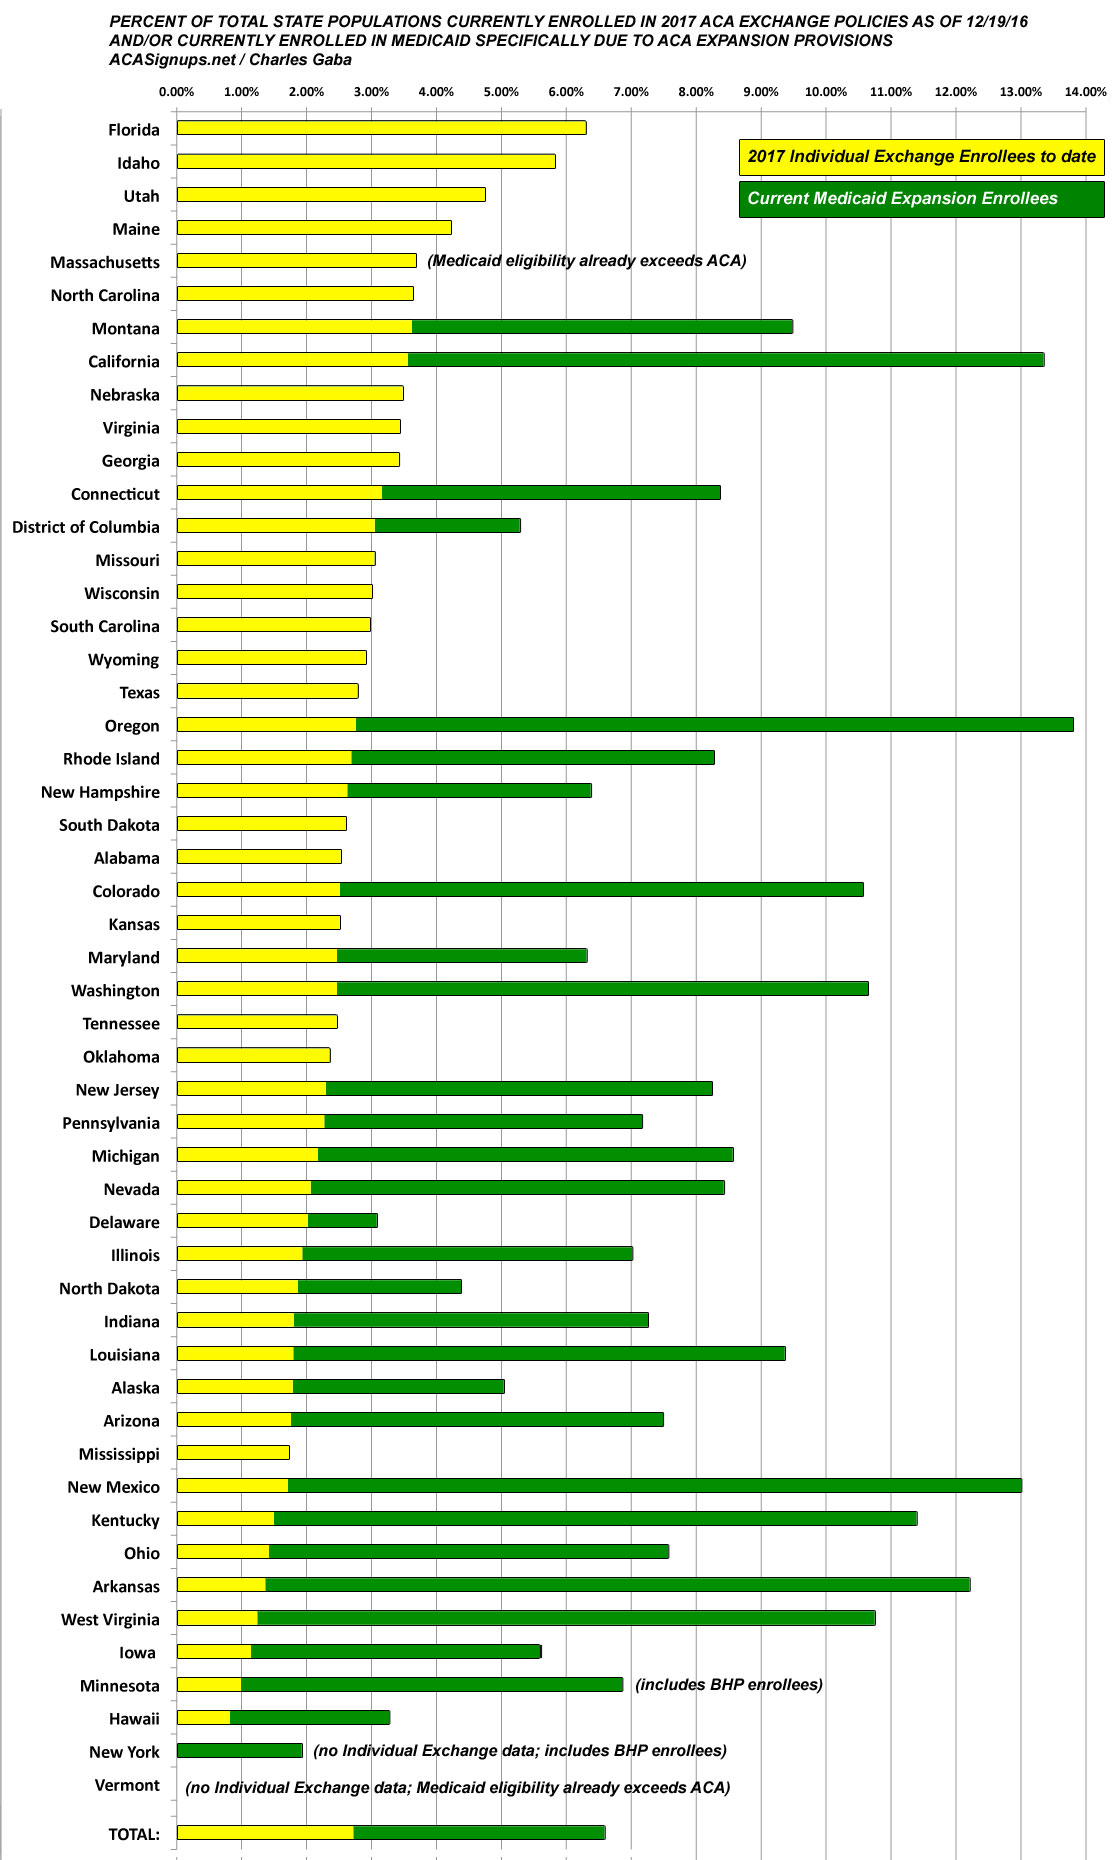
Finally, below the table, I've sorted the states both ways: The percent of total population who've selected QHPs only, and the percent who've either selected QHPs or are enrolled in ACA Medicaid expansion. In the case of New York and Minnesota, I've also added their BHP enrollment to the Medicaid numbers:
From a political POV, the results are interesting. As you can see, based on the percent of population enrolled in QHPs only, the top three are Florida, Idaho and Utah...each of which voted for Donald Trump (if just barely in the case of FL). In fact, 6 of the top 10 voted for Trump, including North Carolina, Montana and Nebraska.
California has a higher raw number of QHP selections than Florida to date (1.4 million vs. 1.3 million)...but CA's total population is over 40% higher, so it ranks lower on the first bar graph. Florida has already enrolled 6.3% of their entire population in ACA exchange policies for 2017...and again, auto-renewals still haven't been added to the mix yet.
In fact, even if Florida only ends up with the exact same number of enrollees as last year (1.74 million), they'll still have enrolled 8.4% of their total population by the end of January. And remember, that's without having expanded Medicaid in the first place.
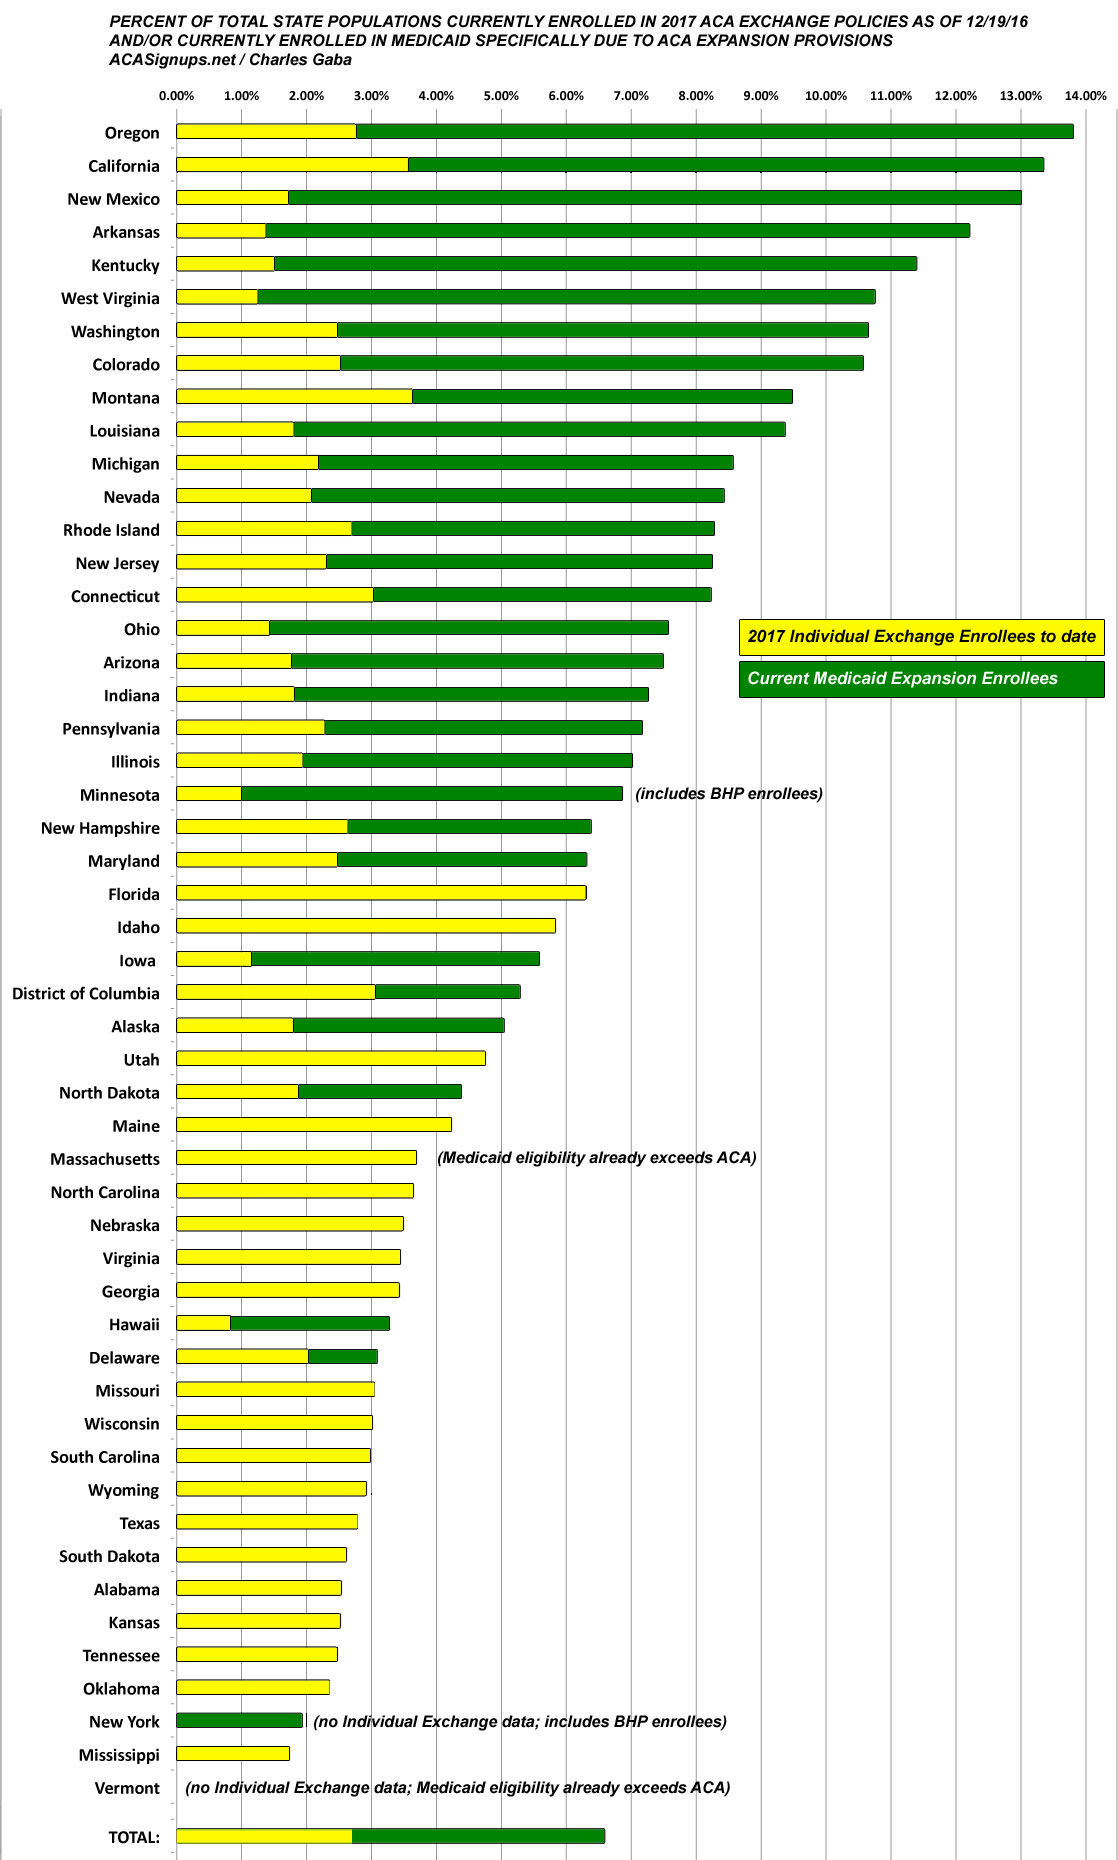
If you sort the states by the combined QHP + Medicaid expansion percentages, it's obviously a very different story. For one thing, 19 GOP-controlled states never expanded Medicaid in the first place, so they obviously tend to rank far lower in the second graph. Blue states like Oregon, California, New Mexico, Washington and Colorado dominate the top ten once Medicaid expansion is factored in.
Still, the GOP states which did expand Medicaid still have a pretty high percentage of their populations at risk: 12% in Arkansas; 11% in Kentucky and West Virginia; around 9% in Montana, Louisiana and Michigan, and so on.
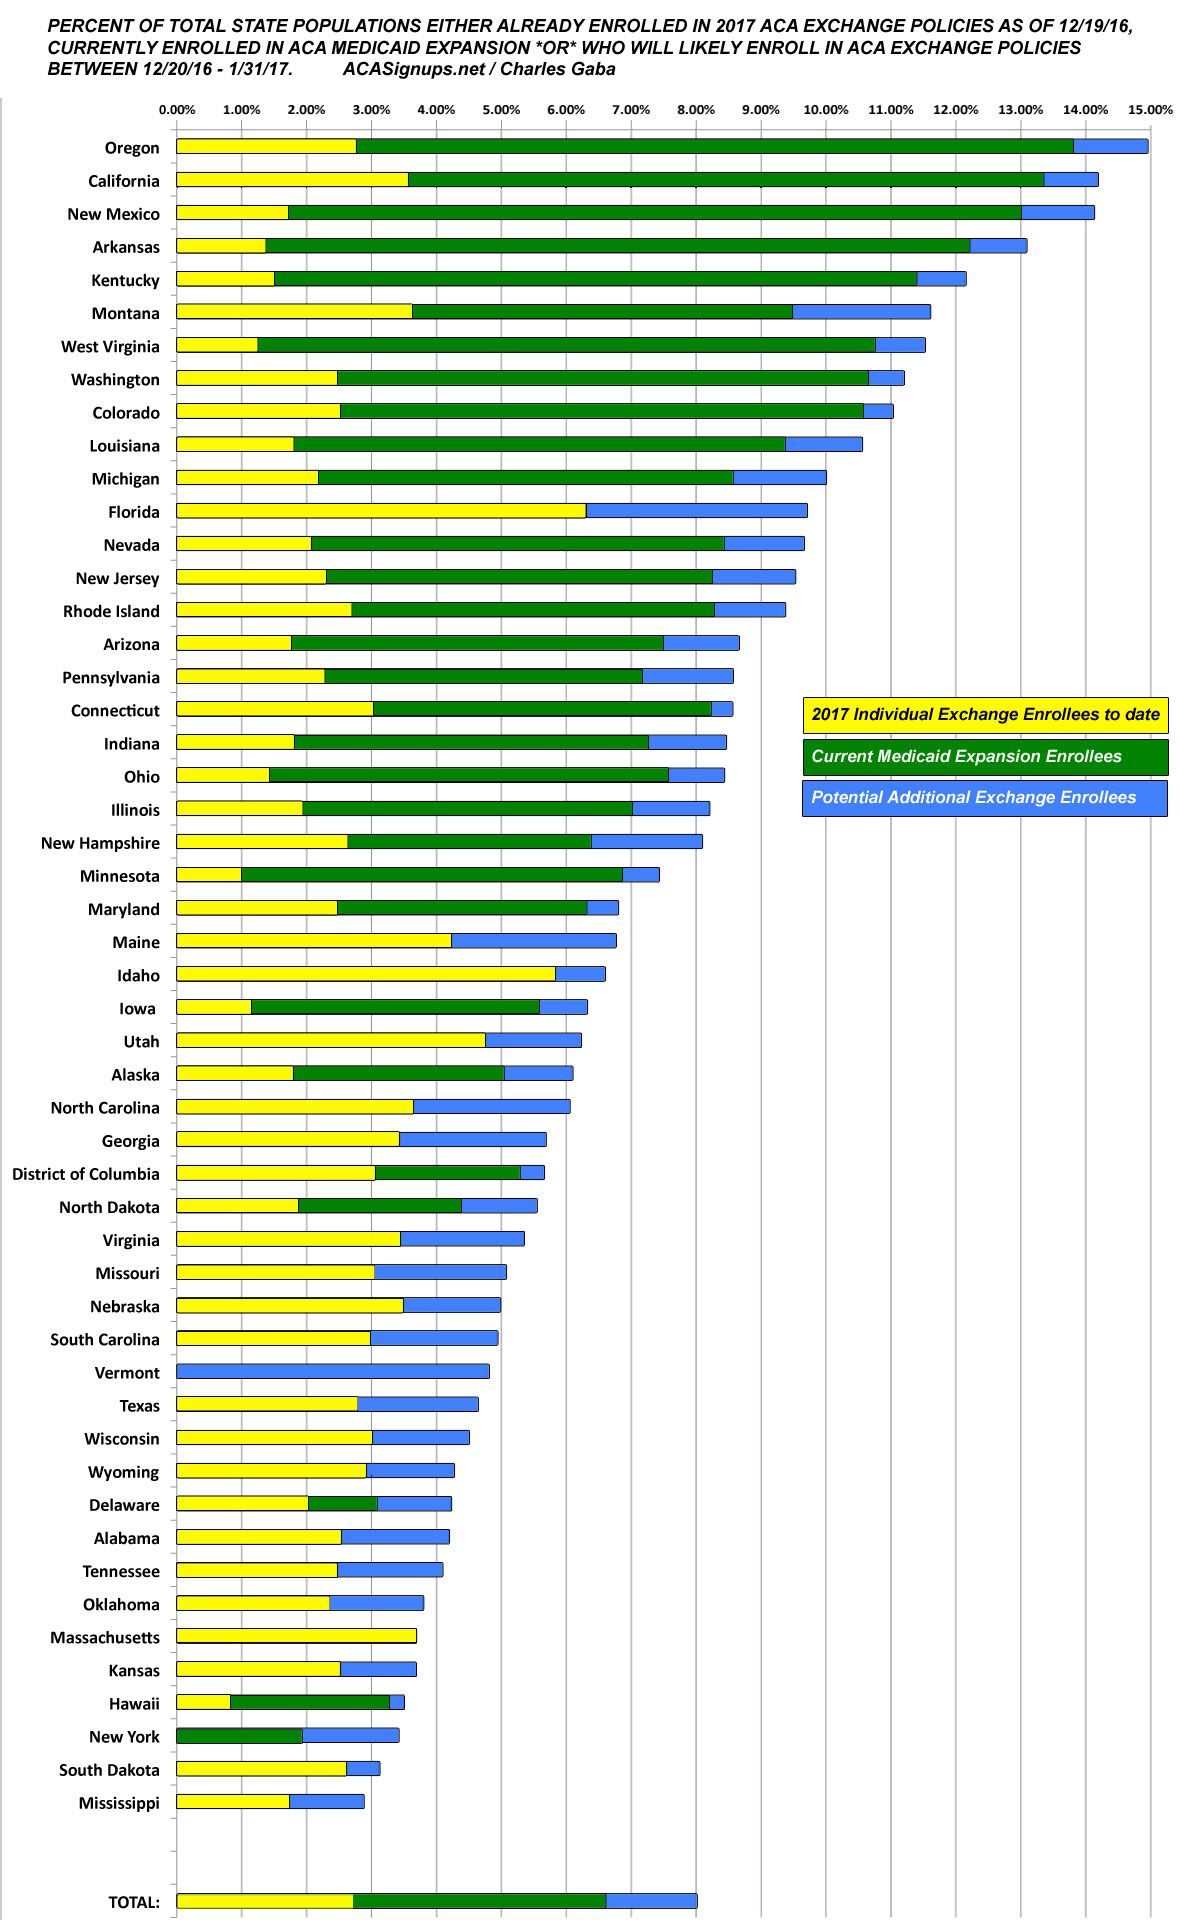
UPDATE 12/26/16: Just for the hell of it, I also whipped up a third version which assumes that the final OE4 QHP selections end up hitting my revised total of around 13.4 million people nationally. Here's what that would look like:
Advertisement
