

November CMS Medicaid Report: Net increase of 14.1M (actually 15.0M)
Thu, 01/28/2016 - 4:19pm
The official CMS November 2015 Medicaid/CHIP Enrollment Report has been released, and the net enrollment increase due to the ACA continues to quietly increase, passing the 14 million mark (or, arguably, hitting 15 million, depending on your POV):
- Nearly 71 million individuals were enrolled in Medicaid and CHIP in November 2015. 7 This enrollment count is point-in-time (on the last day of the month) and includes all enrollees in the Medicaid and CHIP programs who are receiving a comprehensive benefit package.
This number is about 900K lower than October's report (71.8 million) due to a reporting correction in California:
6 The data contained in this report is preliminary because it is reported soon after the close of the reporting month and contains few, if any, individuals who become eligible in November 2015 after the close of the month due to retroactive eligibility under Medicaid or similar reasons. In Medicaid, individuals are potentially eligible for retroactive coverage for incurred health care costs dating back to 90 days prior to the date of application. This figure is not comparable to the October 2015 total enrollment included in last month’s report (nearly 71.8 million). California updated its data this month to more closely align with CMS’s data specifications, which resulted in a downward adjustment to its total enrollment of more than 1 million. The state subsequently revised all prior months’ enrollment counts to reflect the updated methodology and to ensure comparability across months. The state’s enrollment data for October 2015 and the July – September 2013 baseline period that are included in this report reflect this methodological change.
In other words, the grand total number of enrollees was reduced by over 1 million, but increased by 275,000 vs. October nationally:
- 274,893 additional people were enrolled in November 2015 as compared to October 2015 in the 50 states that reported comparable October and November 2015 data (Arkansas is not included in this count).8
The monthly increases are less dramatic than they were in 2014 and the first half of 2015 because ACA Medicaid expansion has slowed down, but that's still another 275,000 who've signed up. As a result...
- Looking at the additional enrollment since October 2013 when the initial Marketplace open enrollment period began, among the 48 states reporting both November 2015 enrollment data and data from July-September of 2013, nearly 14.1 million additional individuals are enrolled in Medicaid and CHIP as of November 2015, nearly a 25.3 percent increase over the average monthly enrollment for July through September of 2013.9 (Arkansas, Connecticut and Maine are not included in this count. Arkansas was included in monthly reports prior to September 2015, so the cumulative change reported in this month’s report is not comparable to the corresponding statistics in those reports.)10
That's 14.1 million additional people covered since October 2013. Around 11 million of these are via "official" ACA expansion; the other 4 million are either "woodworkers" (people who were already eligible for Medicaid prior to the ACA but who didn't actually sign up until the expansion program started) or people who are simply newly-eligible for "regular" Medicaid for the same reasons people have always become eligible.
- Among states that had implemented the Medicaid expansion and were covering newly eligible adults in November 2015, Medicaid and CHIP enrollment rose by nearly 34 percent compared to the July-September 2013 baseline period, while states that have not, to date, expanded Medicaid reported an increase of 10.1 percent over the same period.11
In addition, as always, you have to tack on the additional 950K who were quietly added to the Medicaid roles before expansion officially started, although most of these folks were actually transferred to Medicaid from other existing state-run public healthcare programs, such as LIHP in California, CommonwealthCare in Massachusetts and so forth:
- These enrollment counts are in addition to the enrollment increases from the nearly 950,000 individuals who gained coverage as a result of the Affordable Care Act before open enrollment began.12 Seven states implemented an “early option” to expand Medicaid coverage to adults with incomes up to 133 percent of the FPL between April 1, 2010 and January 1, 2014, using new state plan authority provided by the Affordable Care Act or a demonstration under section 1115 of the Social Security Act building upon that authority.13
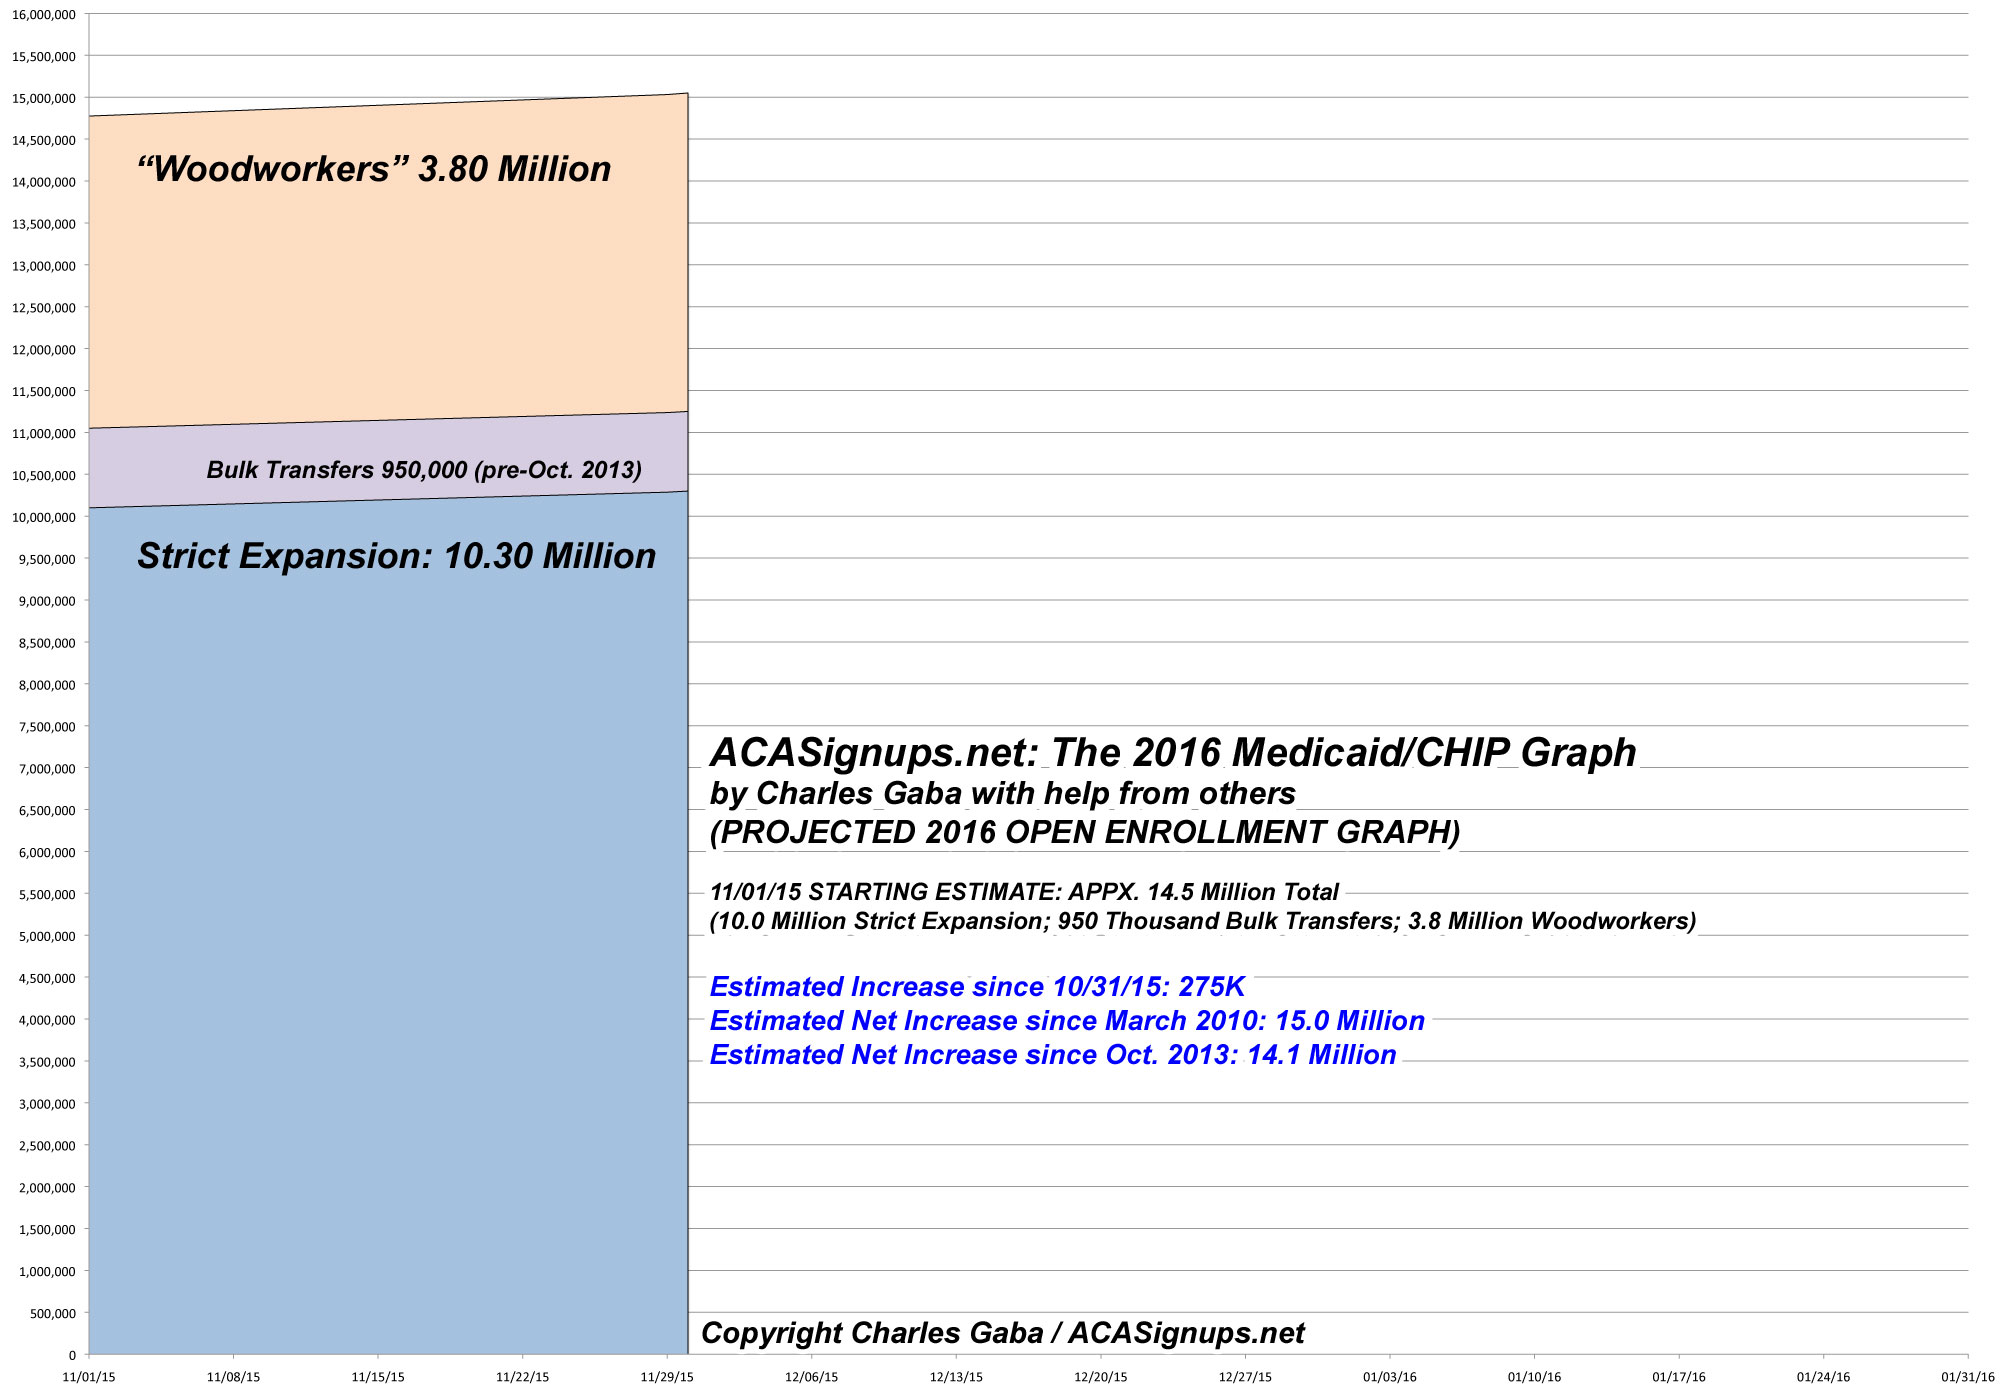
Add it all up, and this is what the Medicaid Graph looks like:
Advertisement
