

GET YOUR DATA GEEK ON: Q4 2015 CMS Effectuated Enrollment Report Analysis!
Sun, 03/27/2016 - 6:12pm
(sigh) OK, I guess I lied...it did take another full week for me to get around to the CMS 2015 End Of Year Effectuated Exchange Enrollment Report as well as the final part of my #OE3 ASPE report analysis after all. To review, here was Part One and Part Two.
Today I'm looking at the December 31, 2015 state-by-state data. I'll return to the actual ASPE report (for Part 3) next:
On December 31, 2015, about 8.8 million consumers had effectuated Health Insurance Marketplace coverage – which means those individuals paid their premiums and had an active policy at the end of December. Of the approximately 8.8 million consumers nationwide with effectuated Marketplace enrollments at the end of December 2015, about 84 percent, or about 7.4 million consumers, were receiving an advance payment of the premium tax credit (APTC) to make their premiums more affordable throughout the year. The average APTC for those enrollees who qualified for the financial assistance was $272 per month.
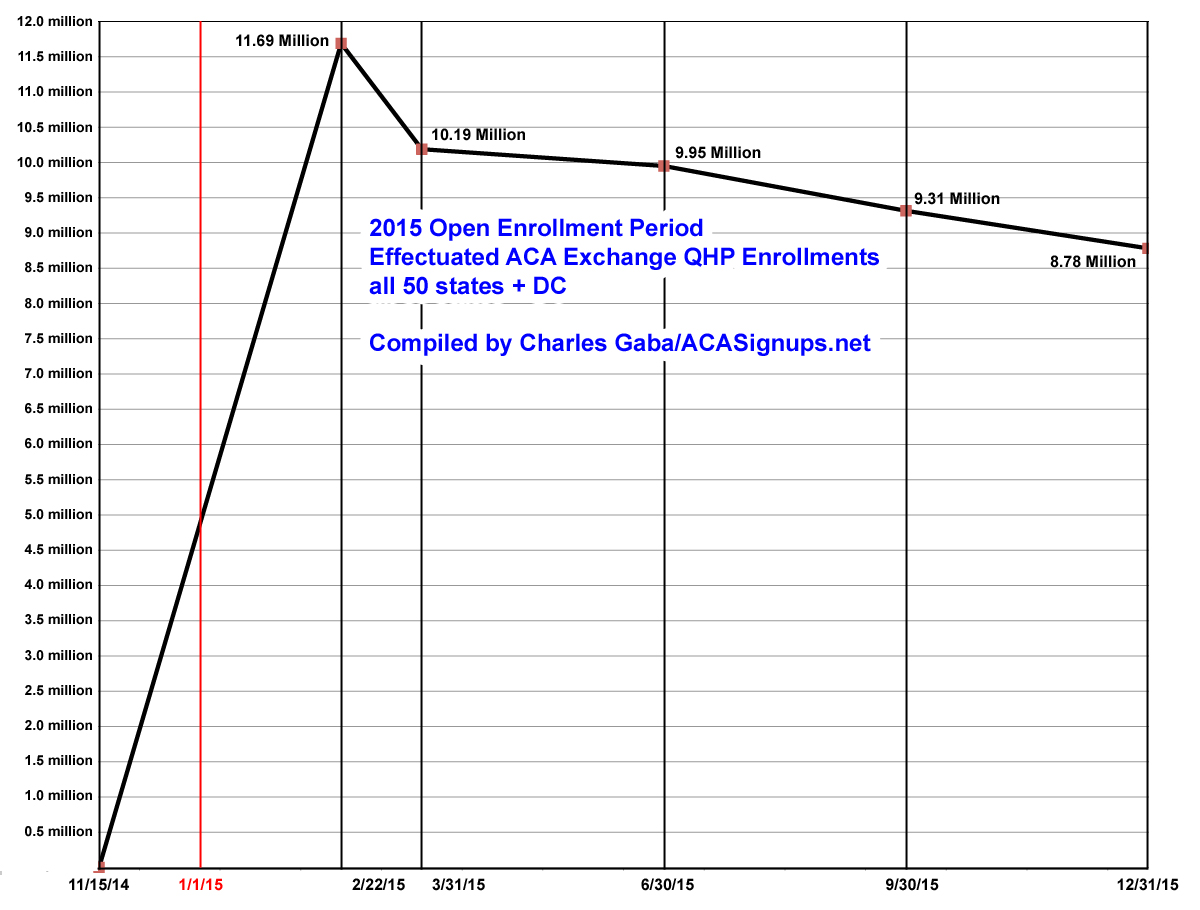
Ouch. There's no putting a pretty face on this number. Last fall I projected that the Q4 (12/31/15) effectuated enrollment figure would be around 9.7 million (although I was obviously proven wrong when the Q3 9/30/15 report was released; the number had already dropped down to 9.3 million by that point). This alone is a large part of the reason I was so far off in my projection of 14.7 million total OE3 enrollees; I assumed 9 million 2015 enrollees would renew, when in fact there didn't end up being 9 million people still enrolled in 2015 policies total. However, the actual number fell short of even the HHS Dept's lower projection of roughly 9.1 million. Needless to say, this is pretty disappointing from their POV.
There were 6.3 million consumers with effectuated enrollments at the end of December 2015 through the 37 Federally-Facilitated Marketplaces, including State Partnership Marketplaces and supported State-based Marketplaces that utilize the HealthCare.gov eligibility and enrollment platform (collectively known as HealthCare.gov states) and 2.5 million through the remaining State-based Marketplaces.iii Effectuated enrollment for the 37 states that use HealthCare.gov platform as of September 30, 2015 was 6.7 million, and 2.6 million for the remaining State-based Marketplaces.
Shorter version: 6.3 million via HC.gov, plus 2.5 million via the state exchanges, down from 6.7 million / 2.6 million as of 9/30/15. That's a 6% and 4% Q/Q drop respectively.
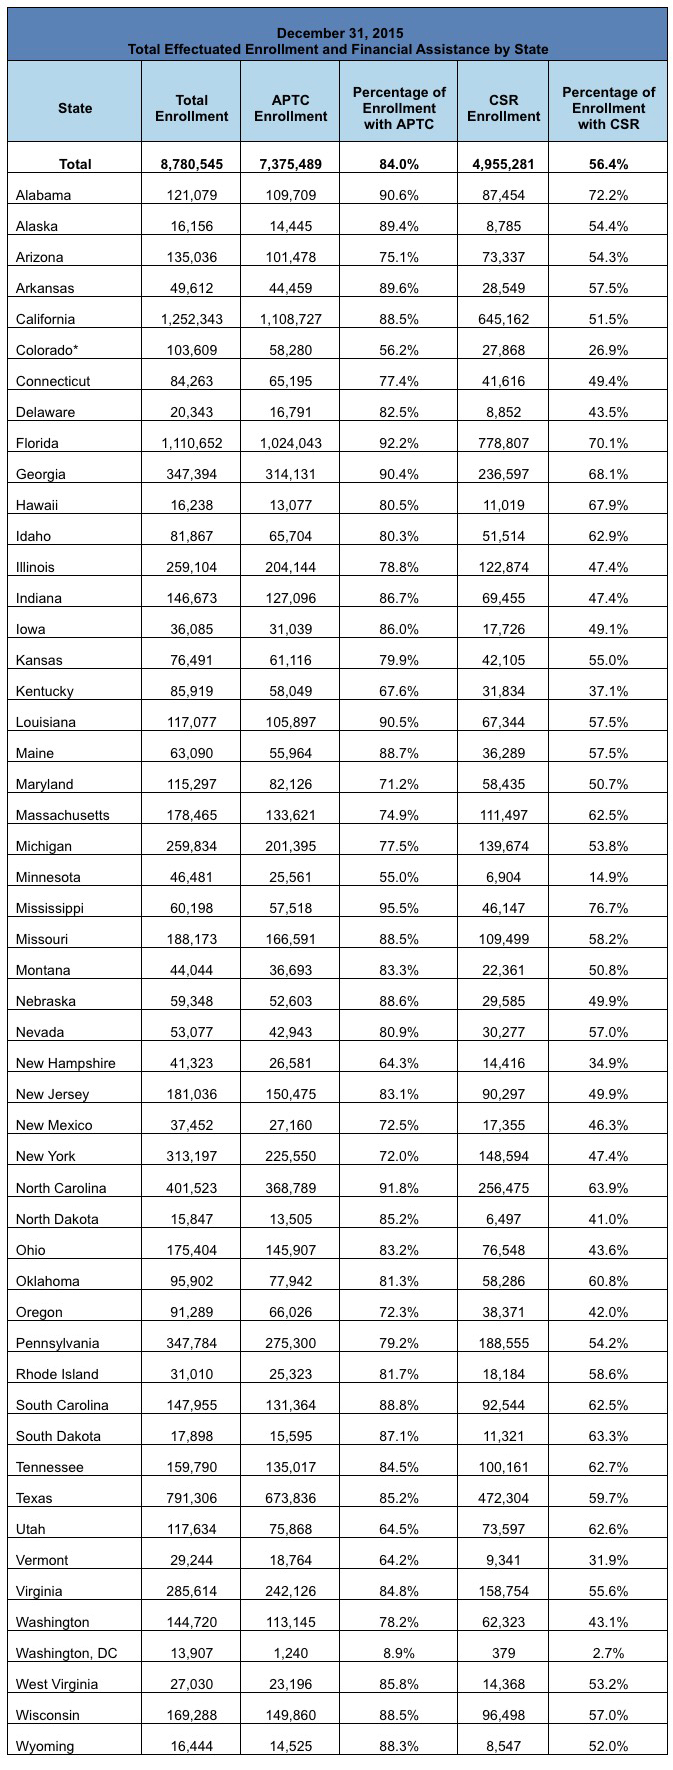
December 2015: Total Effectuated Enrollment and Financial Assistance
Of the approximately 8.8 million consumers who had effectuated Marketplace enrollments at the end of December 2015, about 84 percent or about 7.4 million consumers were receiving APTC and 56 percent or about 5 million consumers were benefiting from cost sharing reductions (CSRs) to make their coverage more affordable. CSRs are generally available if a consumer’s household income is between 100 percent and 250 percent of the federal poverty level, the consumer is otherwise eligible for APTC, and the individual chooses a health plan from the silver plan category.
Here's the actual End Of Year table:
There are two other tables at the link, covering the average APTC (federal tax credits) for those receiving them in each state as well as the Metal Level enrollment in each one. You can click through for those. Instead of pasting those in, however, I'm gonna do something a bit different. I couldn't really do this for 2014 since there were no "mid-year" state-by-state breakouts, but for 2015 I can: Here's a spreadsheet showing how enrollment grew and fell in each state throughout the year:
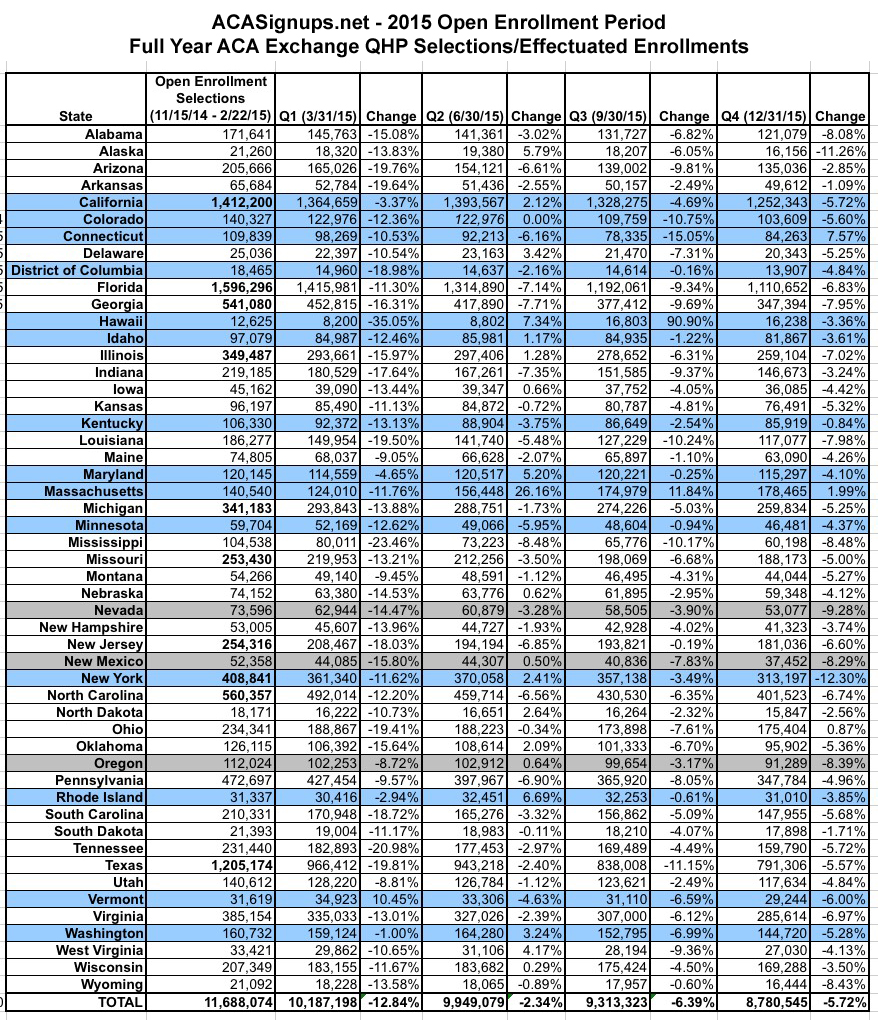
As you can see, for the most part, effectuated enrollees dropped off noticably between the end of Open Enrollment and the end of the first quarter (12.8% nationally), mainly because hundreds of thousands of people who either a) never paid their first month's premium or b) were kicked off their policies due to legal residency verification issues were purged from the enrollment list.
After that, most states continued to see only slight attrition in the 2nd quarter (2.3%), but more dramatic attrition in the third (6.4%) and fourth (5.7%) quarters.
HOWEVER, there were some exceptions to this; here are the main notes:
- 17 states (Alaska, California, Delaware, Idaho, Illinois, Iowa, Maryland, Nebraska, New Mexico, New York, North Dakota, Oklahoma, Oregon, Rhode Island, Washington State, West Virginia and Wisconsin) all actually increased enrollment in Q2 before dropping back off again in the 2nd half of the year.
- Massachusetts did drop by the end of Q1, but was the only state to increase enrollment in all 3 subsequent quarters. This is because of MA's unique "ConnectorCare" exchange policies, which are available for enrollment year round instead of being limited to the official open enrollment cut-off.
- Hawaii was an utter mess. While they appear to have somehow nearly doubled their enrollments from Q2 to Q3, it turns out that their records were quite literally pulled out of someone's ass.
- Connecticut and Ohio somehow increased their number noticeably in Q4 (CT's increase was dramatic; Ohio's was nominal).
- Vermont somehow managed to increase their number between the end of open enrollment and the end of March, just 5 weeks later. Not sure how they pulled that one off. Given their ongoing technical bugaboos, I suspect bugs in the system.
- Colorado's Q2 number was unknown for technical reasons, so they just kept the same number from Q1.
- Washington State only dropped 1% in Q1, but that's because they were only reporting QHPs if the enrollee actually paid their first premium first.
- This should have held true for Massachusetts as well, but their Q1 number is lower than the open enrollment total like most other states for some reason.
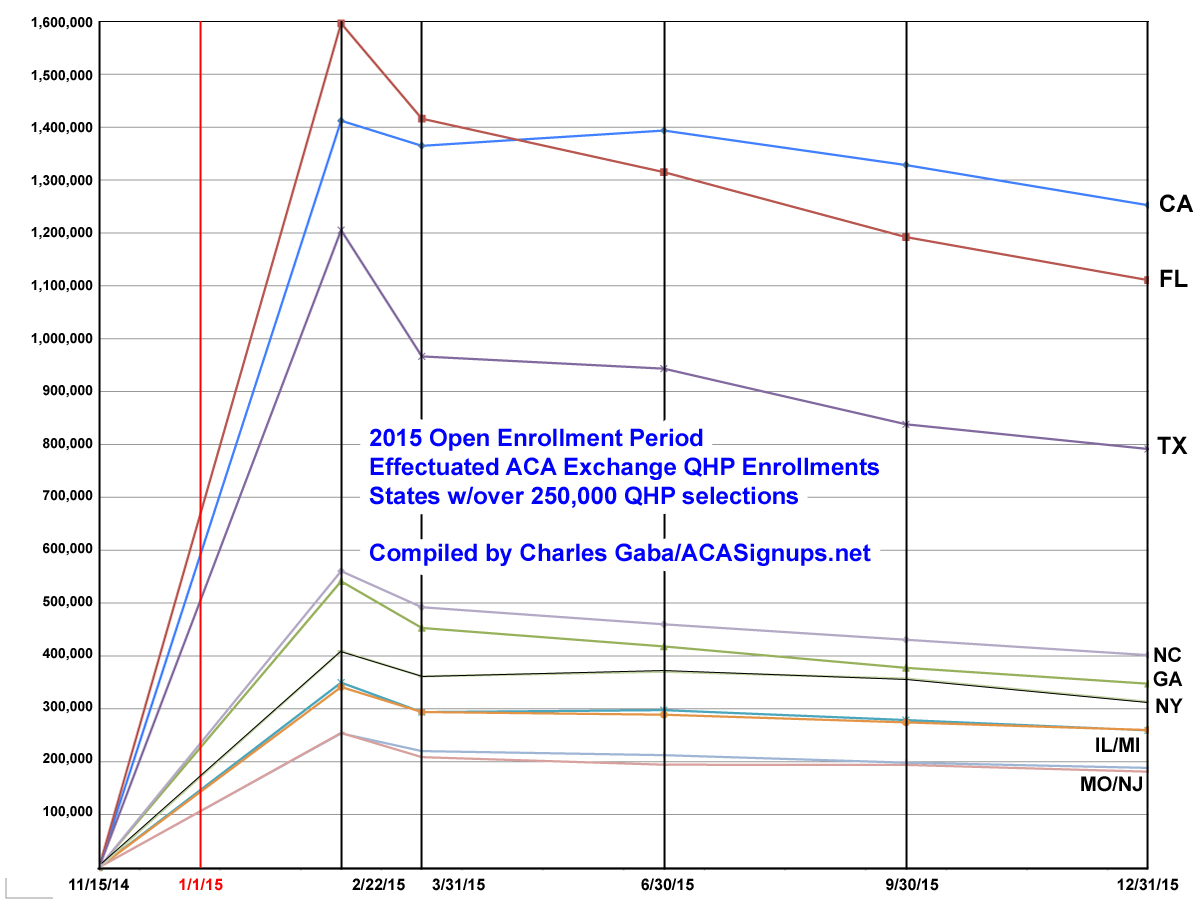
Here's what the numbers look like for the entire country as well as for the 10 states with the largest QHP selection numbers (ie, over 250,000 as of 2/22/15):
As you can see below, the top 10 states mostly stuck to the national pattern. The noticeable exception was California, which managed to increase their enrollments in the 2nd quarter before dropping off again. This resulted in an interesting situation--Florida, which started out with the highest number of enrollees (nearly 1.6 million, vs. California's 1.4 million) actually ended the year with 140,000 fewer people still enrolled via exchange policies than the Golden State. In fact, CA managed to retain 89% of their original enrollees, while FL only held onto 70% of theirs.
Part of this likely has to do with Covered California's extremely hands-on approach to their state-run exchange; part of it may be due to Florida having large numbers of undocumented immigrants kicked off of their policies for residency verification issues. Yes, California has a higher number of undocumenteds (over 2.5 million, or 6.8% of the population) than Florida (825K, or 6.6%), but it's possible that CoveredCA has a better screening process during the enrollment process than HealthCare.Gov, which runs Florida's exchange.
Anyway, that's it for this entry. Check back soon for Part 3 (the final chapter) of my 2016 OE3 ASPE Report Analysis!
Advertisement
