2021 Rate Changes

Every year, I spend months painstakingly tracking every insurance carrier rate filing for the following year to determine just how much average insurance policy premiums on the individual market are projected to increase or decrease.

Carriers tendency to jump in and out of the market, repeatedly revise their requests, and the confusing blizzard of actual filing forms sometimes make it next to impossible to find the specific data I need. The actual data I need to compile my estimates are actually fairly simple, however. I really only need three pieces of information for each carrier:

  • How many effectuated enrollees they have enrolled in ACA-compliant individual market policies;
  • What their average projected premium rate increase (or decrease) is for those enrollees (assuming 100% of them renew their existing policies, of course); and
  • Ideally, a breakout of the reasons behind those rate changes, since there's usually more than one.
  • In 2015, I projected that the overall average rate increases for 2016 would be roughly 12-13% nationally. It turned out to be around 11.6%.
  • In 2016, I projected that the overall average rate increases for 2017 would be roughly 25% nationally. It turned out to be around 22%, but that only included on-exchange Silver plan enrollees across 44 states (I included all metal levels, both on and off exchange, across all 50 states).
  • In 2017, I projected that the overall average rate increases for 2018 would be around 29% nationally, and that 60% of that would be due specifically to deliberate Trump Administration actions designed to sabotage the ACA markets. It turned out to be around 28% nationally.
  • In 2018, I projected that the overall average rate increases for 2019 would be around 2.8% nationally, and that premiums would have dropped around 5.4% on average if not for the ACA's individual mandate being repealed & short-term & association plans being expanded. Hhealthcare think tank Avalere Health came to almost the exact same estimates on the actual rate changes, while Brookings Institute healthcare analyst Matthew Fiedler concluded that unsubsidized ACA individual market premiums would indeed have dropped by around 4.3% nationally on average in the absence of mandate repeal and expansion of #ShortAssPlans.

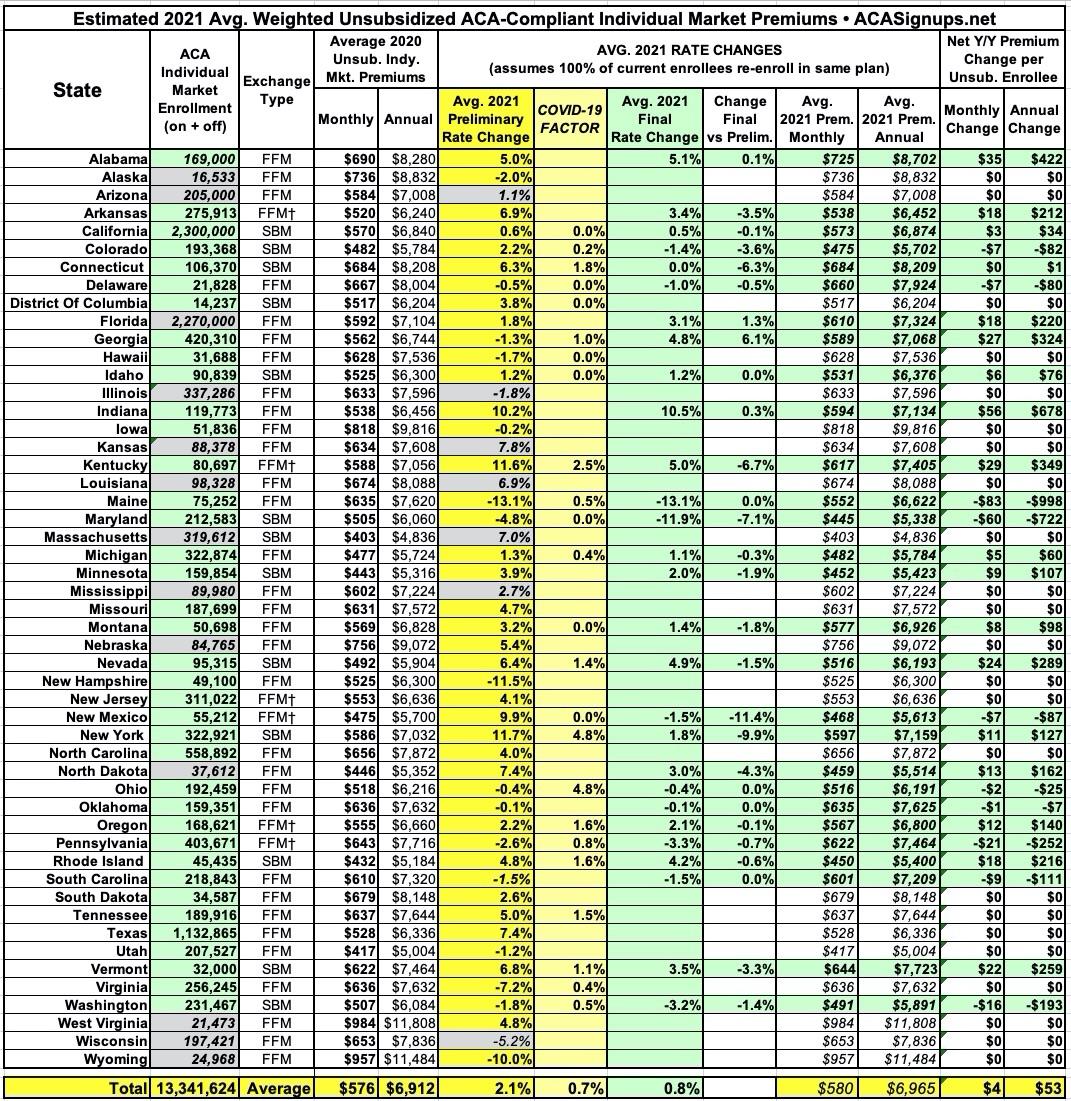
In other words, I've had a pretty good track record of accurately projecting average premium increases for the upcoming year for five years in a row. With that in mind, below you'll find a table tracking the state-by-state preliminary and final rate changes for the 2021 ACA-compliant individual (and sometimes small group) markets. Scroll down for individual state entry links.

For 2021, the biggest new factor is, of course, the impact of the COVID-19 pandemic on both 2020 and 2021 medical claims expenses. I've added a new column which attempts to separate that out, though not every carrier does so, while some simply refer to the impact of COVID-19 in a fairly vague way.

(click image for higher-resolution version)

Back in late July, the Colorado Insurance Dept. released the preliminary 2021 Individual and Small Group Market rate filings. At the time, they came in averaging around +2.2% on the individual market and +5.7% on the small group market.

The final/approved rates have recently been posted, and rates in both markets have been significantly cut down: Individual market rates are now averaging a 1.4% reduction while the increase on the small group market is down to 3.8%.

Alabama

Via the Alabama Insurance Dept:

The Alabama Department of Insurance (ALDOI) has approved the final 2021 premium rates for the Affordable Care Act Individual Market in Alabama. The rates will be effective on January 1, 2021. The two carriers in the Alabama individual market are Blue Cross Blue Shield of Alabama (BCBS) and Bright Health Insurance Company of Alabama (BHIC). In general, rates for BCBS increased five percent and rates for BHIC increased 22 percent. The actual rates and the supporting material may be found by clicking on the links below.

Unfortunately, the linked documents are still redacted and thus don't include the enrollment numbers for Bright (and this press release says nothing about the small group market), but as far as I can tell this doesn't change the averages of either market much from the preliminary filings. Assuming Bright still only has a tiny part of the market, even its 22% average increase doesn't move the needle much.

My 2021 Rate Change project isn't complete yet for two reasons: First, I only have the final/approved 2021 rate filings for 18 states as of today (vs. preliminary rates for all 50 states + DC). Second, a higher-than-usual number of carriers have made it impossible (or at least highly difficult) to dig up their effectuated enrollment data for 2020.

Without that number, I have no way of running weighted averages for that state's individual market; those are listed in grey below. In a few cases (like Florida), the state insurance dept. actually provided the weighted average but I still had to guess at the total enrollment number (also in grey).

This is a bigger problem than you might think. Let's say a state has 3 carriers requesting a 5% rate reduction, a 2% increase and a 15% increase. The unweighted average would be +4%....but if it turns out that the first carrier holds 90% of the market share this year, the weighted average would be more like -4%. You see the problem here.

At long last, I've finally wrapped up my 50-state (+DC) 2021 Rate Change project...or at least the preliminary rate filings; I have the final/approved rate changes for 18 states as of this writing.

I'm finishing things off with New Jersey, and unlike the past half-dozen or so states, I am able to run a properly weighted average for both the individual and small group markets in the Garden State even though, like many other states, the actuarial memos are either unavailable or heavily redacted.

I'm able to do this thanks to NJ's policy of providing public quarterly reports tracking their individual and small group market enrollment, including breakouts by carrier (they also break it out by metal level, HMO vs. PPO and so forth, which is awesome for data wonks).

In any event, based on the Q2 2020 report (which includes enrollment data updated through the end of June), 2021 enrollees in New Jersey's individual market are looking at average premium increases of around 4.1%, while small group plans are going up by roughly 2.6% on average.

Massachusetts, which is arguably the original birthplace of the ACA depending on your point of view (the general "3-legged stool" structure originated here, but the ACA itself also has a lot of other provisions which are quite different), has ten different carriers participating in the individual market. MA (along with Vermont) has merged their Individual and Small Group risk pools for premium setting purposes, so I'm not bothering breaking out the small group market in this case.

Getting a weighted average is tricky. On the one hand, only one or two of the rate filings included actual enrollment data. On the other hand, the Massachusetts Health Connector puts out monthly enrollment reports which do break out the on-exchange numbers by carrier. This allowed me to run a rough breakout of on-exchange MA enrollment. I don't know whether the off-exchange portion has a similar ratio, but I have to assume it does for the moment.

Louisiana joins the disturbingly-long list of states where the 2021 individual & small group market rate filings are either completely missing or heavily redacted, thus making it impossible for me to break out the market share by carrier and thus running a weighted average rate change.

I really hope this trend is reversed in the future, whether via HHS transparency regulations or through legislation.

In any event, the unweighted average rate increase for the Louisiana indy market is around 6.9%, and for the small group market it's roughly 5.2%.

Once again, I'm afraid the actuarial memos for Kansas' 2021 individual and small group market carriers are either absent or redacted, so I have to run unweighted average rate changes, which are likely off significantly (for instance, the individual market is +7.8% unweighted, but if it turns out that, say, Oscar Insurance has 95% of the market share, the weighted average would be more like a 7% decrease).

Unfortuantely, without knowing the actual enrollment data for each carrier, this is the best I can do for now. The small group market's unweighted average increase is 8.2%.

(sigh) Once again, I only have actual enrollment data for a one of the five carriers offering individual market policies in Illinois next year, and for two of the eleven selling small group plans. That means I can't run a weighted average rate change for either market, just unweighted ones.

That being said, the unweighted average change on the individual market is a 1.8% premium reduction, while the small group market is increasing by 5.2%.

Unfortunately, Alaska's 2021 rate filings aren't available via the state insurance department website or the SERFF database, and the actuarial memos posted to the federal Rate Review database are heavily redacted, so I can't run a weighted average rate change for either the individual or small group market.

The unweighted average changes, however, are a 2.0% reduction on the indy market and a 1.9% reduction for small group plans.

Here's North Dakota's 2021 individual & small group market rate change filings. Note that all of the small group filings are heavily redacted and the memos aren't available in the SERFF database for any of them, so I can't run a weighted average and had to go with the unweighted 5.0% increase.

For the individual market, Blue Cross Blue Shield's memo isn't available, so I had to plug in an estimate based on the average 2019 enrollment; I'm assuming it's fairly close to that this year as well. Weighted average on the indy market is a 7.4% increase.

Pages

Advertisement