The very first bullet starts off ripping on the 37% average rate hike on benchmark Silver plans...
Benchmark Premiums: The average monthly premium for the second-lowest cost silver plan (SLCSP), also called the benchmark plan, for a 27-year-old increased by 37% from plan year 2017 (PY17) ($300) to PY18 ($411).
Premium Growth: For the first time, annual growth in the average monthly premium available to a 27- year-old for the SLCSP, at 37%, outpaced that of the lowest-cost plan (LCP), at 17%.
Of course, there's pretty obvious reason for that: Trump's cut-off of Cost Sharing Reduction (CSR) reimbursement payments. The ASPE report does go into this, but not until Page 6. Meanwhile, it's immediately undermined anyway (at least regarding subsidized enrollees) in the very next bullet:
With the 2018 Open Enrollment Period coming up just 5 days from now, it's time to put this to bed: After 6 months of painstaking research and analysis, I've compiled a comprehensive analysis of the weighted average rate changes for unsubsidized ACA-compliant individual market policies in 2018, including both the on- and off-exchange markets. It's already been confirmed by a different analysis by healthcare consulting firm Avalere Health, which used a completely different methodology to arrive at the exact same conclusion: The national average increase isbetween 29-30%, ranging from as low as a 22% average premium drop in Alaska(thanks to their successful reinsurance program) to as high as a painful 58% increase in Virginia.
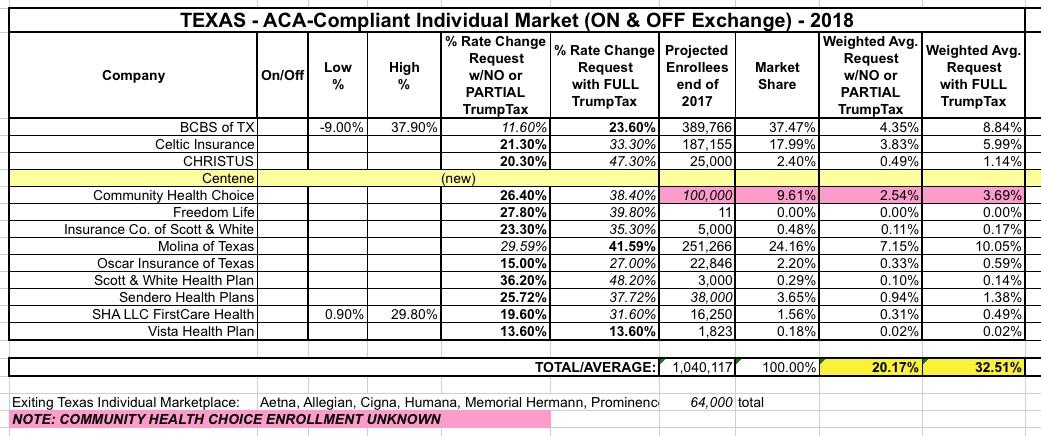
I've saved Texas for last because, frankly, I haven't been able to make heads or tails out of their actual average rate increases for next year (and unlike smaller states which might not move the needle on the national average anyway, Texas has one of the largest populations in the country, so a substantial error here can also impact the national numbers significantly).
Back in early August, I pieced together a rough average of the requested rate increases for the Lone Star State of around 20% if CSR payments are made or 32.5% if they aren't:
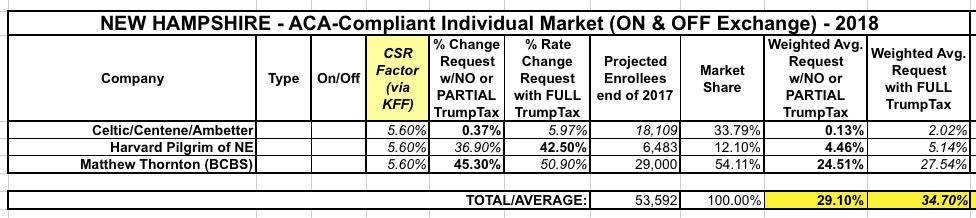
As noted earlier today, I've now managed to plug 48 states (plus DC) into my 2018 Rate Hike Project spreadsheet. This leaves just two states missing: New Hampshire and Texas. I'm still waiting to clarify some things for each, so this analysis could still change, but I really want to wrap this up, so here's what I have for New Hampshire right now:
When I first ran the numbers for New Hampshire'srequested 2018 rate increases, it seemed pretty straightforward: 3 carriers on the individual market. 2 listed rate changes assuming CSRs would be paid; one assumed they wouldn't. This gave the following:
With only 5 days to go before the launch of the 2018 Open Enrollment Period, time is rapidly running out for me to wrap up my 2018 Rate Hike Project. I started this, as I have for 3 years now, back in late early May with the very first requested rate changes out of Virginia, and have been tracking all 50 states as the summer and fall have passed, following every twist and turn of the insane repeal/replace circus in Congress, Trump's bloviating and blathering about "blowing things up" and "letting Obamacare explode", the last-ditch "Graham-Cassidy" sideshow and everything else, right up to and through Trump lowering the boom on cutting off CSR reimbursement payments.
I'm still missing final 2018 rate data for 6 states, but in the meantime I'm also doing some cleanup of some of the states I thought I already had final data for. Today both my home state of Michigan as well as Washington State released their official, approved increase tables.
However, I do give the Michigan Dept. of Insurance & Financial Services huge credit for making it incredibly easy for me to plug their data in. Look at that...they list all carriers, whether they sell on or off exchange, the exact average rate increases, and even include the number of affected enrollees, which is usually the hardest number for me to track down. Thanks, MI DIFS!!
Still, I don't like loose ends, and those 8 missing states are bugging me, so I still want to fill them in for completeness' sake. The only big state remaining is Texas, but I'm also missing Alabama, Hawaii, Iowa, Missouri, New Hampshire, Oklahoma and Wyoming.
A week or two later, the ASPE department of CMS issued a report putting the average at 22%...except that they were missing 7 states, only included benchmark Silver plans and didn't include off-exchange policies. The missing states had higher average premiums on the whole, so I'm pretty sure the actual overall average was pretty close to 24-25% in the end.