February Update: COVID Death Rates by Partisan Lean & Vaccination Rate (w/BIVALENT BOOSTER data)

NOTE: With the news that the Johns Hopkins University COVID Tracking project is shutting down on March 10th, this may be the second to last update to this project, although there are other outlets tracking county-level COVID deaths which will likely continue to do so.
As of this writing, 69.2% of the total U.S. population has completed their primary COVID-19 vaccination series (including 94.2% of those 65+), but a mere 15.8% of the total population has also gotten their updated bivalent booster shot. Even among seniors it's only at 40.8% nationally.
The bivalent booster has only been approved for all adults since the end of August, but that's still pretty bad 5 1/2 months later: By comparison, a full 56.3% of the U.S. population had gotten their 2nd vaccination dose by October 8th, 2021 (the exact same 5 1/2 months after the primary series was approved for all U.S. adults).
Since we're so far removed from May 2021, and since the primary vaccination series effectiveness wears off after some time, I've also added both the partisan lean and vaccination rate breakout since August 31, 2022...the day that the FDA authorized the bivalent booster for all U.S. adults.
As always, here's my methodology:
- County-level 2020 Population data via U.S. Census Bureau's 2020 Census
- County-level 2020 Trump vote data via each state's Election Commission or Secretary of State websites
- County-level Death data via Johns Hopkins University Center for Systems Science & Engineering for 49 states; NY Times COVID-10 in the United States github UT only
Remember: "Decile" means 1/10th or 10% of the total population (all 50 states + DC).
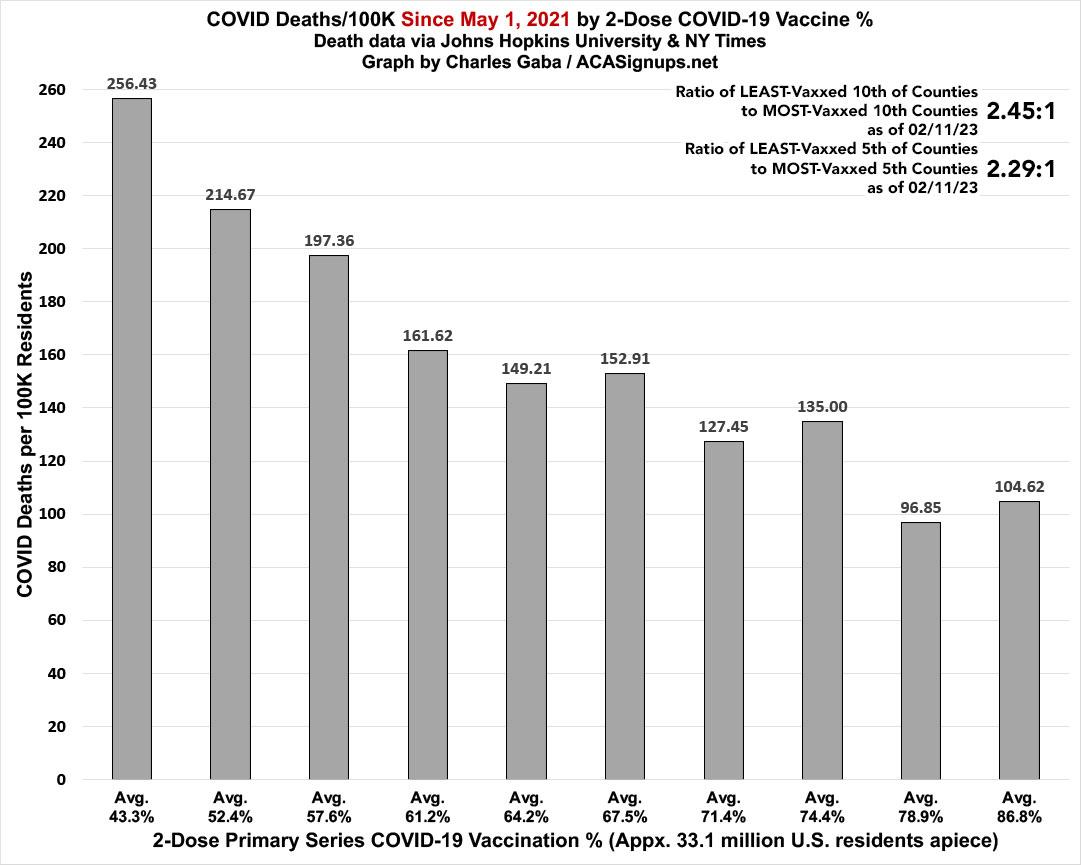
While it's dropped significantly since September, there's still a clear and dramatic correlation between how much of the population has been 2-dose vaccinated and its COVID death rate since May 1, 2021:
- The death rate since May 1st, 2021 in the least-vaccinated tenth is still 2.45x higher than the most-vaccinated decile.
- The death rate since May 1st, 2021 in the least-vaccinated fifth is still 2.29x higher than the most-vaccinated quintile.
Note: I've also started posting the ratio of the highest and lowest quintiles of the total population, since some may think that's more representative of the overall trend.
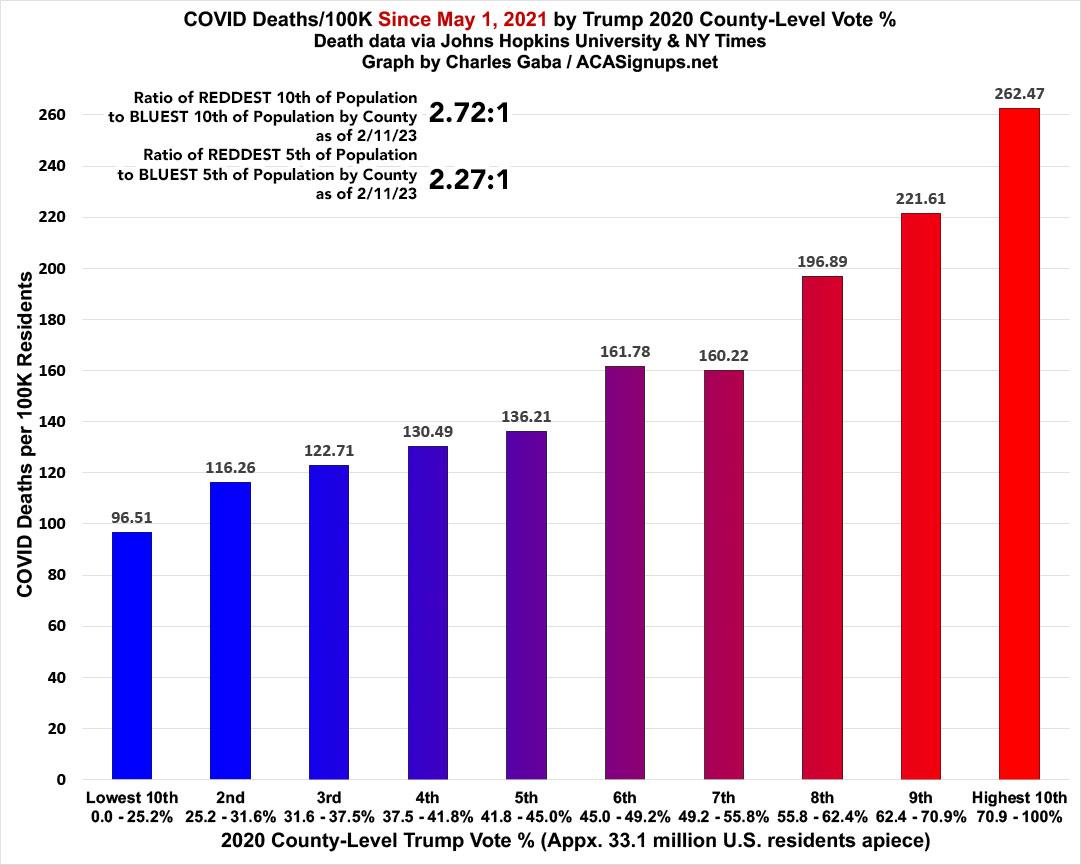
As always, what's even more disturbing is how closely the death rate by partisan lean matches the death rate by vaccination rate; they're almost mirror images of each other: Again, while the ratio has dropped since September:
- The death rate since May 1, 2021 in the reddest tenth of the country is still 2.72x higher than in the bluest decile.
- The death rate since May 1, 2021 in the reddest fifth of the country is still 2.27x higher than in the bluest quintile.
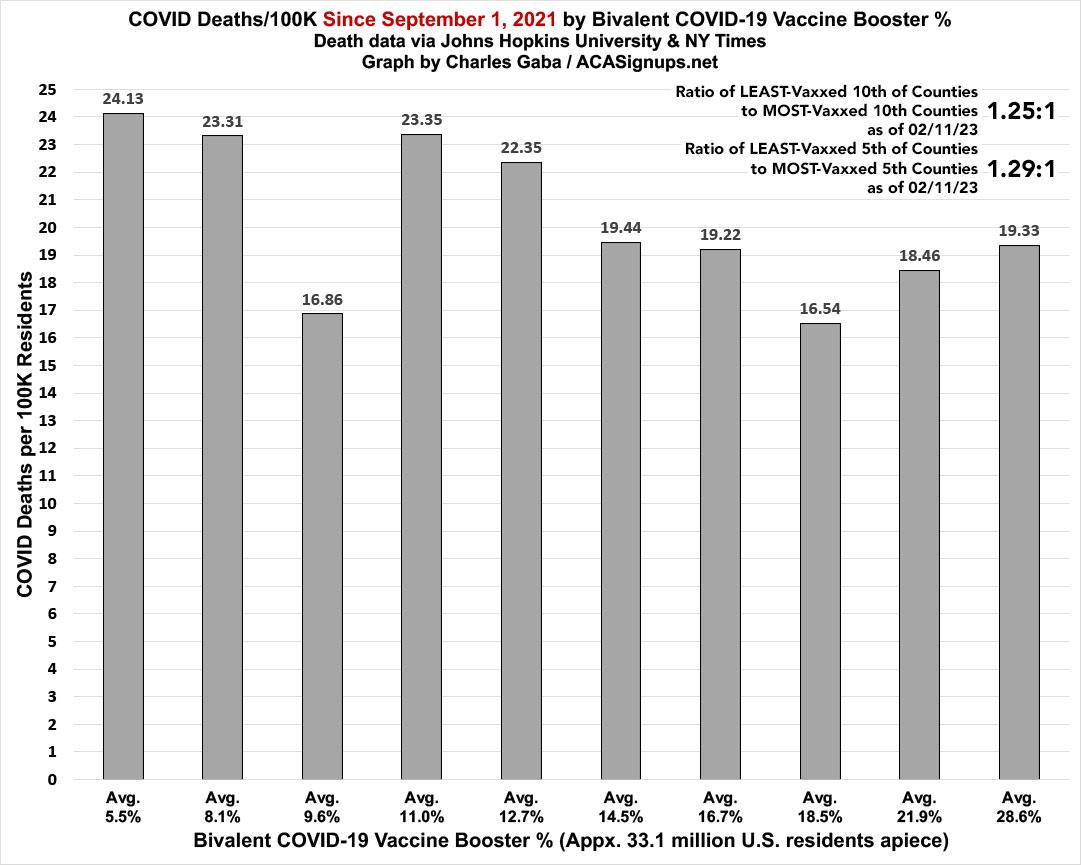
What about starting with the widespread availability of the bivalent booster on September 1st, 2022?
As expected, the slope is far less dramatic on both fronts:
- The death rate since 9/01/22 in the tenth of the U.S. with the lowest levels of up-to-date vaccinations (a pathetic 5.5% of the population) is only 25% higher than in the tenth with the highest up-to-date vaccination rate (a better but still not great 28.6% of the total population).
- The death rate since 9/01/22 in the fifth of the U.S. with the lowest bivalent uptake is 29% higher than the fifth with the highest.
The 3rd bracket also makes for an interesting exceptions--the 9.6% vaccinated bracket actually has the second-lowest death rate since August, though this is up from last month:
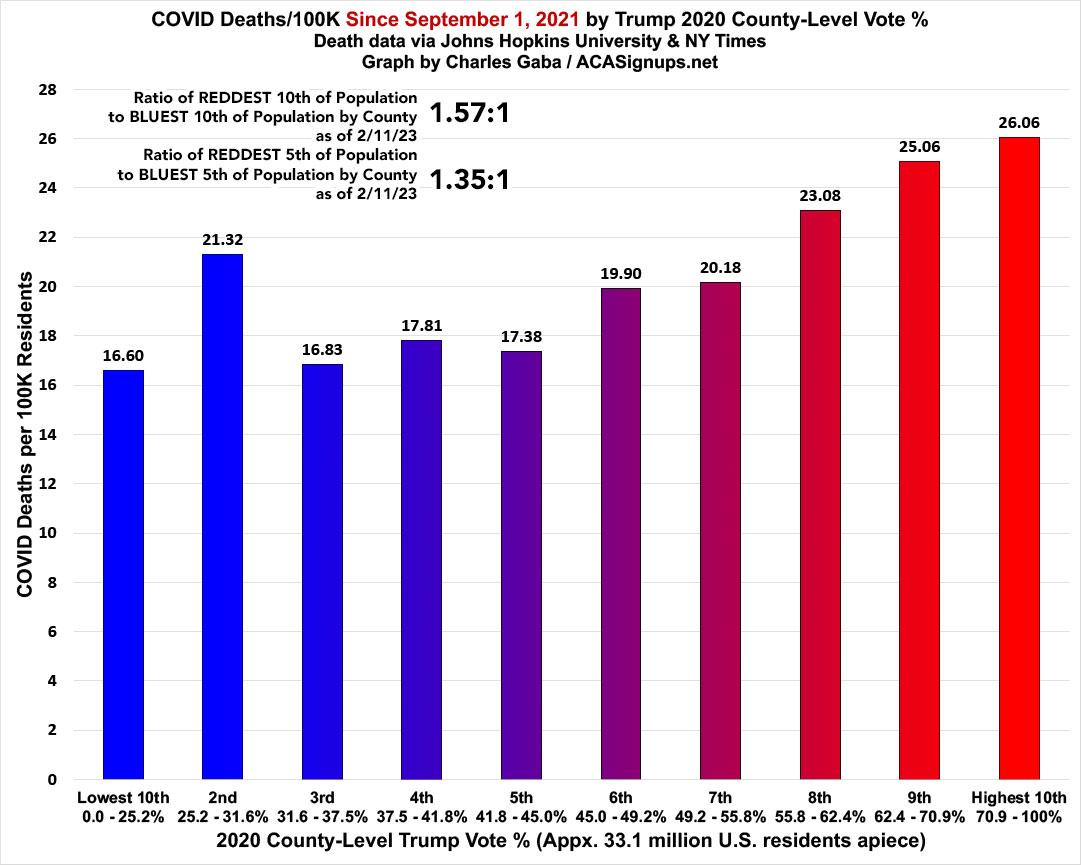
In terms of the partisan divide, this has indeed also shrunk dramatically, with the death rate since September 1st down to just 57% higher (vs. 63% higher last month) in the reddest tenth of the country compared to the bluest tenth. If you were to compare the reddest fifth of the U.S. vs. the bluest fifth, it would be more like a 1.35:1 ratio:
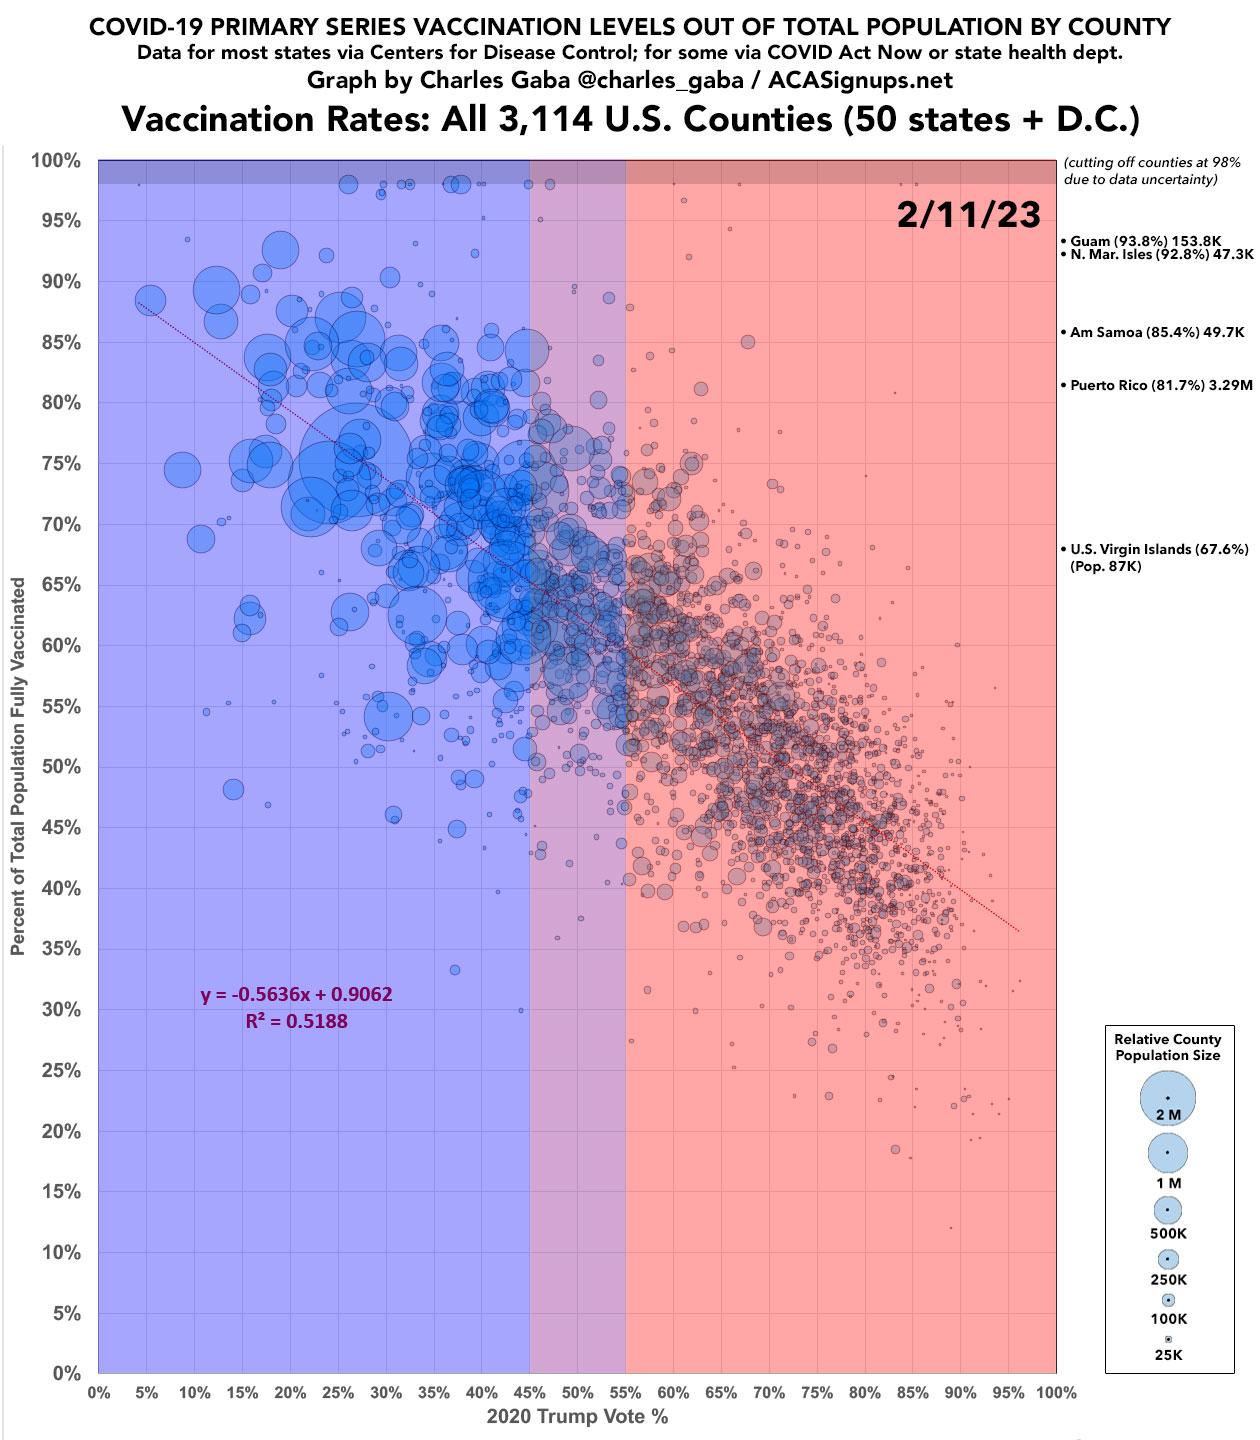
While I'm at it, I haven't updated my scatter plot graph of the partisan vaccination gap since last September, so here you go:
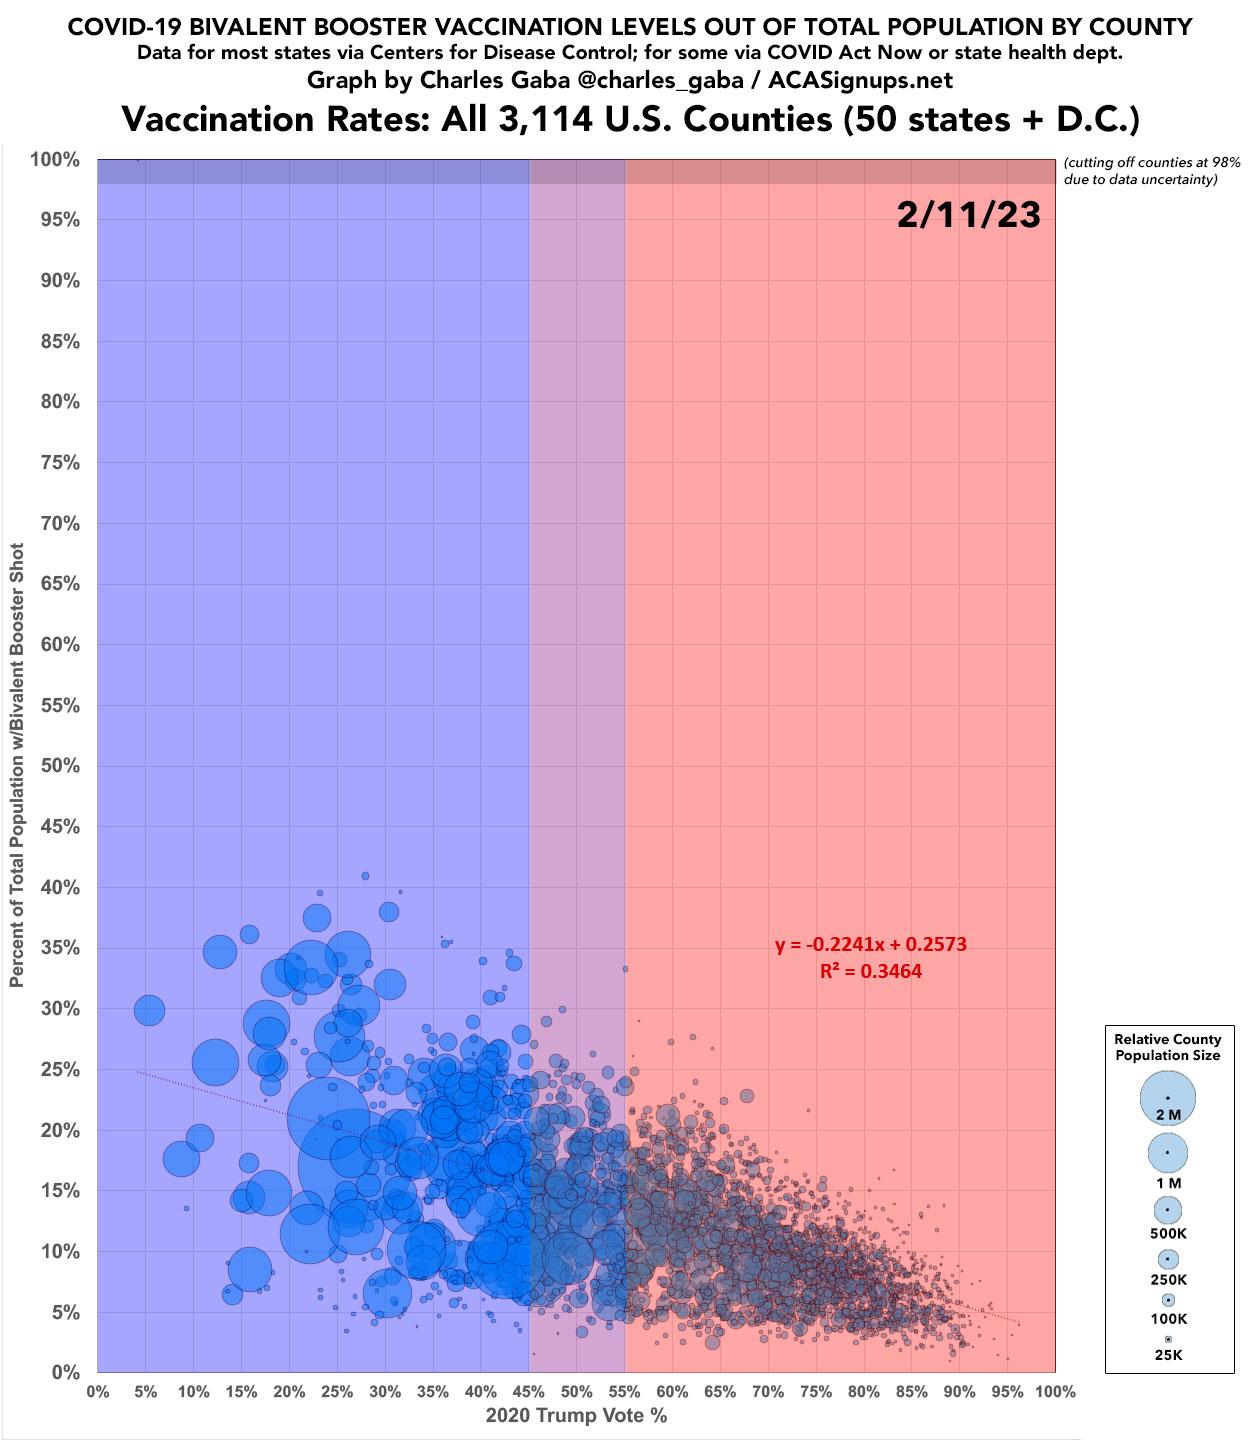
...and here's the same graph showing the bivalent booster shot levels. As you can see, the pattern is developing exactly as the original series did, just at a slower pace:
In short: Get Vaxxed, Get Bivalent Boosted, and wear a mask when indoors in crowded public locations.


