

MLR Rebates: So how accurate was my analysis in the end? (Update: Mystery Solved!)
Thu, 10/10/2019 - 1:55pm
I honestly thought I was done with my 2018 MLR Rebate project, which ate up most of my time in early September, but there's one more post to write about it.
As you may recall, I managed to acquire all 2,700 MLR template filing spreadsheets from the CMS website a solid month before the data was made available to the public. After spending countless hours digging through them and compiling the data on a state-by-state basis, I concluded that the final breakout was as follows:
- Individual Market: $769 million in rebates being paid back to 3.34 million ACA enrollees
- Small Group Market: $312 million in rebates being paid back to 2.96 million enrollees
- Large Group Market: $290 million in rebates being paid back to 2.31 million enrollees
- TOTAL: $1.37 billion in rebates being paid back to 8.61 million enrollees nationally
Well, a few days ago CMS actually published the official 2018 MLR rebate report.
I decided to run a side-by side comparison to see how I fared. On the Small and Large Group markets, I was pretty damned close:
- Small Group Market: I was short by just 0.4% on both the total rebate amount ($1.36 million) and the number of recipients (12,000).
- Large Group Market: I was short by just 0.1% on the total rebate amount ($348,000) and by 1.6% on the recipients (35,000)
On the Individual market things were a little different. I was amost dead-on accurate for the total dollar amount (off by just 0.1% nationally, or $544,000 out of $769 million total), but I was off by nearly 10% on the number of enrollees eligible for subsidies.
I decided to run a side-by-side comparison of my estimates vs. the official totals, and the results are...curious:
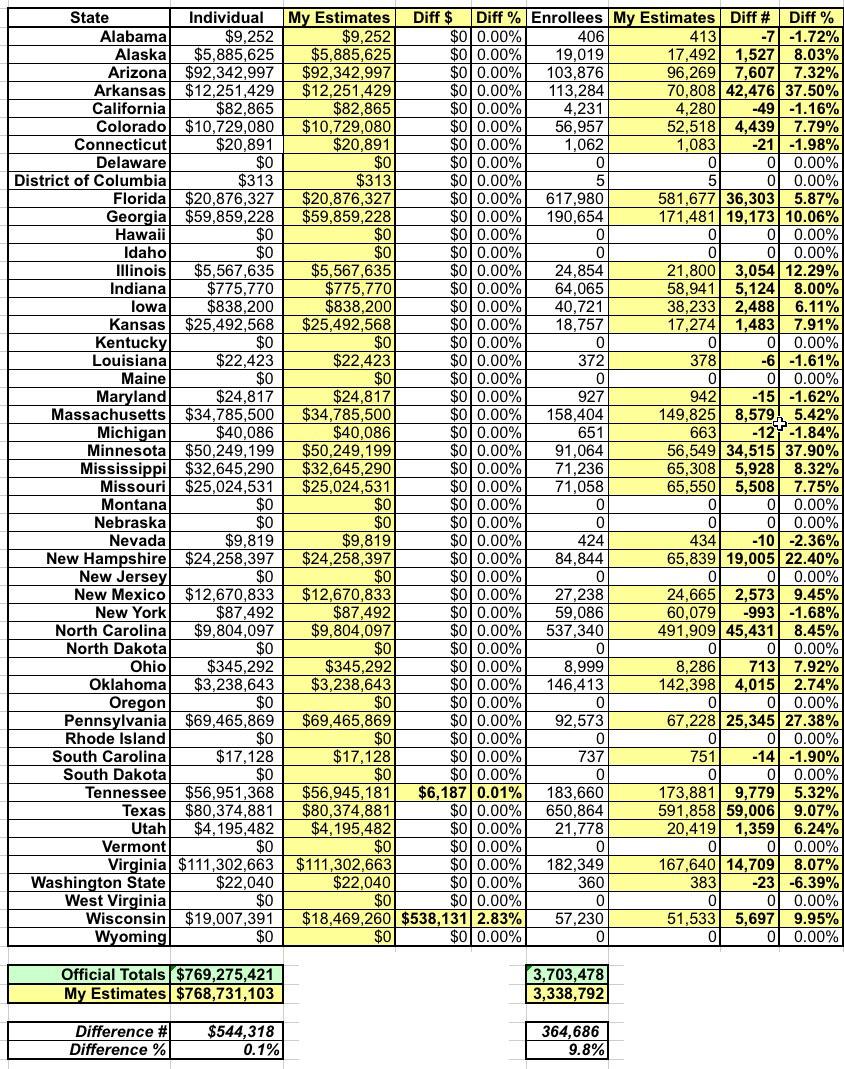
As you can see, the missing $544,000 was limited to two states: A nominal $6,000 in Tennessee and half a million dollars in Wisconsin. I'll have to take a look at my Wisconsin spreadsheet to see where that was missed.
For the number of eligible enrollees, however, I clearly did something wrong. There's a discrepancy in over 2/3 of the states...and the ones where I was 100% accurate are only because no one received any subsidies this year. There's 6 states where I was off by 10% or more:
- Arkansas: Short by 37.5%
- Georgia: Short by 10.1%
- Illinois: Short by 12.3%
- Minnesota: Short by 37.9%
- New Hampshire: Short by 22.4%
- Pennsylvania: Short by 27.4%
Interestingly, while there's some states where I was over as well, those are almost all nominal amounts (less than 100 people per state). I was off by 993 in New York, but even that's still less than 2% of the total.
Nationwide, I managed to miss 365,000 rebate recipients, 9.8% of the total. Huh. The only thing I can figure is that I was plugging the wrong data field into my spreadsheet from the MLR template files. I'll have to figure out where I made the mistake and correct that for 2020.
So in the end, I was 99% accurate in 5 out of 6 categories...but only 90% accurate in the sixth one. Still not bad.
UPDATE: Ah-hah! I've solved both mysteries already!
The issue with the Tennessee and Wisconsin dollar amounts was simple: Blue Cross Blue Shield (Tennessee) and Common Ground Healthcare Co-Op (Wisconsin) each submitted a revised MLR filing after I downloaded the original version, which included a higher MLR dollar amount.
The way-off Enrollee numbers are due to a very simple but pretty understandable mistake on my part. Here's what the relevant section of the template form looks like (I'm using a carrier from Minnesota, since that's the state where I was off by the highest percentage):

I was using "7.2 Number of Covered Lives" as of 12/31/18 as the number of eligible enrollees by mistake. I was supposed to be using "7.5 Number of Life-Years" instead...which is almost always somewhat higher.
The problem with "Covered Lives" is that it doesn't include anyone who was enrolled earlier in the calendar year but dropped their coverage before December 2018.
"Life-Years", on the other hand, takes the total number of months that anyone was enrolled in an effectuated policy ("Member months" right above it) and divides that by 12. So, if one person was enrolled for the first six months of the year but then dropped out, and another person was only enrolled for the second half of the year, that's the equivalent of a single "Life-Year".
More importantly, if someone was only enrolled from January through, say, September, they would count as 3/4 of a LIfe-Year, but they wouldn't show up as the number of Covered Lives as of 12/31/18.
I suppose I could go back and update/correct all 51 of my blog entries, but it seems like an awful lot of work at this point. I'll just have to keep it in mind for next year.
The main impact of this correction is that it means the total number of people who received MLR rebate checks is around 11% higher than I thought...but the average rebate check is 10% lower ($208 apiece instead of $230).
Advertisement
