

CBO: 1.4 million Americans have lost healthcare coverage since 2016. ACA 2.0 would fix that & far more.
Mon, 04/29/2019 - 12:49am
I'm a little late to the party on this one, but a week or so ago, the Congressional Budget Office released their own report breaking out estimates of just how many Americans have different types of major helathcare coverage (public or private) for each of the past four years (2015 - 2018).
Their conclusions show a far less dramatic change compared to the survey released by Gallup back in January, which claimed that the uninsured rate for adults over 18 increased from 10.9% at the end of 2016 (just as President Obama left office) to 13.7% at the end of 2018. Based on their estimates, that amounts to around 6.8 million adults losing coverage over that time...and that doesn't include children, so the Gallup estimates, if accurate, would top 7 million people losing coverage.
Instead, the CBO report shows a far lower, but still troubling, trend since the day Donald Trump took office:
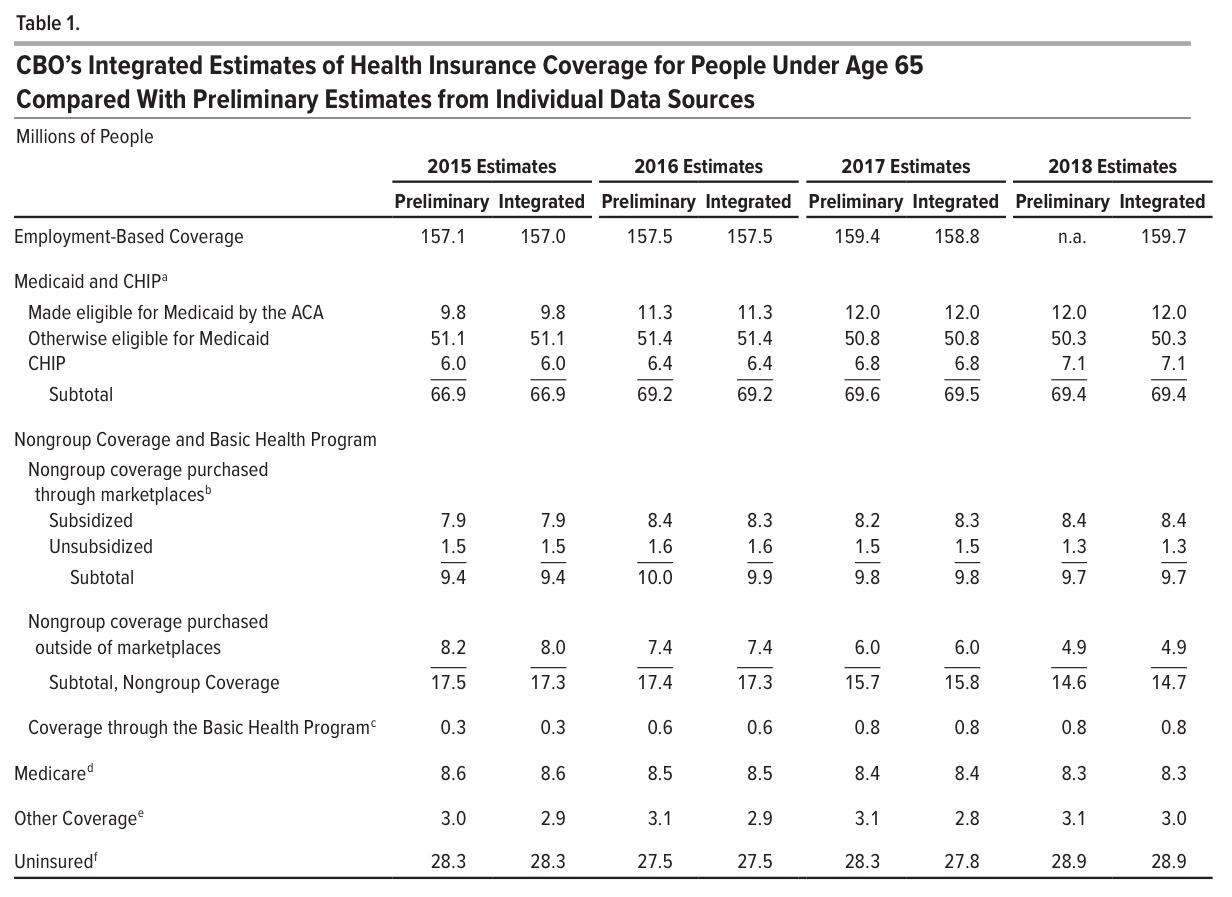
According to the CBO, the uninsured rate nationally dropped to around 27.5 million people in 2016...an all-time low...before starting to crawl back up again since then. In 2018, they peg the number without healthcare coverage (as defined by the CBO...see below for more) at 28.9 million nationally, a net increase of 1.4 million people.
It's important to note that the types of healthcare coverage have fluctuated. Employer coverage is actually up 2.2 million since 2016, which makes sense as unemployment continued to drop. By the same token, non-ACA CHIP dropped around 400,000 enrollees, but ACA Medicaid expansion has increased by 700,000, mostly due to several additional states expanding the program.
Average monthly exchange-based coverage has dropped, but not as much as the official Open Enrollment numbers numbers might suggest (from 12.7 million to 11.8 million), and Basic Health Plan enrollment in NY & MN has increased by around 200K.
No, the biggest drop comes from exactly where I'd expect it to: Unsubsidized (mostly off-exchange) individual market plans. They'v shrunk from 9.0 million enrolled in 2016 to just 6.2 million in 2018. That's a drop of 2.8 million people, and I'm sure this trend has only accellerated in 2019 now that the ACA individual mandate has been repealed in 48 states.
Off-exchange indy enrollment was already dropping even before that, of course...but some of that was simply due to people shifting from the off-exchange to on-exchange market. Something far more dramatic happened in 2017 and 2018, however, and the reason is pretty obvious: Unsubsidized premiums for ACA-compliant plans simply shot up so much that many of those earning more than 400% of the Federal Poverty Level (FPL) simply could no longer afford to pay full price for the policies, so either shifted to some type of non-ACA policy (most, but not all of which I'd categorize as basically "junk plan status"), or dropped any type of healthcare coverage altogether.
This is precisely why passing the ACA 2.0 bill has become so vitally important: Removing the 400% FPL subsidy eligibility cap is essential in order to prevent and reverse the attrition of middle-income enrollment.
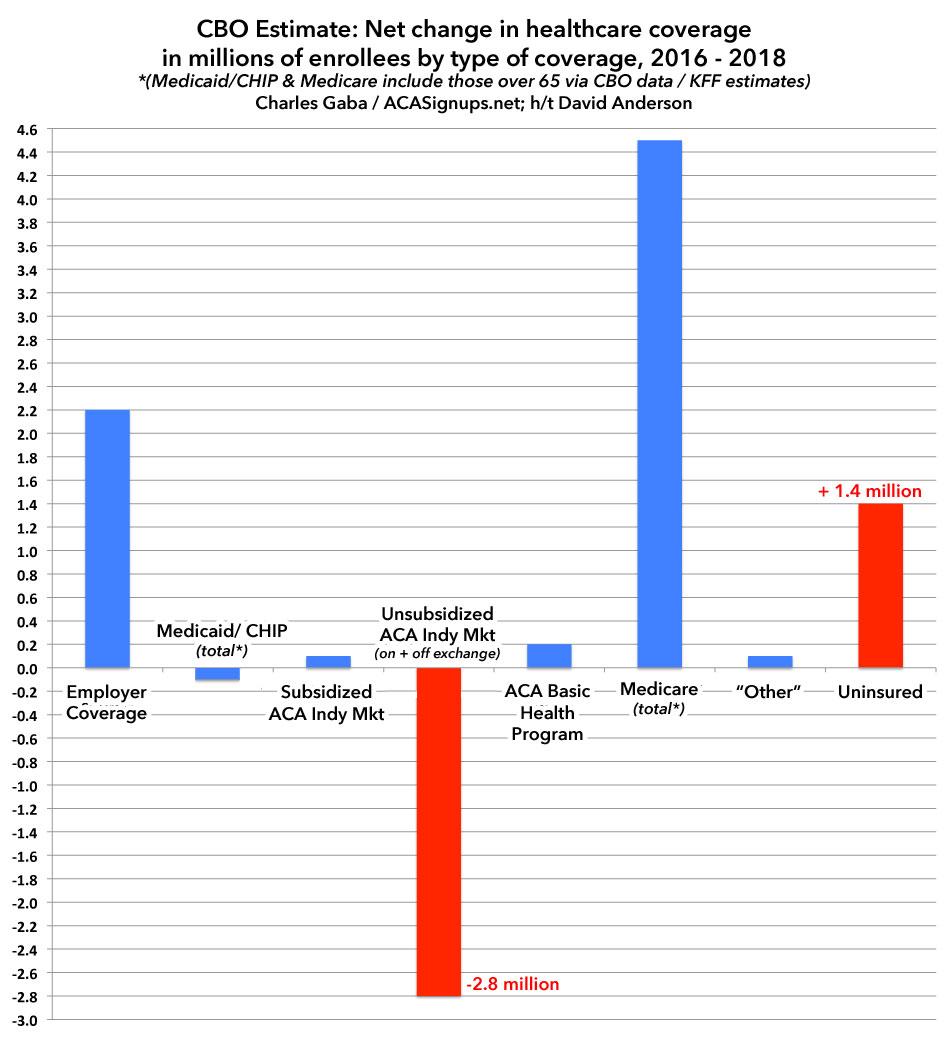
Dave Anderson gave me the idea to post these numbers in a graph to make the contrast more obvious. Since the CBO report only includes people under 65, I've replaced the Medicaid/CHIP and Medicare columns with the hard numbers from CBO and Kaiser Family Foundation data to paint a more complete picture. This still isn't quite right since some people over 65 also have Employer or Individual Market coverage, but it should be pretty close (only around 100,000 ACA exchange enrollees are over 65 each year anyway, so slight variances there wouldn't move the needle either way):
On the surface, it may seem like the 1.4 million increase in the uninsured makes no sense...thanks to over 65 Medicare enrollment being included, the various categories add up to a net increase of 4.2 million people being covered. However, keep in mind that the total U.S. population also increased by around 4 million people from 2016 to 2018. When you account for that and the other missing data (>65 with employer coverage, etc), it's easy to see where another 1-2 million people get lost in the shuffle out of ~327 million total.
There's some other really important language in the report itself, having to do with how the CBO defines "health insurance coverage":
An important function of insurance is to provide financial protection against high-cost, low-probability events (such as car accidents, fires, or floods). Consistent with that notion, in the context of health care costs, CBO broadly defines private health insurance coverage as a policy that, at a minimum, covers high-cost medical events and various services, including those provided by physicians and hospitals. This type of coverage is often referred to as comprehensive major medical coverage. The agency grounds its coverage estimates on that widely accepted definition, which encompasses most private health insurance plans offered in the group and nongroup markets.
CBO’s definition of private insurance coverage covers plans that must comply with the regulations governing the group and nongroup markets as well as coverage that is exempt from such regulations but that nonetheless provides comprehensive major medical coverage. For example, short-term, limited-duration policies are exempt from regulations governing the nongroup market, but some are included in CBO’s definition of private insurance if they provide major medical coverage. The definition may also include plans with very high deductibles. The desirability or adequacy of such coverage will vary on the basis of people’s preferences, income, and assets, but that does not change CBO’s definition of coverage.
This is important, and is why, while I often speak disdainfully of short-term, limited-duration policies (#ShortAssPlans), I nevertheless do try to distinguish them from "junk plans". In many cases they are junk, but in some cases the problem isn't with what the short-term policy covers, but rather who is eligible for them. That is, they might be pretty comprehensive...but only if you're allowed to enroll in them at all.
CBO’s definition of private insurance coverage excludes policies that do not provide comprehensive major medical coverage. Examples include the following: policies with limited insurance benefits (known as mini-med plans); some types of short-term, limited-duration policies; “dread disease” policies that cover only specific diseases; supplemental plans that pay for medical expenses that another policy does not cover; fixed-dollar indemnity plans that pay a predetermined, lump-sum payment in the event of an illness or hospitalization; health care sharing ministries that are not insurance but rather cooperatives through which members pay one another’s bills; and single-service plans, such as dental-only or visiononly policies.
The exclusion of "sharing ministries" due to the fact that they're literally not defined as insurance at all is interesting for a couple of reasons. First, because supposedly there's over a million people now enrolled in them...but also, if the CBO doesn't count sharing ministry enrollees as being covered, what does that mean for those enrolled in Farm Bureau health plans, which also aren't legally defined as health insurance? The CBO report makes no mention of these whatsoever, even though 170,000 Tennesseeans are enrolled in them today and presumably several tens of thousands of Iowans are as well.
Advertisement
