

UPDATE: OUTREACH MATTERS: 16 states broke last year's numbers. 11 are SBMs.
Thu, 01/18/2018 - 12:11pm
UPDATE: Arrrrgh!!! Literally moments after I went live with this, Hannah Recht pointed out to me that the Washington Health Benefit Exchange has (unofficially) posted their (rough) final 2018 enrollment numbers via an internal slideshow presentation. The table and all numbers below have been updated to reflect the additional 8,800 enrollees added in WA over the final few days of its enrollment period.
UPDATE 1/22/18: Covered California has just issued a major update to their enrollment data, adding another 122,000 QHP selections to the national tally. Everything below has been updated to include this.
UPDATE 1/28/18: The deadline for Massachusetts has passed and they've posted their final numbers. Everything below has been updated to reflect this update.
UPDATE 1/29/18: Vermont's final enrollment numbers have been sort of posted; they're a bit messy as explained here. Depending on your POV, they appear to be down either 1% or 11.3% from last year.
UPDATE 2/01/18: New York's final enrollment numbers have been posted and added to the table below: Up 4.2% year over year, and BHPs are up 11%.
UPDATE 2/04/18: California hasn't reported their final numbers yet, but they were only 15,000 shy of breaking last year's total as of 1/21. Considering that their most recent press release stated that "tens of thousands" of people were expected to sign up on the final day in addition to however many enrolled in the prior 9 days, I'm quite confident that they did indeed break last year's total, bringing the number of states which did so up to 17, of which 12 are either SBMs or FF-SBMs. I presume they'll announce their final total sometime Monday, Feb. 5th.UPDATE 2/7/18: OK, I have the final official numbers from California, as well as D.C. (which I'll write about in a moment) and slight corrections from MD and VT. In the end, California did NOT exceed last year after all, for the same reason Maryland didn't: Active Silver Switcharoo promotion. I'll write up more about this in a separate post as this one is getting way too confusing, but in the meantime I've updated the table below.
Just moments ago I posted updated 2018 Open Enrollment numbers for New York State of Health (their ACA exchange). With two weeks left to go (NY, along with CA and DC all stuck with the standard 3-month period this year), New York has become the fifteenth state to actually surpass their 2017 Open Enrollment numbers.
Given the sheer volume of sabotage, undermining and confusion which was thrown at the Affordable Care Act by the Trump Administration and the Congressional GOP over the past year, this is astonishing.
Again, four three one exchanges (New York, the District of Columbia, Massachusetts and the Big One, California, are is still open for people to #GetCovered through either Jan. 23rd (MA) or Jan. 31st (the other three) February 5th, and I only have incomplete data for two one other states (Washington, which ended enrollment a few days ago, and Vermont, which didn't extend their enrollment period at all but also hasn't released an enrollment update since...December 2nd). It's still possible that up to 3 2 1 more states could break last year's figures for a total of up to 18 of them.
Here's an updated version of the state-by-state breakout (click the table for a more readable version).
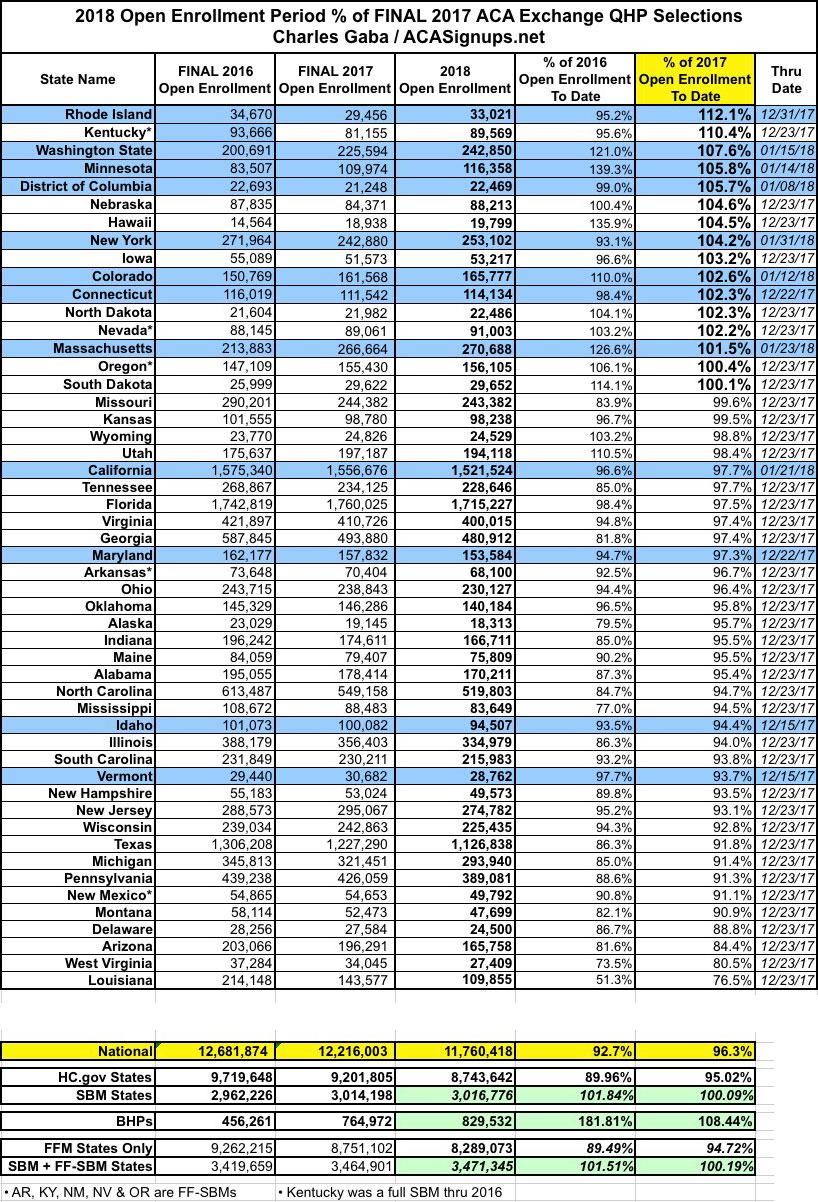
If you read this site regularly, you'll notice that the table above includes a few extra columns and rows compared to prior versions. The extra columns simply note the special circumstances for some states (hurricane/windstorm Special Enrollment Period, noted in yellow) and the final official Open Enrollment Period deadline (ok, unofficial in the case of the hurricane SEP states, anyway). I really don't expect SEP to tack on more than nominal amounts to those states, however; perhaps a few thousand collectively.
More importantly, there's still anywhere from 13 to 47 days worth 10-28 days worth of enrollment data missing across the states mentioned above.
The states have been sorted by how their 2018 Open Enrollment Period performance compares to 2017's (I also threw in 2016 for the heck of it, since that represents the highest national total ACA exchange enrollment to date).
The main thing to note is that of the fifteen sixteen states which have exceeded last year's totals, seven eight of them use their own full state-based marketplaces (SBMs). Why is this significant? Because unlike most HealthCare.Gov states which rely on the Centers for Medicare & Medicaid (CMS) to provide their advertising/outreach budget, the SBMs have their own marketing/advertising/outreach budgets, branding and programs.
CMS infamously slashed the advertising/marketing budget for HealthCare.Gov by 90% and the navigator/in person outreach budget by 40% this year while also slashing the Open Enrollment Period itself in half (actually more than "in half"...from 92 days down to 45, or about 49%)...and those 39 states ended up collectively enrolling 5% fewer people this year than last.
Meanwhile, the other 12 states (SBMs) are already within 5.7% 0.1% of their 2017 numbers, and that's with a lot of data still missing from five of them. have SURPASSED their 2017 numbers slightly, and that's with data still missing from several of them.
But there's still more: There are 5 states which are hosted by HealthCare.Gov (Arkansas, Kentucky, Nevada, New Mexico and Oregon) but which are still operated as State-Based Marketplaces. That is, they utilize HC.gov as their technical enrollment platform...but they still have control over their own budgets, ad/marketing/ outreach programs, negotiations with the insurance carriers in their states and so forth. These are referred to as "Federally-faciitated State-based Marketplaces" or FF-SBMs. Three of these (Kentucky, Nevada and Oregon) also beat last year's numbers...and Kentucky in particular blew 2017's numbers away by over 10% (second only to Rhode Island in year over year improvement).
If you include these with the 12 "full" SBMs, it's actually ten eleven of the fifteen sixteen outperforming states which are State-based. And of course, when the final numbers roll in from CA, MA & VT, it's conceivable that up to 13 out of 18 total outperformers could be SBMs or FF-SBMs.
As you can see from the last two rows (FFM only / SBM + FF-SBM), the contrast is even higher: 94.7% of last year's totals for FFM states vs. 96.5% and counting 100% and counting for SBM/FF-SBM states. And again, if at least 122,000 more enrollments (or 126,000 if you only "count" the 12 full SBMs) if just 4,000 are added in by the time the dust settles (mostly from CA, of course), it could end up as high as 100% or more on the SBM side.
So, what does this tell us? Well, having a longer enrollment period obviously helps to some degree. This is difficult to measure since the extensions were all over the place, from as short as one week (CT/MD) to as long as seven weeks (CA/DC/NY). Maryland still came up slightly short, but Connecticut broke last year's number. Idaho came up short and Vermont may still do so...but they're also the only two SBMs which didn't extend their deadlines, which is also noteworthy. We won't really know for sure how big a difference this makes until the final numbers are in, of course.
OK, but Kentucky, Nevada and Oregon didn't extend their deadlines (since they're all on HC.gov), so how did they still manage to outperform...especially Kentucky?
Well, I assumed that the main reason for KY's success this year was that it was a simple one-time "correction" from last year, when their enrollment dropped by more than 13% as they transitioned from a full SBM (using the "kynect" website) into a FF-SBM (shifting to HC.gov's platform). All KY enrollees had to start from scratch with brand-new user accounts, navigating an unfamiliar user interface and so on, and couldn't be auto-renewed, which no doubt led to some confusion and drop-off. This year they didn't have to deal with any of that and current enrollees were presumably auto-renewed for the most part, so I figured that accounted for the bounceback.
HOWEVER, yesterday I had a conversation with the Acting Executive Director of the Kentucky Health Benefit Exchange (KHBE), John Watkins, who said that he actually doesn't think my "bounceback correction" theory was the cause at all.
According to Watkins, Kentucky did a couple of things this year that were unique among the ACA exchanges. The biggest point he stressed is that they established direct response outreach communication--that is, they directly contacted 95% of both current and past enrollees (that is, people who had previously been enrolled in KY ACA exchange policies but had dropped out at some point in the past) in the week before Open Enrollment started, and then again weekly throughout the Open Enrollment period, to hammer home the critical info (deadlines, financial assistance available, enrollment events, assistance info, etc). In addition, Watkins said that they established an overhauled, "one-stop shop" one-click splashpage with quick links to key info. Finally, Kentucky utilized an "opt-out" messaging/notification program instead of an "opt-in" program...people had to actively choose not to be sent alerts/etc instead of actively choosing to be notified.
The point is that hand-holding, one-on-one outreach and so forth do make a difference. On the surface, the difference between coming in 5% short and dead even doesn't look like much...but that's up to 500,000 people.
Of course, this isn't an exact rule. Maryland came up short in spite of have a (slightly) longer enrollment period and being a full SBM, while 4 FFM states (Nebraska, Hawaii, Iowa, North Dakota and South Dakota all managed to beat last year (if ony by a handful in the case of SD) even with the half-length time window. And there's no guarantee that VT, MA or CA will hit 100%+.
However, the numbers still speak for themselves:
- 11-13 out of 18 SBM/FF-SBMs beat last year (56% - 72% of them)
- Only 5 out of 33 FFM states beat last year (15% of them)
Meanwhile, at the opposite end of the spectrum, I'll just repeat my conclusions about Louisiana from last week:
Louisiana: Louisiana was among the many states which Silver Loaded CSR costs, which should have helped with enrollment; even if it didn't, most of the other states which utilized Silver Loading came much closer to last year's total. They only have 2 carriers on the exchange, but the same is true of many other states; their unsubsidized premium increases are steep (21%) but actually somewhat lower than the national average (30%).
LA expanded Medicaid halfway through 2016, which did have a huge impact last year (enrollment plummeted by a solid 33% from 2016 to 2017 as a result). I had been assuming that this wouldn't still be a factor by now...but the additional 24.5% drop gives me pause.
This year Louisiana enrollment is down another 33,722 people. LA's Medicaid expansion enrollment is up to 457,178 as of yesterday, which is over 83,000 people higher than December 2016. Assuming it would "normally" be down around 5% (7,200), the Medicaid expansion effect could account for the "additional" 26,500 shift, although this is speculative. Assuming that's not the cause...I'm stumped.
Advertisement
