

ALL-NEW: How many would lose coverage under Trumpcare in your COUNTY?
Tue, 06/20/2017 - 8:43pm
An eternity ago (aka back in January/February), I attempted to compile and break out estimates of how many people would likely lose healthcare coverage in the event of a full, "clean" repeal of the Affordable Care Act (that is, a complete repeal of the ACA without any replacement healthcare policy whatsoever). I concluded that the total added up to roughly 24 million people nationally: Around 8.2 million highly-subsidized Individual Market enrollees, nearly 15 million Medicaid expansion enrollees and 750,000 Basic Health Plan enrollees (NY & MN only). I then attempted to break these out by both County and Congressional District. I went with a "clean" repeal because there wasn't any actual replacement plan available to compare with.
Then, in March, the GOP finally (after 7 years of screaming about the ACA sucking) came out with their replacement plan (the AHCA)...and the CBO score of it projected that it would cause roughly 24 million to lose coverage as well. They later ran a new score based on the revised version of the AHCA...which only knocked a million off that number, bringing it down to around 23 million. This is the version which actually passed the House. The Center for American Progress took the CBO score and ran their own analysis of it, broken out by Congressional District only, which I reformatted into colorful state graphics.
Until today, however, I didn't have any way of breaking out the AHCA numbers by County. And then, earlier today, The Century Foundation published this impressive interactive map showing what the impact of the AHCA would be on every county in America. Ironically, the map itself doesn't actually display the total projected coverage losses...it lists data like "Number of Marketplace Enrollees facing Higher Out of Pocket Costs" and "People Paying More for Employer Coverage"...but not actual lost coverage.
Fortunately, when I exported the Map Data, I discovered that it includes an additional column: The total number of people projected to lose coverage by 2026 under the AHCA, broken out by county, using similar methodology to the Center for American Progress's district-level estimates. This is exactly what I was looking for, except that it only includes the total for each county, not the breakout between Medicaid, Employer Sponsored and Individual Market enrollees.
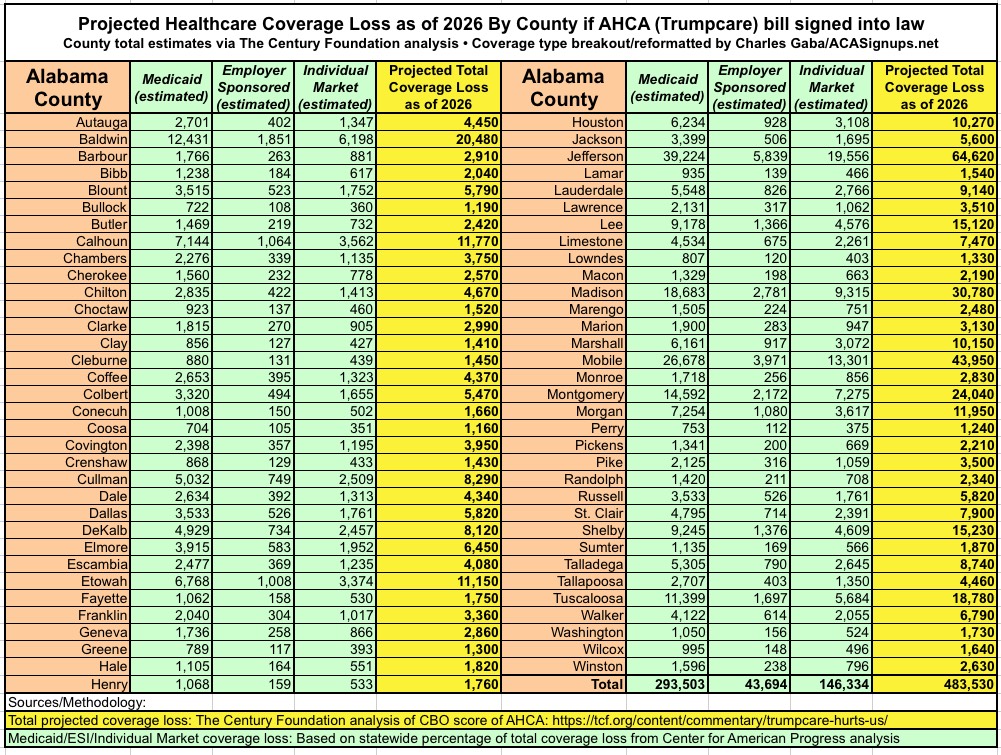
I figured out a way of estimating these, however: I have the statewide breakout of each of these sub-categories. I'm assuming that the ratio between the three numbers should be roughly equal, so applying the statewide proportions to each county should provide a rough approximation. For instance, in Alabama, CAP projects around 483,000 people would lose coverage total, broken out roughly 61% via Medicaid, 9% via Employer coverage and the other 30% from the Individual Market. I simply applied each of those percentages to the counties to get my estimates.
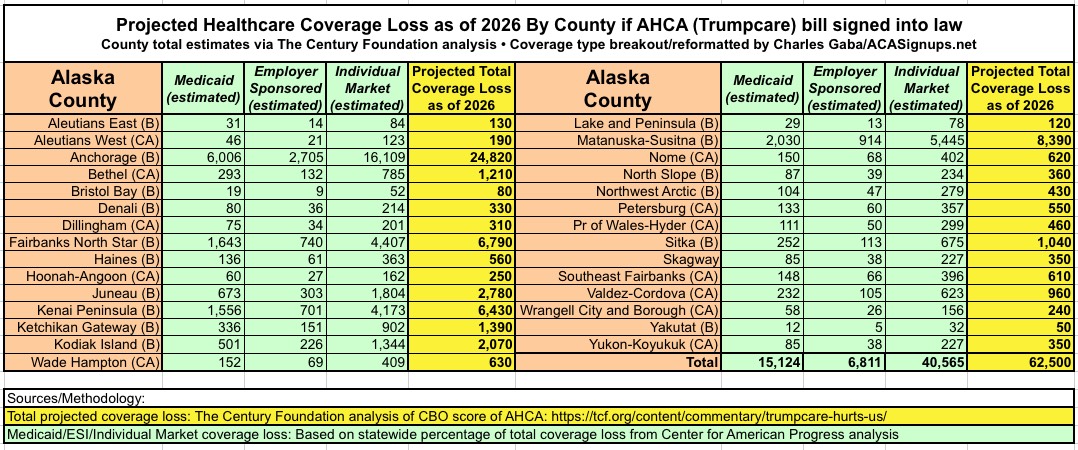
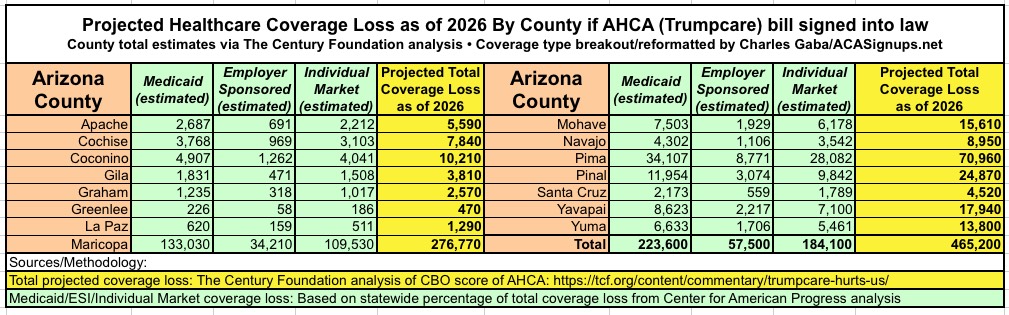
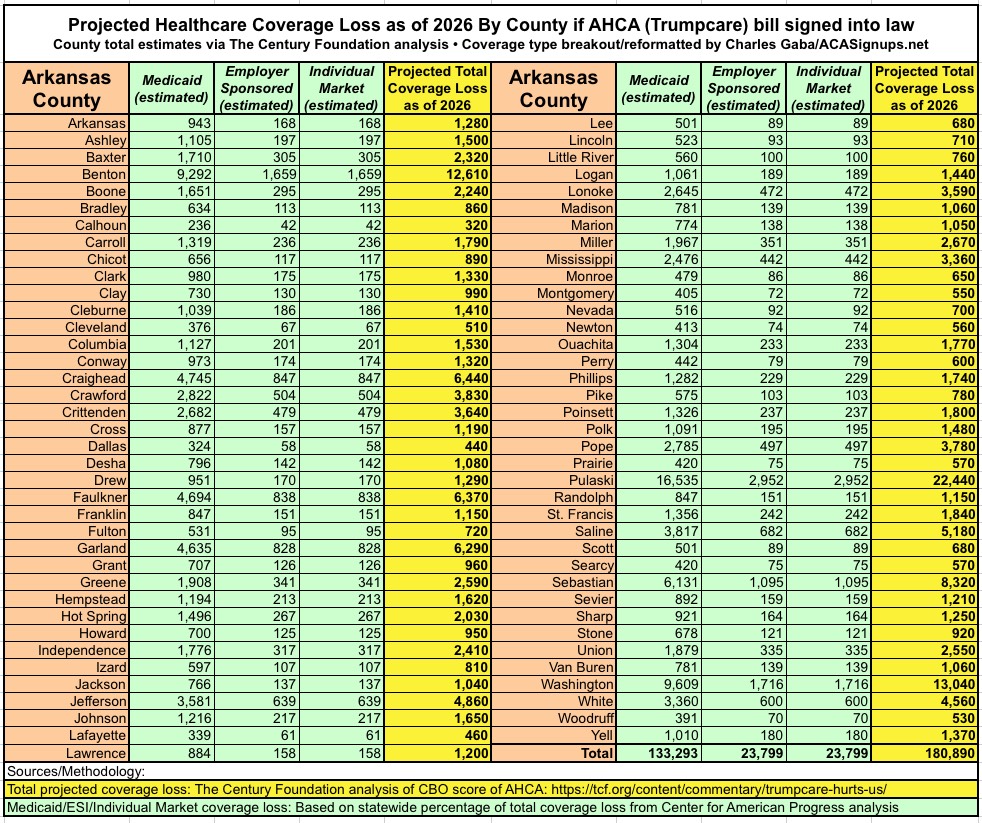
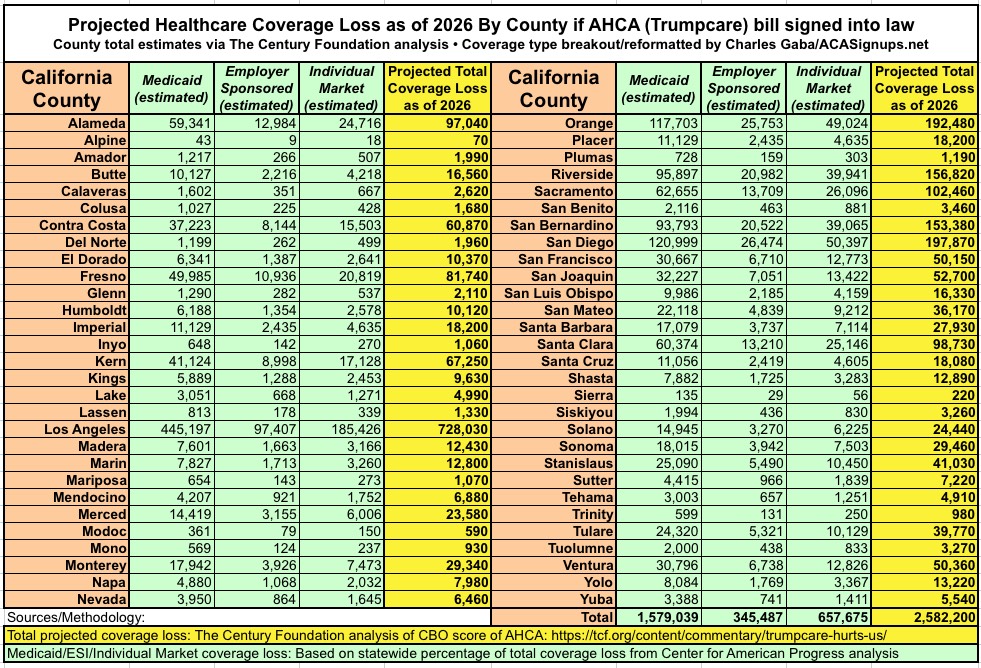
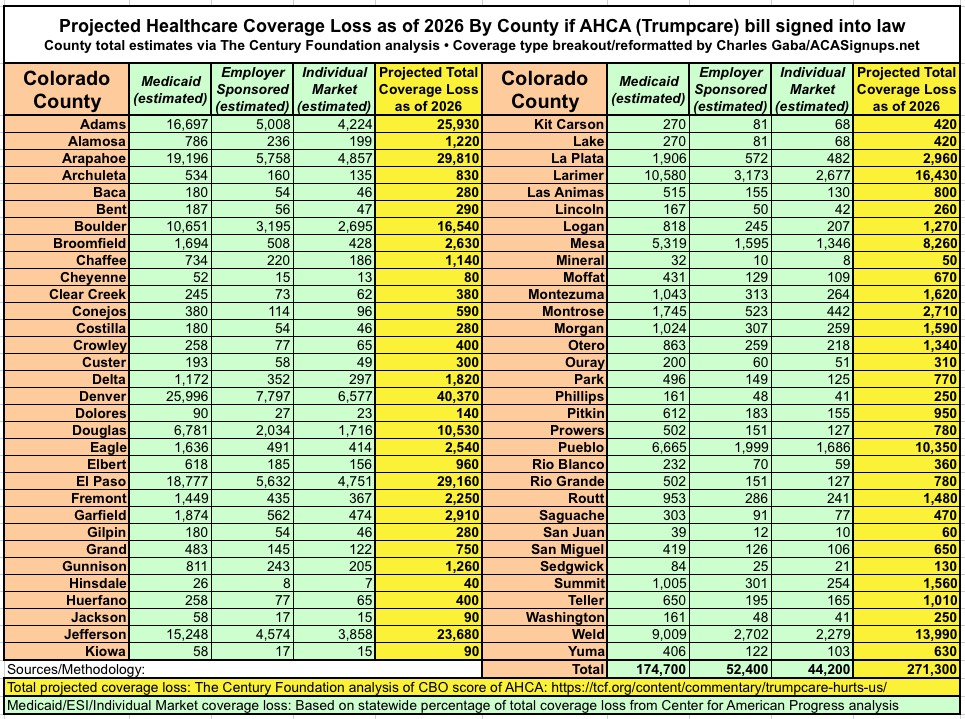
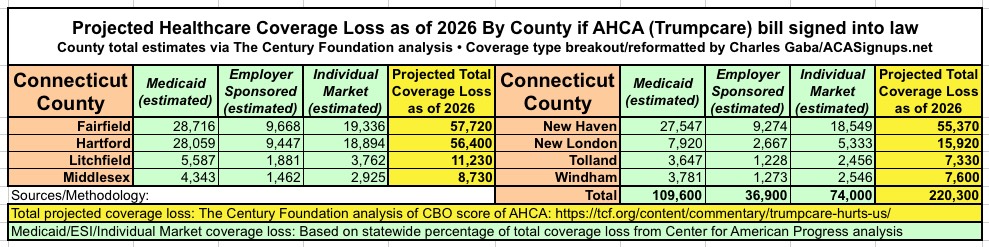
With that in mind, here's the County Level breakout of the Century Foundation's projections of how many people would lose healthcare coverage by 2026 under the GOP's AHCA bill. The yellow columns (Total) come directly from TCF's analysis; the green columns (type of coverage loss) are my own proportional estimates within those totals.
UPDATE: An earlier version of this entry mistakenly gave credit to CAP for the county-level stats; I've corrected both this entry and the tables to give full credit to TCF instead. Apologies to both for the error.
(Note: I only have a few state tables compiled so far; check back soon for the rest)
Advertisement
