

CALLING IT: Avg. *requested* indy market rate hike: 23%. Now let's see what gets *approved*...
Mon, 08/08/2016 - 5:00pm
Well, there you have it: Across all 50 states (+DC), taking a bunch of caveats into account (see below), as far as I can estimate, the average premium rate increases being requested by health insurance carriers sits at right around 23% overall.
As I keep reiterating, there are many caveats to these "statewide weighted averages":
- Off-exchange policies are included whenever possible, but only if they're ACA-compliant (grandfathered/transitional plans are in a different risk pool anyway). The ACA-compliant individual market totals roughly 18-19 million people nationally (11 million on-exchange, another 7-8 million off-exchange). Grandfathered/Transitional plans likely total around 2-3 million more.
- Only individual market policies are included (there's a few states where the small group market has been merged with the individual market risk-pool wise, but I only include indy enrollees for purposes of weighting). The small group market was around 13.5 million people, according to Mark Farrah Associates.
- Some carriers are pulling out of either specific counties or entire states next year, or are dropping certain plans while keeping others. There's no way of estimating the "average rate increase" for anyone who's losing their existing plan altogether.
- Some states are based on very rough, partial data; for these I've used my best efforts to calculate an educated guesstimate based on available data.
- In some cases, estimates that I ran as recently as a few weeks ago may prove obsolete. For instance, Aetna is currently planning on renewing policies in 15 states...but also just announced that they may pull out of some or all of these. If they do, I'd have to go back and remove some or all of the Aetna data from those states (depending on whether they drop the entire state or just certain counties).
- AGAIN, none of these data have ANYTHING to do with deductibles, co-pays or network size. Those are all important factors, but I simply can't take them into account here.
- I can't stress the importance of this enough: These average rate hikes are only valid if one assumes that 100% of all current enrollees in each state renew their existing policy (where those policies are still being offered next year). This will not end up being the case, of course; in addition to the million or so people who will have no choice but to shop around (due to co-ops going out of business, UnitedHealthcare/Humana pulling out of their state, other carriers dropping plans, etc), there will naturally be a large chunk of people who choose to shop around for different policies next year, either due to changing circumstances at their end or for simple comparison shopping purpose.
- UPDATE: As Margot Sanger-Katz reminded me, the flip side of this is that these requests also don't reflect the cost of any new plans being offered next year (either from new entrants or from existing carriers replacing existing plans or adding new ones).
- Finally, as of this writing, the actual 2017 rates have only been approved in three states (Mississippi, New York and Oregon). I've included those three in the tables below, but the sorting/color-coding is based (for now) on the requested rates only. As more state insurance commissioners post approved rates, I'll start posting them side by side with the requests so people can compare the before/after differences.
WItH ALL THAT IN MIND, here's what the numbers look like:
- First, once again, here's how I get the 23% national average. Remember that links to the calculations and methodology for each state can be found here, below the (repeatedly updated) main post.
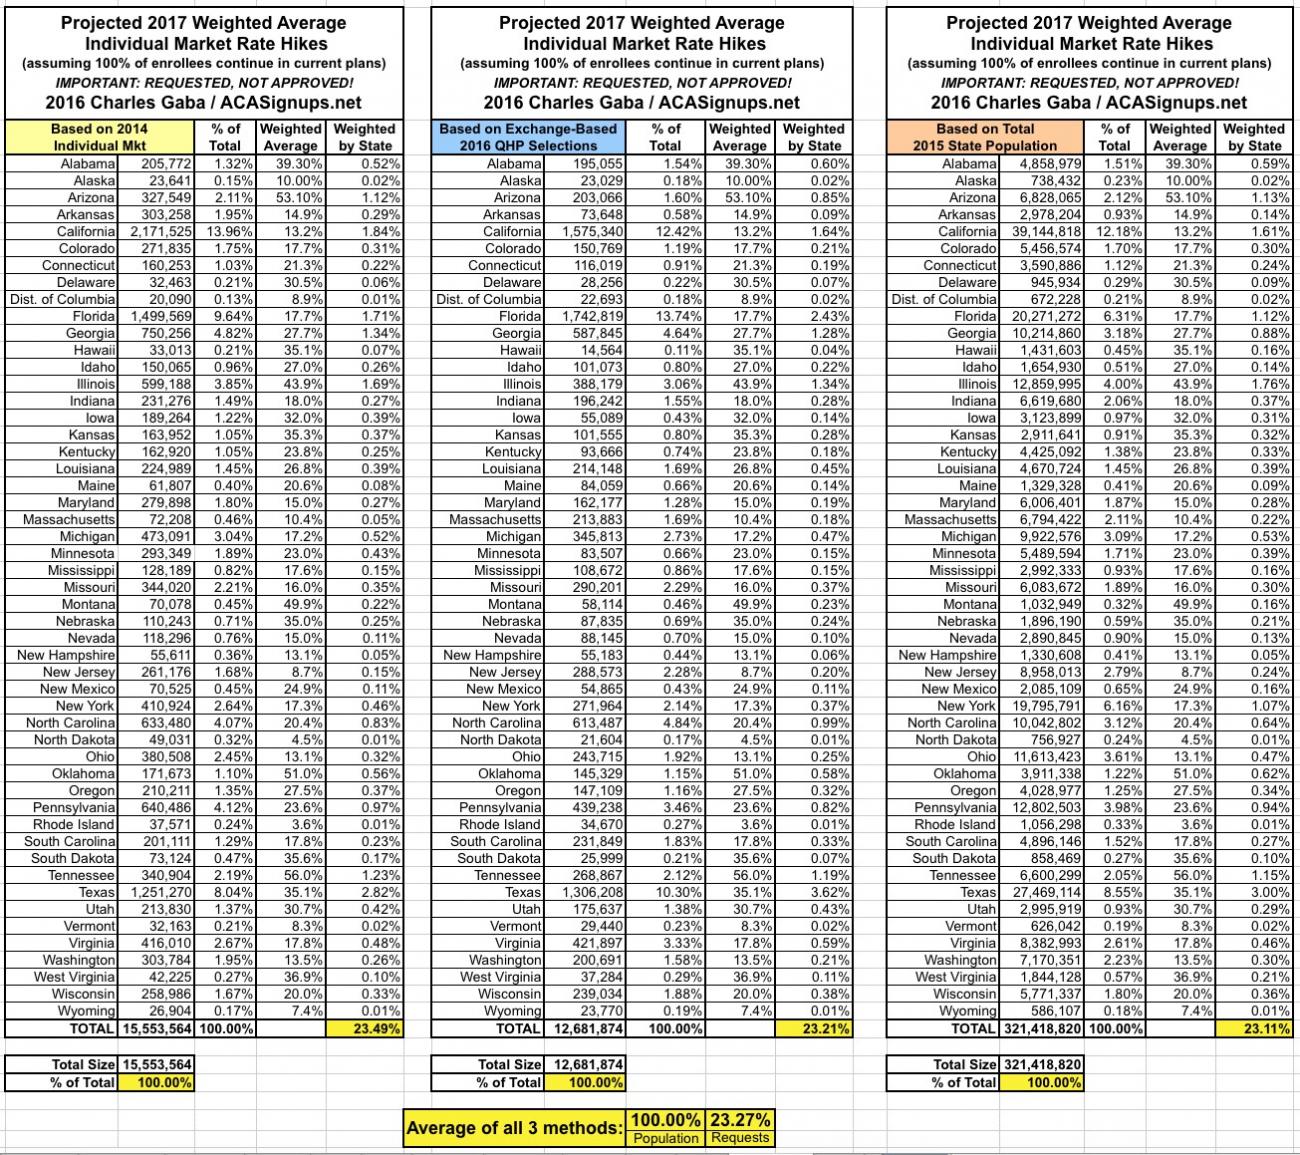
As you can see, regardless of the weighting method used, all three national averages come out remarkably close...somewhere between 23% - 23.5%.
Sorting from lowest average requested rate hike to highest gives us this:
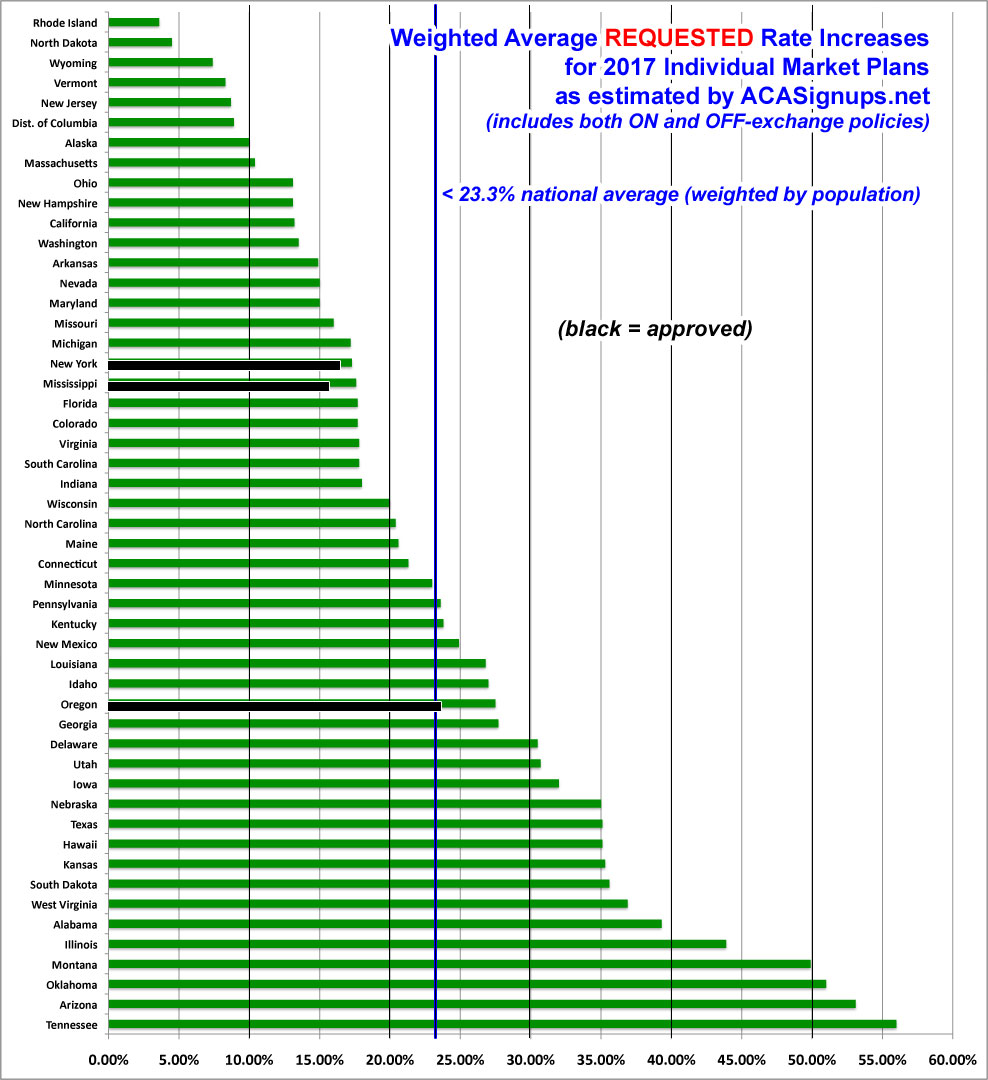
Last year, 18 states ended up with weighted average hikes under 10% (although some of these were only that low after being reduced by state regulators), and 15 states were asking for hikes over 20%. This year, only 7 states are requesting single digit increases, and 26 are asking for hikes of over 20%, with 5 states reaching above 40% on average. Not a pretty picture, to be sure.
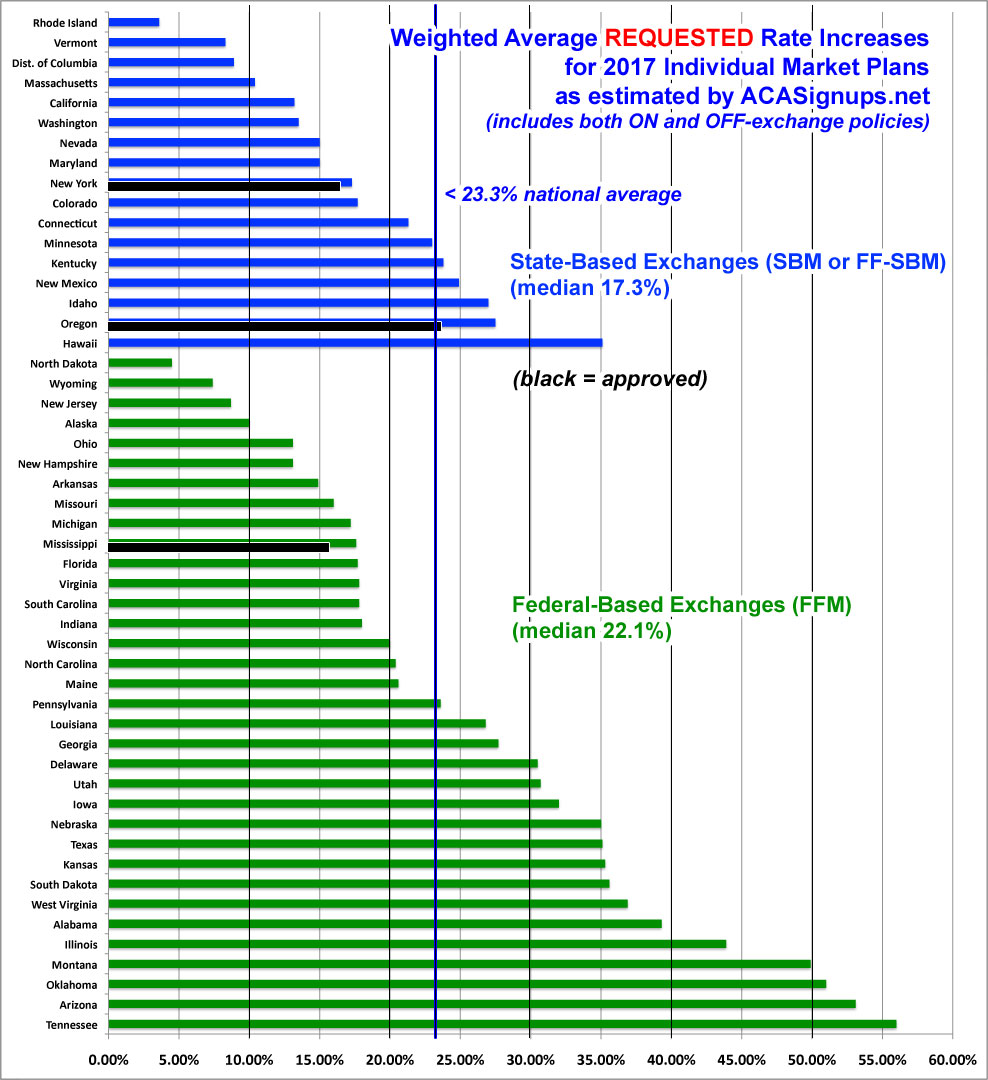
Some have asked whether the state-based exchanges are doing a better job of keeping premium hike requests under control, so I've sorted the states into the two categories. As you can see, the SBMs (including the 4 states which have since moved their technical platform over to HC.gov) do seem slightly lower overall, but there are too many variables to draw any conclusions here:
I've also sorted the states by whether or not they allowed ACA non-compliant transitional plans to be maintained all the way through the end of 2017. The number of people enrolled in these policies has dwindled over the past 3 years, but still make up a significant chunk of the individual market in some states. Again, there's definitely a gap in the medians between the two categories, but nothing definitive:
![]()
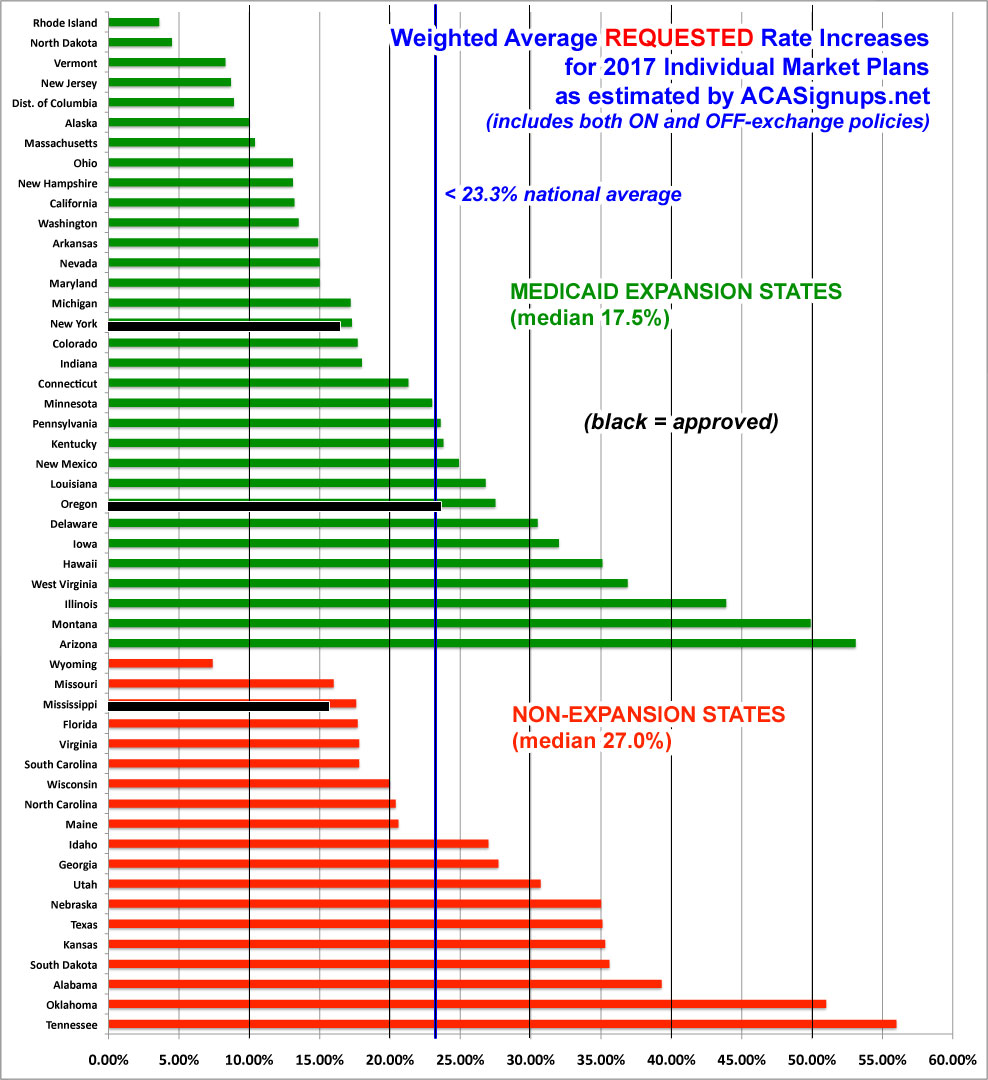
Finally, how about Medicaid Expansion? Does it make a noticeable difference whether a given state has expanded Medicaid under the ACA or not? Here, I'm seeing a pretty clear pattern: States which haven't expanded Medicaid under the ACA (whether "normal" expansion or via a waiver modification) have median rate increase requests nearly 10 percentage points higher than those which have expanded the program.
This certainly suggests that expanding Medicaid may make a significant difference in how much premiums go up each year...but once again, until the approved rates are posted for every state, I'd still be careful about making a declarative statement to that effect.
Advertisement
