

HC.gov Week 12 Snapshot: Erk. Just 103K Net QHPs. Looks like HHS's OE3 call was right: 12.4 - 12.9M QHPs
Wed, 01/27/2016 - 2:28pm
If, however, last week was a bust, then it doesn't bode well for the final week either:
- 200K Week 12 x 1.33 = 266K nationally = around 12.0 million cumulatively
- Assume 3x 266K for the final week = around 800K more = perhaps 12.8 million total
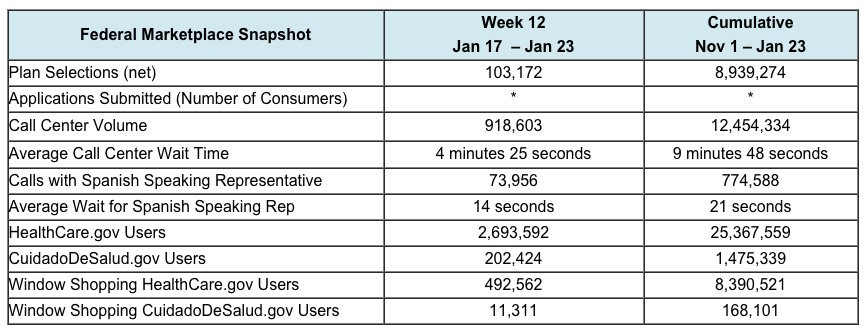
CMS just released the Week 12 Snapshot report:
Erk.
Hmmm...what about the purge factor? Last week it lopped the grand total down by 60%, from around 400K to just 154K, so perhaps something similar happened this week?
Overall, net plan selections for Week 12 totaled 103,172. Over the same time period, net new plan selections totaled 144,971. Net new plan selections take into account new plan selections in the reporting week minus any consumer or insurer-initiated cancelations for new plan selections. As a reminder, this year the number of net plan selections accounts for both insurer and consumer-initiated cancellations that occur before the end of Open Enrollment. This is a change from last year, and it will result in a larger number of cancellations being accounted for during, rather than after, Open Enrollment. Last year, cancellations from insurers that happened during Open Enrollment were reflected only in reports on effectuated enrollment after the end of Open Enrollment. There will likely be a smaller difference this year between plan selection totals at the end of Open Enrollment and subsequent effectuated enrollment.
Well...there was a small purge factor this week...but only around 40,000 vs. last week's 246K. Even including the purged enrollments, the weekly total was still only around 145K.
So, using my own rule of thumb above, that means we're likely looking at:
- 145K x 1.33 = 193K nationally, minus 40K = around 11.9 million as of 1/23/16.
- Assuming 3x 193K = 580K for the final week, which would bring the grand total to around 12.5 million by the end of January.
Even if I assume extra enrollees from an "overtime" period next week (as happened last year) and the final week ramps up to 4x this week, that'd still only be around 12.7 million.
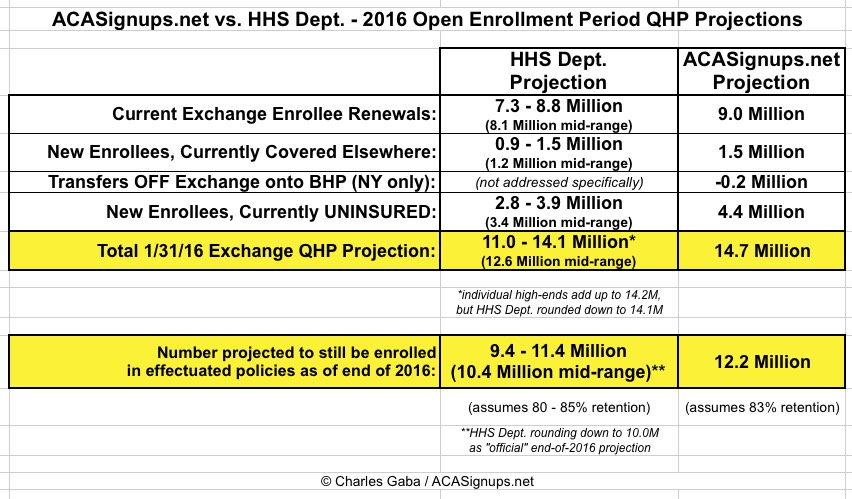
I'm making my final revised call anywhere between 12.4 - 12.9 million QHP selections as of 1/31/16.
Which, as it happens, is pretty much exactly what the HHS Dept. projected in the first place (note the 12.6 million mid-range in the first column):
Now, the "purge factor" is important here; CMS has confirmed that the cumulative total would have been at least 290,000 higher (and likely at least 400K higher or more) if they hadn't changed the way they reported the numbers. And it's certainly possible that there will still be a massive last-minute spike this weekend.
However, HC.gov would have to reach the level of stunning 1.8 million active enrollments that we saw during Week 7 in order to hit the 14 million range that I was originally projecting for this year.
In short, it looks like HHS called it correctly, whereas I'm likely to end up being off by anywhere from 12-16% off this year. Crud.
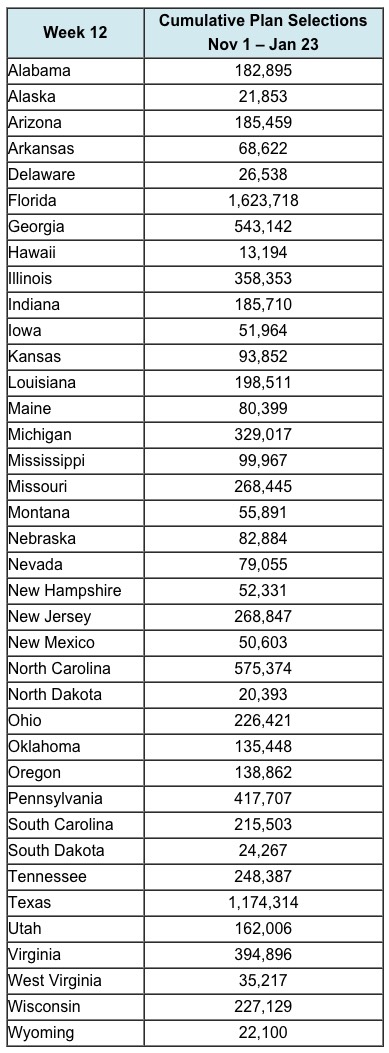
(sigh) Anyway, here's the state-by-state numbers:
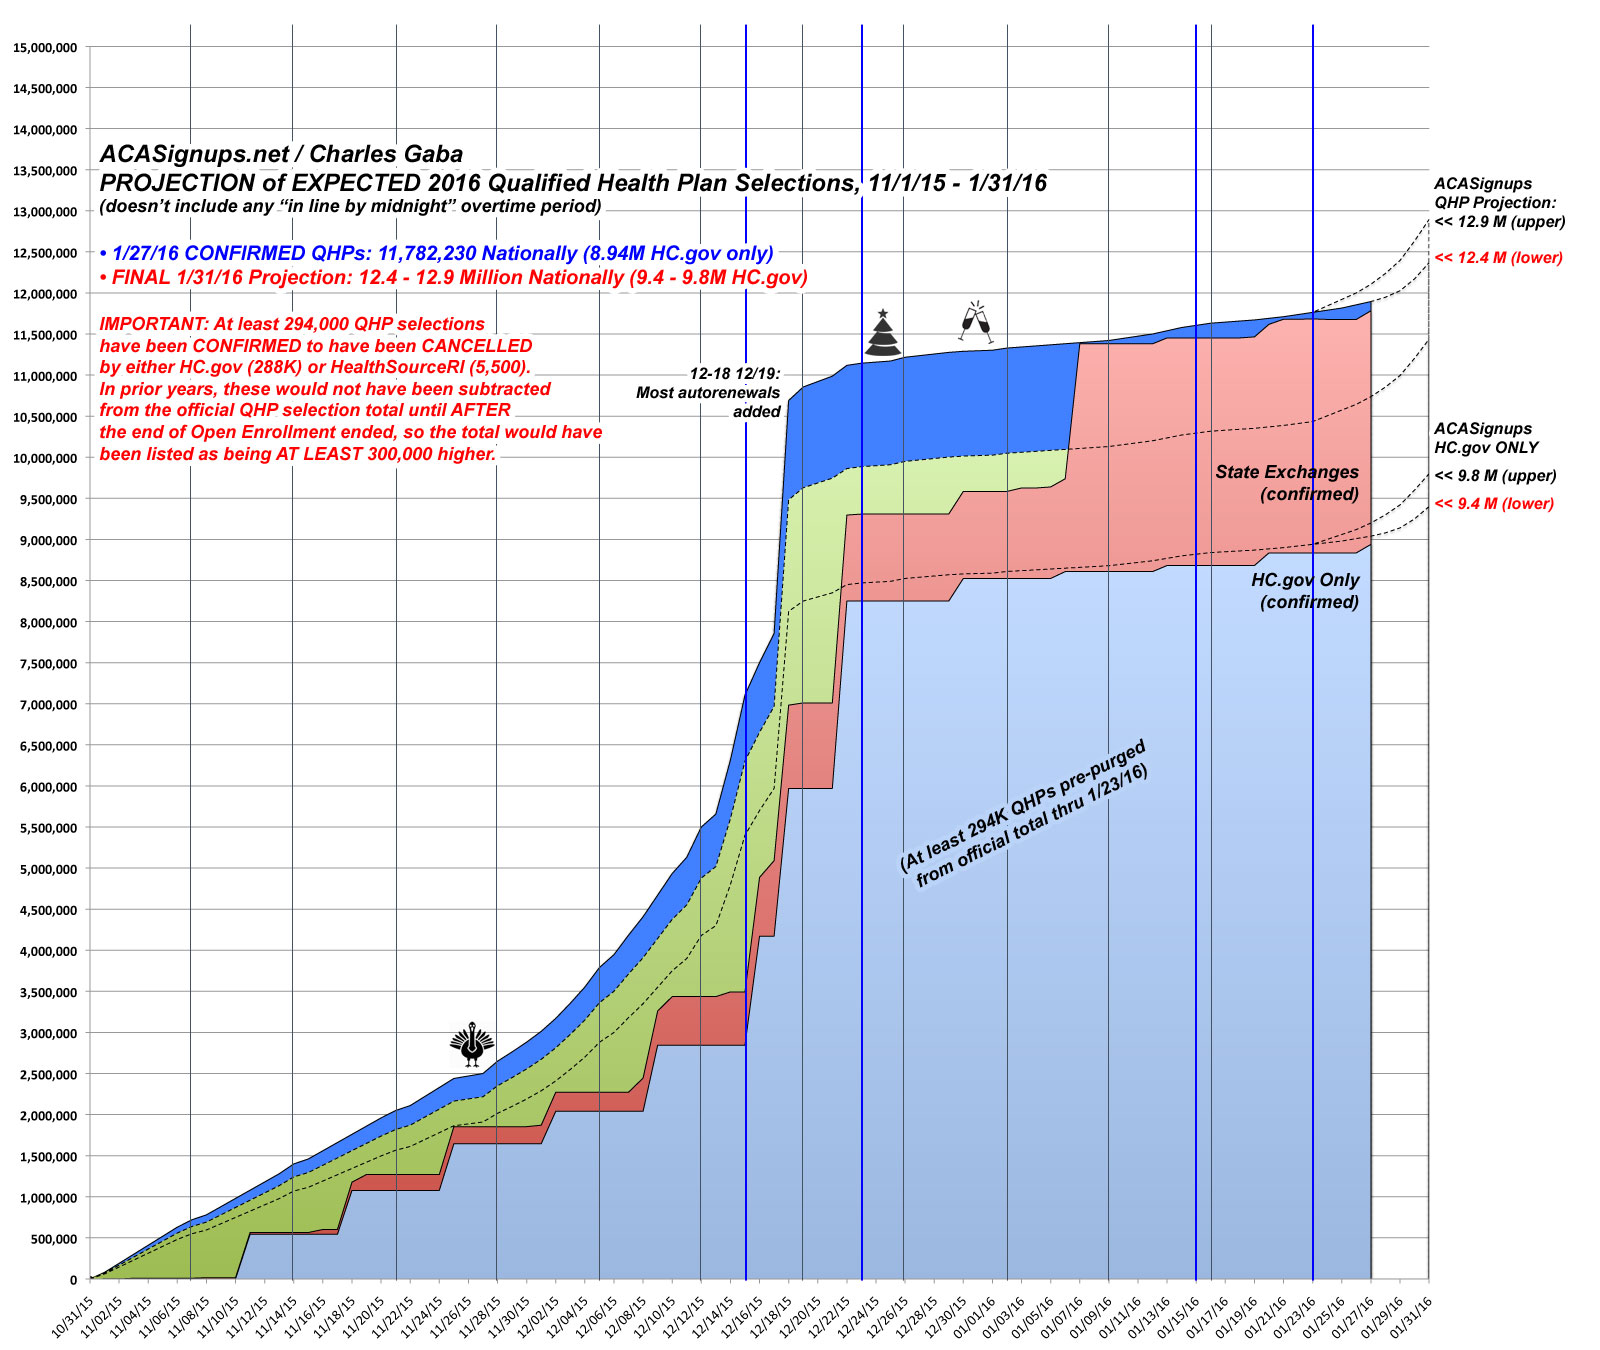
UPDATE: Here's the modified version of The Graph. As you can see, things haven't quite flatlined since Christmas, but it's certainly turned into a trudge, averaging perhaps 32,000 QHP selections daily nationally over the past 4 weeks:
Advertisement
