

(near) Final Projection: National 2016 Weighted Avg. Rate Hikes to be between 11-15%
Fri, 09/18/2015 - 10:37pm
For months now, regular readers know I've spent countless hours crunching the numbers in an attempt to figure out the national, weighted average rate increases for individual health insurance market premiums. I've dug into the numbers for just about every state, filling in hard data where I can and making educated guestimates where I couldn't.
For instance, If I found a state where I was able to get a hard weighted average of, say, a 15% increase for 50% of their market, but didn't know what increase the other 50% had been approved for other than it being "less than 10%", I've been assuming around 7% for the missing half, giving a total weighted average of (0.15 x 0.5) + (0.07 x 0.5) = 0.075 + 0.035 = 0.11 = 11.0%.
For each state I've done the best I can to fill in as many gaps as possible, but there's a lot of caveats for most of them. Plus, of course, even if every single estimate I have is accurate on its face, they're only valid if not a single current enrollee shops around. In other words, these would only hold true if every person sticks with their current policy. If a significant number of current enrollees switch to a less-expensive policy, the overall average rate increase could end up being significantly lower! Needless to say, I can't stress this point enough.
In any event, I've now plugged in the numbers for 42 states (+DC), covering 87% of the total U.S. population. The 8 remaining states include Alabama, Mississippi, Nebraska, North Dakota, Pennsylvania, South Carolina, Virginia and Wisconsin.
I do plan on taking a shot at all 8 states, but at this point, with 87% covered and November 1st quickly approaching, it's time to start wrapping this project up.
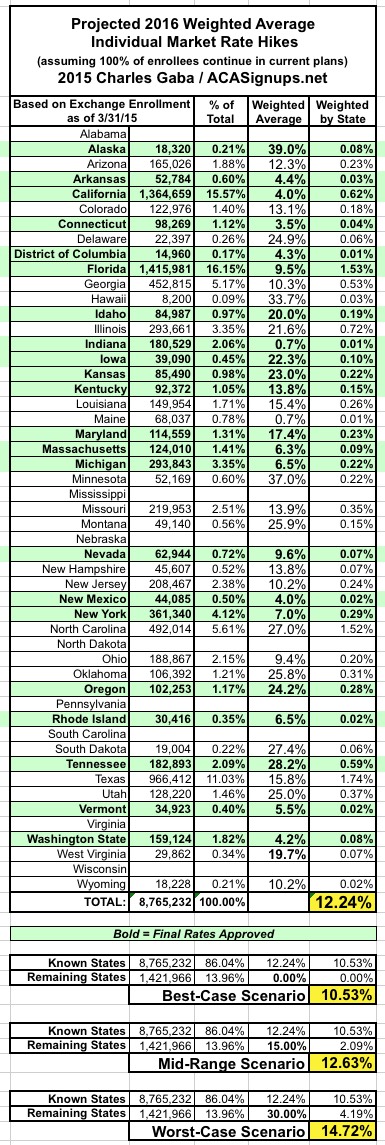
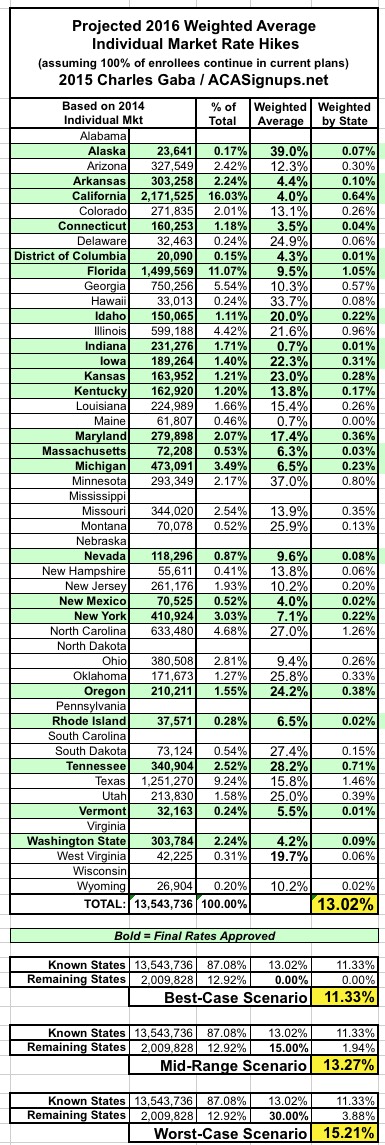
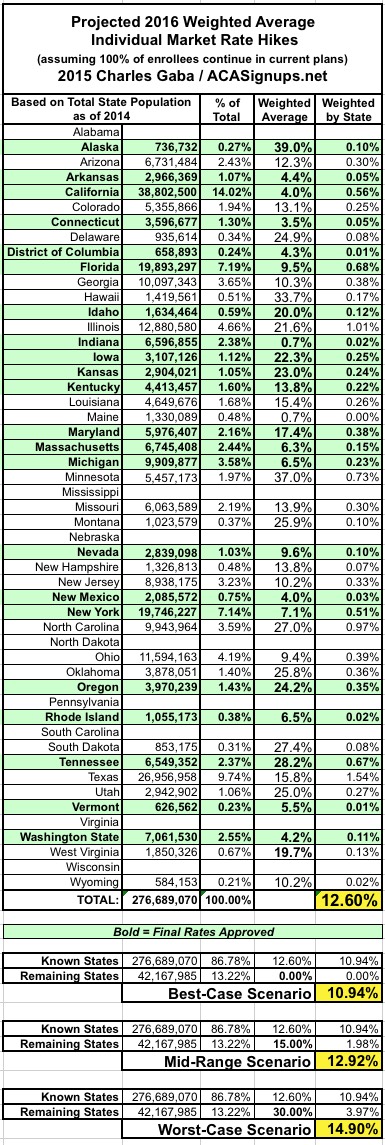
To that end, I've done the following: I've taken my state-by-state spreadsheet, which features every state weighted by three different criteria (2015 open enrollment QHP selections, 2014 total individual market size, and 2014 total state population), and have plugged in the missing states using "Best Case", "Mid-Range" and "Worst Case" scenarios.
For the Best Case, I'm assuming that all 8 missing states end up being precisely flat, with prices not changing (on average) whatsoever. This is obviously extremely unlikely, but I'm including it as a guideline. As you'll see below, if that were to somehow be the case, the total national weighted average would end up being somewhere between 10.5% - 11.3%, with the "total population" version coming in at 10.9%.
For the Mid-Range, I'm assuming the 8 missing states end up with a weighted average of 15%...a bit higher than the 12-13% the other states have been averaging so far. That would bring the national total up to somewhere between 12.6% - 13.3%, with the total population version at 12.9%.
Finally, the Worst Case scenario. This assumes very ugly numbers for the 8 missing states: 30% weighted average among them. If that was the case, we'd be looking at anywhere between 14.7% - 15.2%, with the total popluation version at 14.9% nationally.
Again, many caveats, disclaimers and assumptions at play here. One other big one is that many states still have requested rate hikes only, which can change dramatically after being approved by state regulators. I'll also see if I can fill in a few more (Pennsylvania is the one I really want to nab, as it makes up over 4% of the total U.S. population by itself).
HOWEVER, at the moment, my best estimate is that individual market rates nationally, will end up increasing anywhere between 11% - 15% on average next year...assuming that everyone stays put.
SHOP AROUND, SHOP AROUND, SHOP AROUND.
Advertisement
