

BEHOLD!! The REVISED 2015 GRAPH!!
Wed, 06/03/2015 - 4:01pm
With the latest official enrollment data out of the CMS division of the HHS Dept., I've had to make some modifications to The Graph to make it more accurate.
First, here's the old version, updated through yesterday (click either one to load full-size version in new browser window):

And now, the NEW version!
Yes, I know; not exactly night and day, right?
However, there's some important differences:
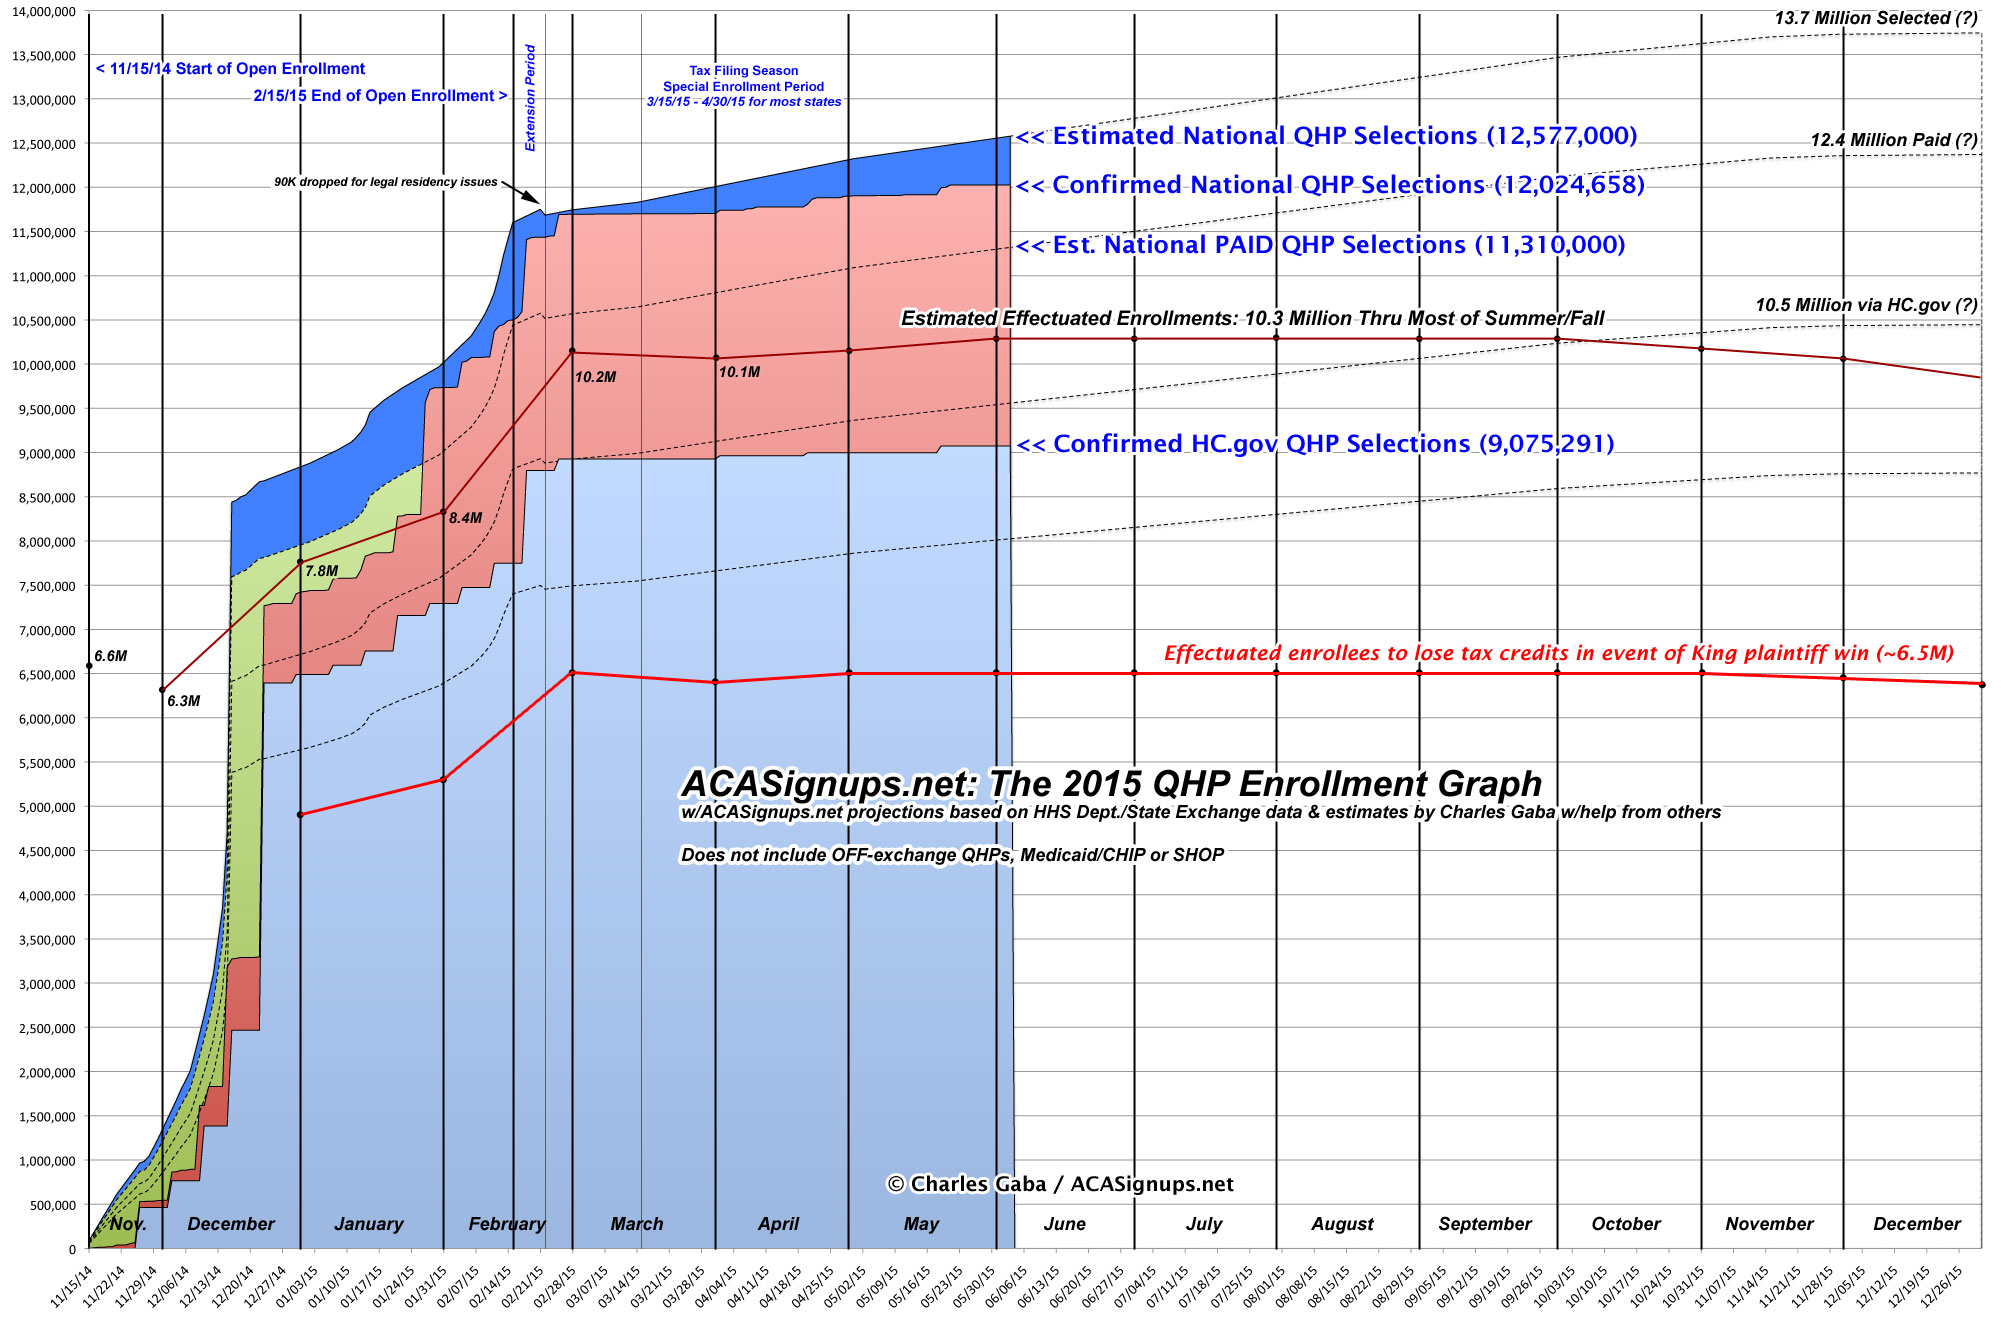
- Between the recent data updates out of California and Connecticut, along with the higher-than-expected 3/31/15 effectuated number from yesterday's CMS report, I've concluded that the overall first month premium payment rate has indeed increased a bit, from 88% in 2014 to at least 90% for 2015 enrollees. This means that the number of exchange enrollees who have paid for at least their first premium is more like 11.3 million instead of 11.0 million to date.
(I had speculated back in November that the overall payment rate could reach as high as 94% this year, but that seemed unlikely; instead it appears to be splitting the difference between that and 2014's 88%) - The currently effectuated enrollment number is also higher, mostly as a result of the above. I was assuming around 10.0 million actively enrolled as of March and a peak enrollment of around 10.1 million throughout the summer/early fall, but yesterday that number was shown to be closer to 10.2 million...200,000 higher. Between this and the additional #ACATaxTime enrollees added after the 3/31/15 cut-off date for the CMS report, it looks like effectuated enrollments will plateau at around 10.3 million instead.
- However, the drop-off at the end of 2014 (closing out December with 6.3 million instead of my estimate of 6.6 million) suggests that the end-of-year effectuated drop-off may be steeper this year as well. With this in mind, I've dropped the final effectuated number from around 10.0 million to 9.7 million or so.
- Otherwise, both Graphs are pretty much the same. I still project that the cumulative number of QHP selections nationally will be around 13.7 million by the end of the year.
ALL of the above assumes that the Supreme Court rules against the plaintiffs in King v. Burwell, of course. If not...well, let's just say that the 2nd half of the graph will have to be altered significantly, to put it mildly.
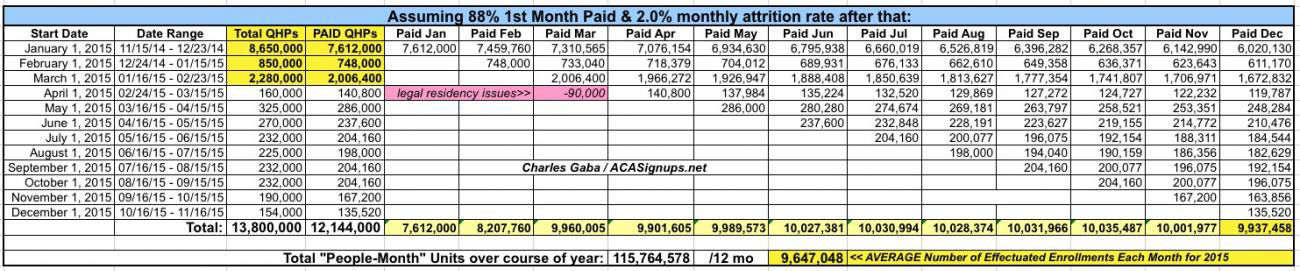
Here's the spreadsheets which explain where the monthly effectuated numbers come from. For the old version, I assumed an 88% payment rate, 2% monthly average net attrition and around 7,500 people enrolling during the off-season per day, plus about 140,000 tax filing-specific enrollments. As you can see, the effectuated March number is around 9.96 million:
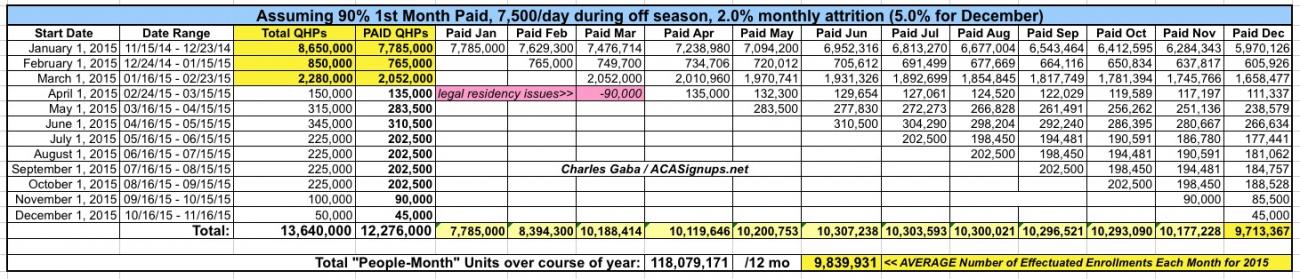
However, with yesterday's official CMS numbers, I'm able to tweak these accordingly to get a more accurate picture to bring the March number up to around 10.2 million. Doing so required four changes: I bumped up the payment rate to 90%,corrected the total #ACATaxTime enrollment to 214,000, and increased the December attrition rate to 5% (while dropping the last-minute enrollments in October/November):
Advertisement
