

Gallup: Uninsured rate drops *another* half point to 12.9%
Wed, 01/07/2015 - 8:48am
Ahead of the latest weekly report from HC.gov, Gallup reports that:
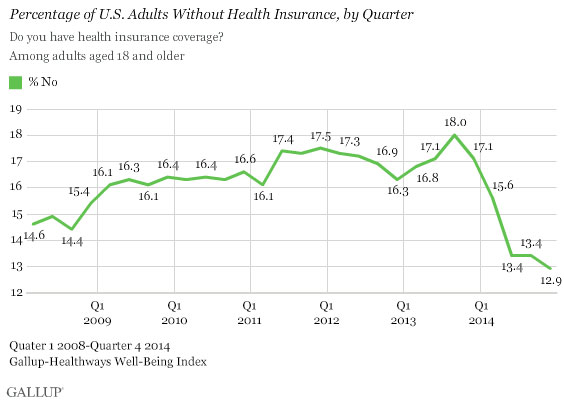
WASHINGTON, D.C. -- The uninsured rate among U.S. adults for the fourth quarter of 2014 averaged 12.9%. This is down slightly from 13.4% in the third quarter of 2014 and down significantly from 17.1% a year ago. The uninsured rate has dropped 4.2 percentage points since the Affordable Care Act's requirement for Americans to have health insurance went into effect one year ago.
The uninsured rate declined sharply in the first and second quarters last year as more Americans signed up for health insurance through federal and state exchanges. After the open enrollment period closed in mid-April, the rate leveled off at around 13%. The 12.9% who lacked health insurance in the fourth quarter is the lowest Gallup and Healthways have recorded since beginning to track the measure daily in 2008. The 2015 open enrollment period began in the fourth quarter on Nov. 15 and will close on Feb. 15.
Remember, this latest quarterly report doesn't include the 2.6 million or so additional people who have already enrolled in ACA exchange policies for 2015 so far (although some of these are moving from existing policies of some sort) or the additional people who have enrolled in Medicaid in some states such as Pennsylvania, which just started their ACA Medicaid expansion version last month with coverage kicking in 6 days ago.
So how many actual people does that translate to? Well, remember that this doesn't include children under 18, so instead of around 316 million, we're talking about roughly 242 million total. Of those, 12.9% is around 31.2 million, versus 43.5 million in September 2013 and 41.4 million in December 2013.
While Gallup starts their clock with December 2013 (since that's when the exchange coverage and Medicaid expansion kicked in), it's important to remember that another 950,000 people were quietly added to Medicaid via other ACA provisions over the prior year as well, which may partially explain the additional reduction of 2.1 million in the 4th quarter last year (although an improving economy likely explains some of that as well). So, a net reduction of bewteen 10.2 million - 12.3 million, just as several other surveys have found in recent months (the number and percentages vary depending on methodology and source).
Bottom line, there's absolutely no denying it at this point: The ACA has absolutely caused the overall uninsured rate to drop by 25% to date.
So how much more of an impact will it have in 2015? Well, the Employer Mandate will be very tricky to figure, because as the economy improves employers will (hopefully) continue to hire more people anyway. Still, at least on the individual/family market side of things, I expect total ACA exchange enrollment to range between 10.5 - 11 million this year (11 million paying their first premium out of 12.5 million total plan selections, drifting down slightly to 10.5 million by the end of the year), versus the 6.7 - 7.1 million range last year. That's around 3.9 million more people on average. If, say, 60% of them were previously uninsured (last year it was 57%), that's a net reduction of around 2.3 million uninsured people.
Add to that the continuing Medicaid/CHIP expansion programs. Pennsylvania has around 600K eligible alone, and as we've seen in Michigan, West Virginia and other states, the odds are high that they'll max that out within the course of the year (they're 20% of the way there already). Throw in additions from the already-expanded states and assuming that another 3-4 states follow through at some point this year (Montana, Utah, Wyoming, Tennessee, etc...) and I could easily see up to 2 million more being moved onto the program.
Combined, that should result in a further reduction in the uninsured of well over 4 million by the end of the year, or another 1.6%, which could bring the rate down as low as 11% by the end of 2015. Of course, this assumes no major disruptions such as, say, the Supreme Court gutting the law by shooting down federal tax credits in up to 37 states...
In addition, Gallup's latest includes a handy breakout of just what type of coverage people have, although the most interesting bit to me is how many of those under 65 have Medicare:
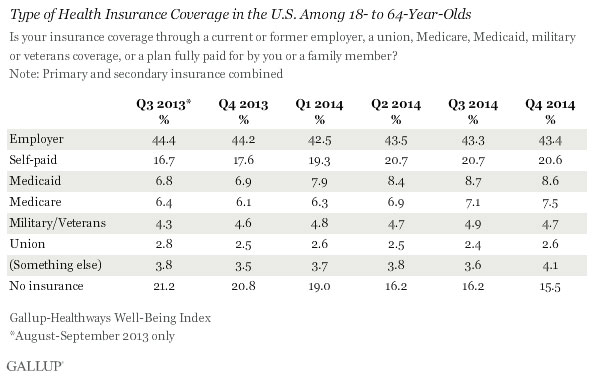
In this case, the percentages don't include those under 18 or over 64, which means we're talking about roughly 198 million people to start with. 7.5% of that is 14.8 million non-seniors on Medicare, much higher than I would've figured.
Advertisement
