

Mark Farrah estimates total U.S. indy market at 20.4M as of September
Mon, 12/18/2023 - 4:59pm
Mark Farrah Associates is an electronic publisher of business information and analytics for the U.S. healthcare industry; they aggregate industry data and market metrics for their own database products that they sell on a subscription basis.
They typically release state-level breakout estimates of the total U.S. individual market once or twice a year. They last did so in July 2023, although they only included a national total at the time, pegging it at around 19.5 million as of the end of March.
Today they've issued an updated breakout, this time including a state-by-state breakout...although curiously, they continue to use the official Open Enrollment Period QHP total for on-exchange enrollment from the end of January even though the effectuated on-exchange enrollment numbers as of February are easily available (these are typically around 5-6% lower, since not everyone actually pays their first monthly premium after enrolling).
In my version below I'm using the February effectuated numbers for on-exchange enrollment. These aren't fully accurate either since exchange enrollment increased significantly from February through September (mostly via Medicaid Unwinding transferees), but it's still more accurate than the 2023 OEP numbers.
There's a couple of other important caveats in the Mark Farrah report as well:
Record Breaking Enrollment for the Individual Health Insurance Market
According to financial statements filed by insurers and estimates by Mark Farrah Associates, enrollment in individual medical plans, both on and off the exchange, totaled approximately 20.4 million as of September 30, 2023. This is the largest number of participants this segment has seen as redeterminations have removed millions from Medicaid roles, causing some individuals to take advantage of the increased Marketplace subsidies, and to seek health insurance coverage from the Individual segment. Open enrollment for 2024 coverage started on Nov. 1st and runs through Jan. 15th. In this brief, Mark Farrah Associates (MFA) provides insights into individual health insurance enrollment trends and market developments with state-by-state membership comparisons.
Competitor Exchange Participation
For 3Q23, health insurers reported total individual, non-group coverage for 20,371,963 million people, based on statutory financial statements filed with the NAIC (National Association of Insurance Commissioners) and the CA DMHC (California Department of Managed Health Care and aggregated from MFA’s Health Coverage Portal™. This represents a 15.8% increase from the 17.6 million members reported in 3Q22.
...Note: Mark Farrah Associates (MFA) applied enrollment figures for select carriers not required to report health enrollment on a quarterly basis and made other adjustments based on market analysis. Furthermore, individual enrollment includes short term plan enrollees and may include Medicaid programs, such as CHIP, as some states include subsidized lines in the individual segment. These factors may have resulted in moderate understatement or overstatement of enrollment.
(sigh) It's unfortunate that Farrah always includes short-term, limited-duration plans (STLDs) in this data, but it is what it is. I've been told by a trusted Medicaid/CHIP specialist that those enrollees should be nominal at most, however.
In any event, here's Farrah's total state-by-state Individual Marketplace enrollment estimates as of September 2023 alongside the February 2023 effectuated on exchange numbers, with the cumulative Medicaid Unwinding > Exchange QHP totals for each state through August. The difference should roughly represent the off-exchange enrollment for each, with the caveat that this may include STLD enrollment in some states:
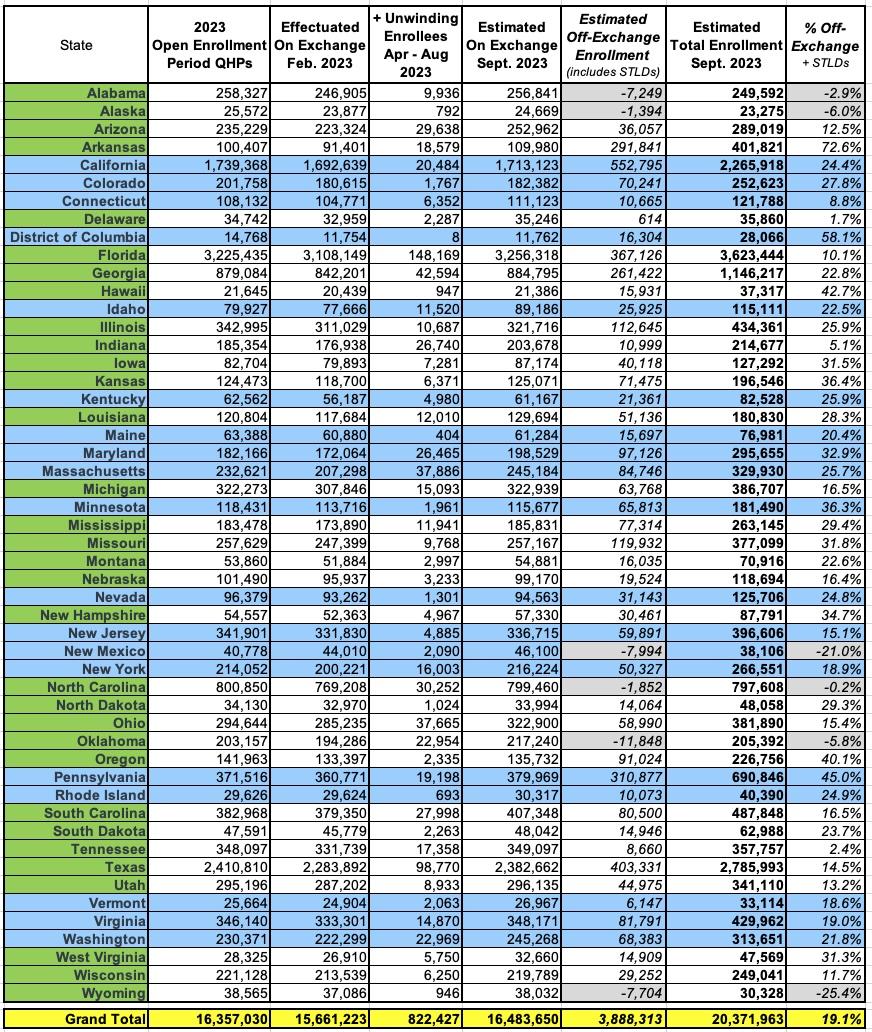
There's several states where the breakout makes no sense since the off-exchange enrollment comes out negative (Alabama, Alaska, New Mexico, North Carolina, Oklahoma and Wyoming). Otherwise, most of the states look pretty reasonable to me--averaging around 81% on exchange & 19% off-exchange.
A fwe states stand out: Arkansas has by far the highest percent of off-exchange enrollees; this is mostly due to their unusual "Private Medicaid Option" program. The next highest are DC, which I'm surprised at given that to the best of my knowledge they don't even have an off-exchange individual market, which would mean all of their "off-exchange" enrollees are in STLDs, which again, makes little sense.
In any event, assuming this is reasonably accurate, it suggests that the combined off-exchange ACA-compliant + STLD market is around 3.9 million people nationally.
Advertisement
