

2021 OEP Week 6 HC.gov semi-final Snapshot Report: 4.42M QHPs, 8.23M total
Fri, 12/18/2020 - 5:19pm
Hot off the presses, via the Centers for Medicare & Medicaid:
Week Six, December 6 - December 15, 2020
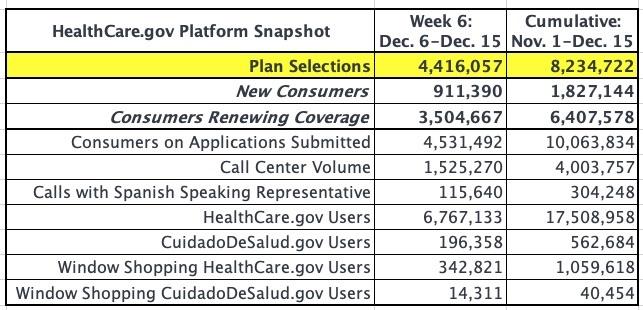
In Week Six of the 2021 Open Enrollment period, 4,416,057 people selected plans using the HealthCare.gov platform or were automatically re-enrolled in a plan. While past snapshots this year have measured enrollment weeks Sunday through Saturday, this week’s snapshot for week six also includes the final few days of the Open Enrollment Period.
This snapshot covers the period from December 6, 2020, to 11:59 p.m. Eastern on December 15, 2020. The plan selections reported in this snapshot are not final and do not include plan selections for consumers who enrolled in coverage between 12:00 a.m. and 5:00 a.m. Eastern on December 16, 2020, or consumers who left their contact information at the call center due to high volume. Similar to previous years, the Centers for Medicare & Medicaid Services (CMS) plans to release an updated snapshot during the second week of January with the final enrollment data.
Every week during Open Enrollment, the Centers for Medicare & Medicaid Services (CMS) releases enrollment snapshots for the HealthCare.gov platform, which is used by the Federally-facilitated Exchange and some State-based Exchanges. These snapshots provide point-in-time estimates of weekly plan selections, call center activity, and visits to HealthCare.gov or CuidadoDeSalud.gov.
As a reminder, New Jersey and Pennsylvania transitioned to their own State-based Exchange platforms for 2021, thus they are not on the HealthCare.gov platform for 2021 coverage. Those two states accounted for 578,251 plan selections or 7% of all plan selections during the 2020 Open Enrollment Period. These enrollees’ selections will not appear in figures released by CMS until CMS announces combined plan selection information from the HealthCare.gov platform and the State-based Exchanges that operate their own enrollment platforms in 2021.

It's a bit tricky to compare the first weekly report against the previous year:
- Last year Nov. 1st fell on a Friday, so "Week 1" was actually only 2 days
- The "Week 2" report included the following 7 days, for 9 days total
- The "Week 3" report included just 16 days total
- The "Week 4" report report included 23 days total
- The "Week 5" report included 30 days total
- The "Week 6" report included 37 days total
- The "Week 7" report actually included 47 days (12/08 - 12/17...they extended the deadline by an extra couple of days and included them in the report as well)
With the sixth week included, I can compare 45 days in OEP 2021 vs. 47 days in OEP 2020:
- First 45 days of OEP 2021: 182,994 QHP selections/day (8,234,722 total)
- First 47 days of OEP 2020: 176,678 QHP selections/day (8,303,850 total)
- alternate OEP 2020: 184,530/day if you disregard the 2-day extension.
That's either 3.6% higher or 1% lower depending on your POV. Keep in mind, however, that this is if you include Pennsylvania and New Jersey! Those two states enrolled a total of 580,980 people as of 12/17 last year, so it's actually:
- First 45 days of OEP 2021: 182,994 QHP selections/day (8,234,722 total)
- First 47 days of OEP 2020 (w/out NJ/PA): 164,316 QHP selections/day (7,722,870 total)
- alternate OEP 2020 w/out NJ/PA: 171,619/day if you disregard the 2-day extension
...which is 6.6% higher than last year, which is pretty good, especially under the circumstances (the pandemic, the looming Supreme Court decision and the ongoing coup attempt by Donald Trump to overthrow the election results).
However, it's also important to note the breakout between current enrollees actively renewing their policies and new consumers enrolling.
Last year, during Open Enrollment, it was a 75% / 25% split between the two. This year it's split 78% / 22%.
Renewals of existing enrollees are way up: 6,407,578 vs. 5,753,210 last year (without NJ/PA). That's 11.4% higher.
NEW enrollment, however, is concerning. Last year there were 1,955,410 new enrollees via HC.gov (when you remove NJ/PA). This year it's 1,827,144...or 6.6% lower.
Given the massive number of people who have lost their employer-sponsored health insurance since March, you'd normally think that there'd be a surge in new enrollees, especially since many parts of the country have zero premium policies...including zero-premium GOLD plans for many people. And yet, so far, the number of new enrollees is pretty much flat.
This is where a proper awareness/marketing/outreach campaign from the federal government could do wonders...yet Trump's CMS Administrator, Seema Verma, has basically gutted HC.gov's marketing budget.
It's important to note, however, that a big chunk of the surge in renewals could also simply be people who enrolled via Special Enrollment Periods (SEPs) earlier this year who are renewing. While there are SEP enrollees every year, this year there was a surge of at least 188,000 more via HC.gov states than usual due to massive job losses during the COVID-19 pandemic. That report only ran through late June; I'm sure it's more like 250,000 or so by now.
Even if they've only been enrolled for a month or two, they're still considered current enrollees, not new enrollees. In addition, a chunk of current exchange enrollees likely had to downshift to Medicaid instead if they lost their jobs/income...meaning the net impact on total exchange enrollment could be pretty minimal.
Finally, here's the state-level breakout for the 36 states hosted via HC.gov. I've included last year's numbers for comparison:
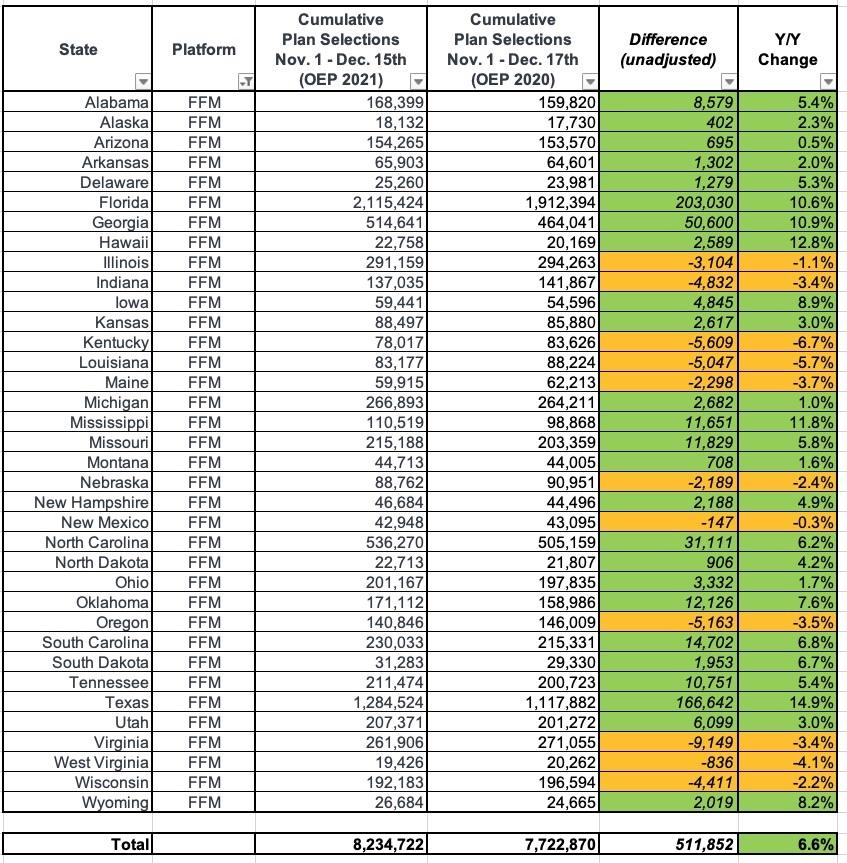
As you can see, on a per-day average basis, 25 out of 36 states outperformed last yearr. The state with the highest relative perofrmance increase was Texas, which ended up 15% higher year over year. The worst-performing state relative to last year was Kentucky, which ended up down 6.7% vs. last year for reasons unknown.
UPDATE: D'oh! As my friend Andrew Sprung notes over at Xpostfactoid, both Kentucky and Texas' numbers make perfect sense for reasons VERY known!
Advertisement
