

#COVID19 is on the verge of becoming a Trump County problem in Minnesota & Texas as well.
Tue, 05/05/2020 - 4:04pm
After a TON of tedious work porting data over into my county-level COVID-19 tracking spreadsheet, I've completed charts breaking out confirmed cases in two additional states: Minnesota and Texas.
Minnesota was an obvious choice, given that it was the closest swing state won by Donald Trump. Texas may seem like an unusual choice given that it's considered to be a solid red state and that it hasn't seen the type of ugly outbreak of COVID-19 (yet) that several other states have, but I happened to discover that unlike states like Florida and Georgia, Texas's Health Dept. dashboard makes it quite easy to download the historic case and fatality data I need to compile these charts, so I decided to go for it. The results in both states are interesting for different reasons.
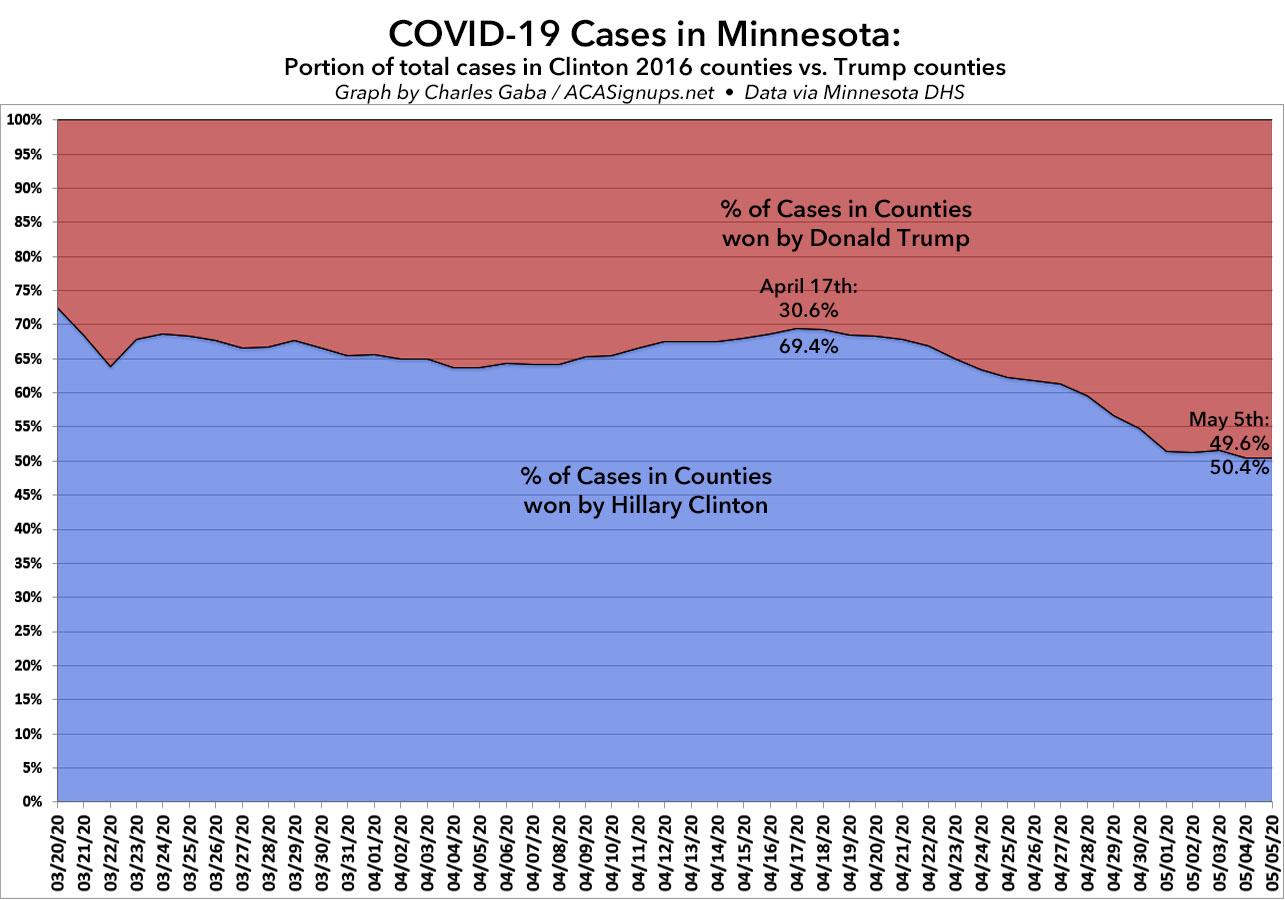
First up, Minnesota. Like Wisconsin and Michigan, Minnesota's COVID-19 cases started out heavily favoring Democratic-leaning parts of the state, with nearly 70% of them appearing in counties won by Hillary Clinton in 2016. However, also like Wisconsin in particular, there's been a dramatic shift away from blue counties towards red counties over the past two weeks...to the point that it's now nearly 50/50. This is an even more dramatic shift than in Wisconsin, which took over a month to make a similar move:
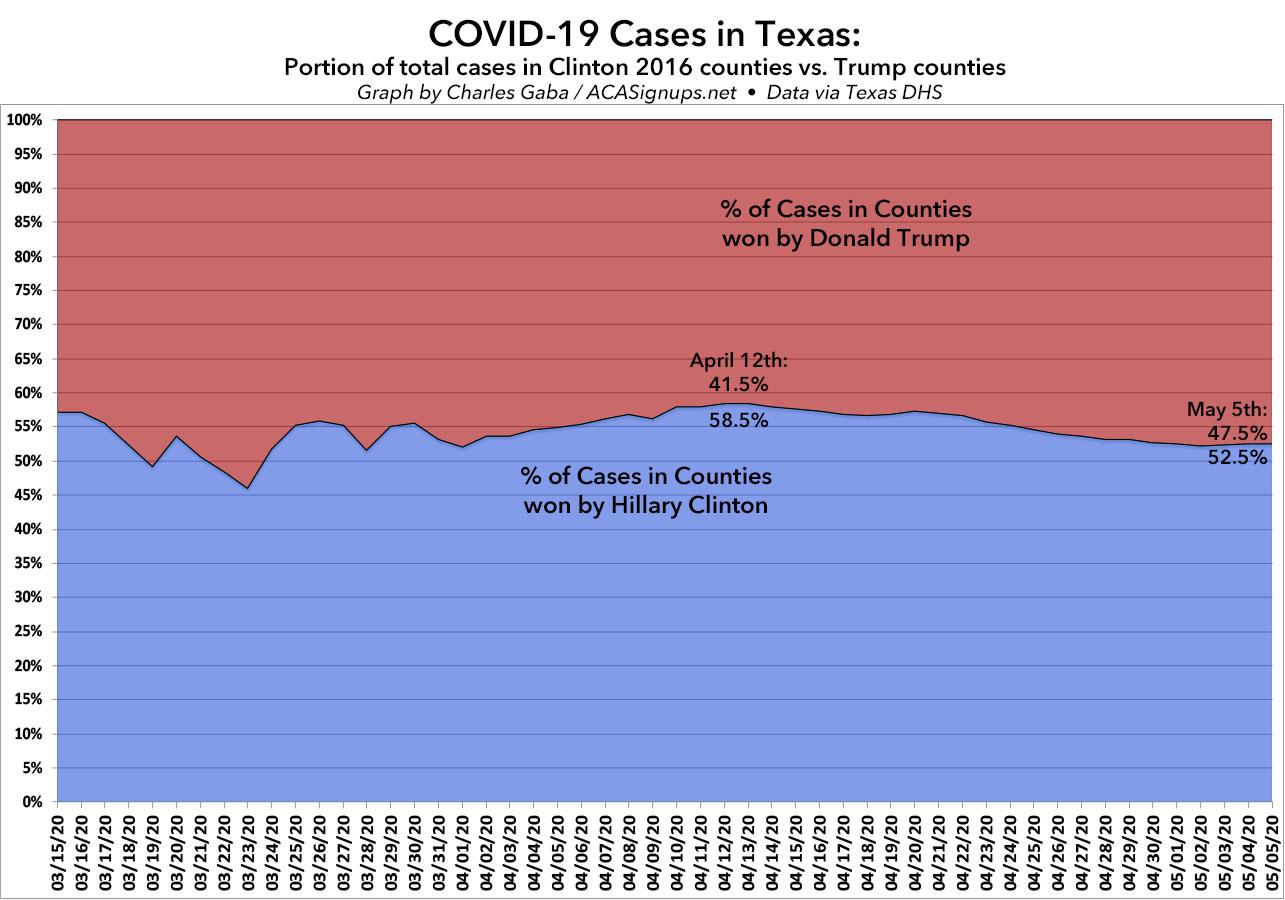
Texas, meanwhile, is more like Pennsylvania--while there's been a slight shift of COVID-19 cases from blue to red counties, on the whole it's been pretty steady. What makes this interesting is that it's Texas...you'd normally expect massive outbreaks in big cities like Houston and Dallas, but instead it seems to have been pretty evenly split going all the way back to mid-March. Huh.
Advertisement
