

Week 5 HC.gov Snapshot Report: Just as I expected: 504K QHPs
Wed, 12/04/2019 - 2:13pm
I'm just putting this out there today because I know there's gonna be a bunch of eye-rolling stories completely misunderstanding the data later on this week.
Last Wednesday, the Week 4 HealthCare.Gov Snapshot Enrollment Report came out and showed a "mysterious" 41% increase in ACA exchange enrollments for the week vs. last year...jumping from 500,437 QHP selections to 703,556 QHP selections for the corresponding week this year.
This Wednesday, the Week 5 snapshot report will come out and will almost certainly show a "mysterious" large drop in ACA exchange enrollments vs. last year...from 772,250 down to perhaps 500,000 or so.
Around 7,000 or so of this drop will likely be due to Nevada splitting off onto their own ACA exchange. A small number will be due to Idaho expanding Medicaid. But the vast bulk of this seemingly disastrous ~35% drop will be for a far simpler reason...the same one which caused the seeming 41% spike last week: Thanksgiving.
Last year, Thanksgiving fell on November 22nd and was counted as part of Week 4. This year it fell on November 28th and will be counted as Week 5.
Since enrollments always plummet during Thanksgiving week, this showed up as a massive spike last year...which will be cancelled out by a massive drop this year.
Federal Health Insurance Exchange Weekly Enrollment Snapshot: Week 5, Nov 24-30, 2019
In week five of the 2020 Open Enrollment, 504,041 people selected plans using the HealthCare.gov platform. As in past years, enrollment weeks are measured Sunday through Saturday. Consequently, the cumulative totals reported in this snapshot reflect one fewer day than last year.
Every week during Open Enrollment, the Centers for Medicare & Medicaid Services (CMS) will release enrollment snapshots for the HealthCare.gov platform, which is used by the Federally-facilitated Exchange and some State-based Exchanges. These snapshots provide point-in-time estimates of weekly plan selections, call center activity, and visits to HealthCare.gov or CuidadoDeSalud.gov.
The final number of plan selections associated with enrollment activity during a reporting period may change due to plan modifications or cancellations. In addition, the weekly snapshot only reports new plan selections and active plan renewals and does not report the number of consumers who have paid premiums to effectuate their enrollment.
I've baked the hard numbers into my week-by-week/cumulative spreadsheet:
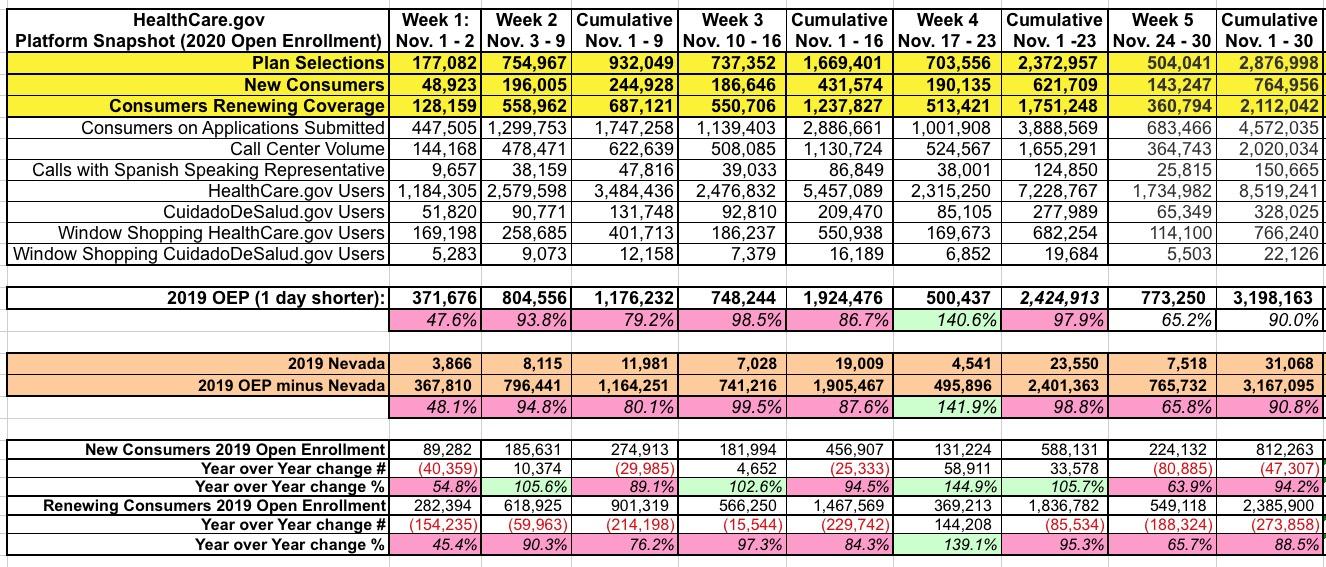
Sure enough, total enrollments are cumulatively back down 10% year over year, right around where I figured they'd be at this point. It's actually down just 9% when you account for Nevada splitting off onto their own platform, and of course there's still one day missing due to the calendar differences. New enrollments are down 6%, while renewals are still down 11.5% vs. last year.
Here's the state-by-state breakout, including prior data. On a per-day average, HC.gov is down around 6% year over year:
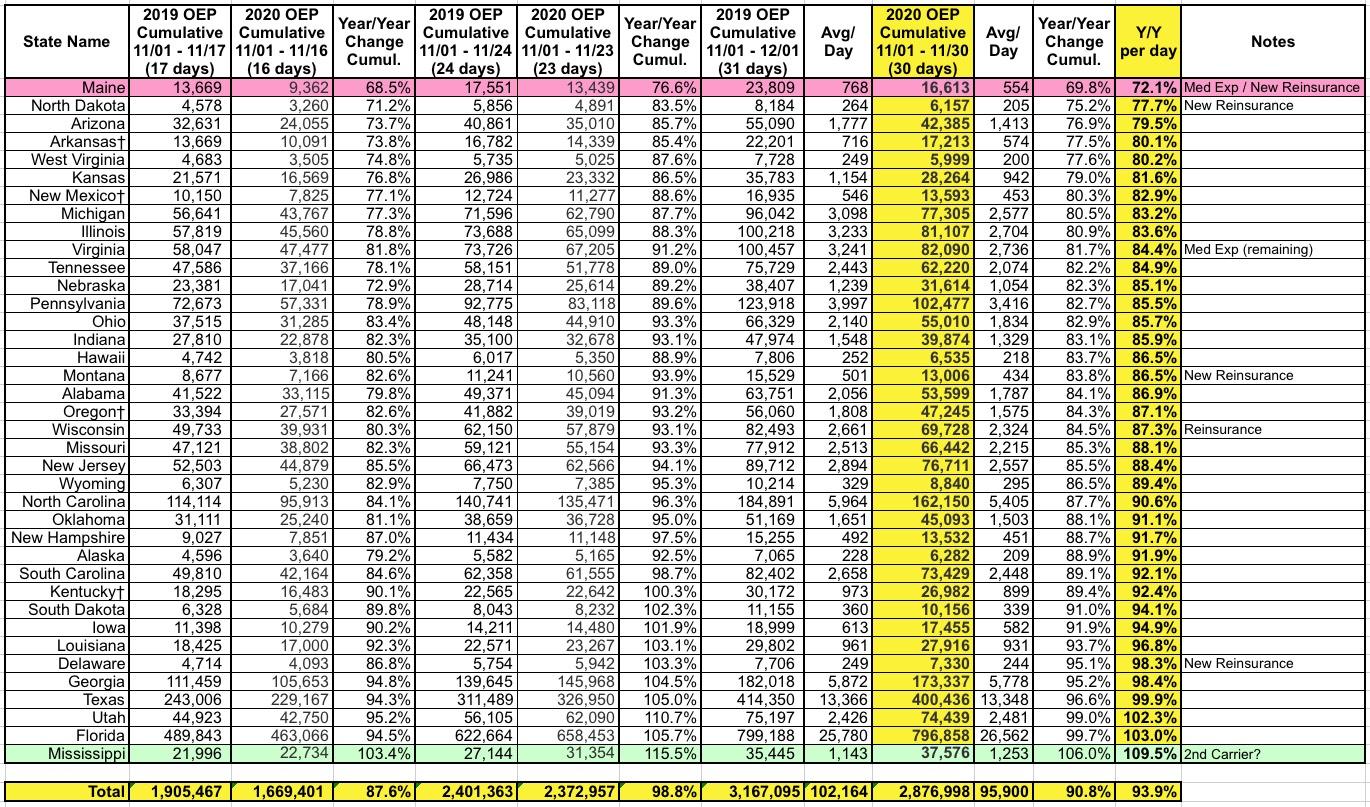
Mississippi continues to be the top performer vs. last year, running nearly 10% ahead of last year on a per-day average, while Maine continues to be the worst-performing, mainly (hah!) due to their Medicaid expansion. Medicaid expansion is also likely the cause of at least a small part of Virginia's drop, as they didn't complete transferring low-income exchange enrollees over last year to my knowledge.
Advertisement
