

Texas Fold'em: How many would lose coverage & how much money would YOUR district lose?
Tue, 07/09/2019 - 1:47am
In March 2019, Linda J. Blumberg, Matthew Buettgens, John Holahan and Clare Wang Pan of the Urban Institute ran a detailed analysis to determine what the impact on healthcare coverage would be in every state if the Texas vs. U.S. lawsuit (aka Texas vs. Azar or #TexasFoldEm) caused the Patient Protection & Affordable Care Act (ACA) to be repealed with immediate effect.
They also attempted to calculate how much federal funding every state would lose each year if the ACA were to be repealed. Nationally, they concluded that the U.S uninsured rate would increase by nearly 20 million people, while the 50 states (+DC) would collectively lose out on nearly $135 billion in federal funding.
Over the past few weeks, for my debut healthcare data analysis project with the Center for American Progress, I worked with CAP analyst Emily Gee to break out the Urban Institute's state-level estimates into all 435 Congressional Districts.
In this entry, I've taken the work I've done with CAP and gone one step further, by also roughly breaking out the loss in federal funding at the Congressional District level. This wasn't able to be completed in time to make the CAP post (which understandably requires more lead time and editorial review), so I'm presenting it here instead.
It's important to clarify that while the CD-level projections for net coverage losses have been run through CAP's analytical modeling, my CD-level federal funding loss estimates are based on a simple proportional model: If a given district shows 20% of the statewide coverage losses, I'm assuming a corresponding 20% portion of the federal funding loss. I recognize that this isn't the most accurate way of doing it, but it's the best I could come up with. At the very least it should give some sense of the amount of money being lost which we're talking about here.
BUT THAT'S NOT ALL!
I've also gone further yet by tallying up the coverage loss and federal funding loss using a different method to see how it compares with the Urban's Institute's numbers.
The Urban analysis uses a sophisticated model which includes accounting for factors like pre-ACA Medicaid expansion waivers, the partial offset of coverage losses due to a small increase in people enrolling in employer-based coverage, and some people enrolling in non-ACA compliant policies (non-comprehensive/discriminatory short-term plans and the like).
My own methodology is far cruder: I simply calculated how many people are receiving federal ACA individual market exchange subsidies, how many people are currently enrolled in Medicaid via ACA expansion (as well as the ACA-funded Basic Health Programs in Minnesota and New York), and then figured out roughly how much federal funding is being provided to all three of those programs now.
The data for my own estimates comes from Centers for Medicare & Medicaid 2019 Open Enrollment Period Public Use File and the corresponding enrollment reports from the twelve state-based ACA exchanges.
To calculate the number of people who would lose subsidized individual market policies, I first took the number of Qualified Health Plan (QHP) selections as of the end of the 2019 Open Enrollment Period who were deemed eligible to receive Advance Premium Tax Credits (APTC), or 9.71 million people nationally. I then used 80% of that number (7.77 million nationally), since that's consistently fbeen the national average monthly effectuation ratio for four years running.
To calculate the number who would lose coverage via ACA Medicaid expansion ending, I used the most-recent hard expansion enrollment data I could find for each state. The sources for this vary depending on the state, so the "as of" date ranges from as far back as October 2017 for Arizona to as recently as late June 2019 for Michigan, for a national total of over 16.7 million people. It's important to note that Medicaid enrollment in each state may change significantly from week to week due to the high churn rate, and of course in states like Arkansas where draconian work requirements have already been imposed there are thousands of people being kicked off of the program every month.
Minnesota and New York also have additional "lost coverage" numbers included from their ACA-funded Basic Health Programs (BHP). These enrollment numbers come straight from official reports from either the state (for Minnesota) or the state exchange (for New York).
For the loss of APTC funding in each state, I again used CMS's Public Use File (PUF) and state-based exchange reports, which include average per-enrollee monthly subsidy amounts for those who qualify for subsidies, multiplied by twelve.
For the lost Medicaid expansion funding, I took the total spending on Medicaid expansion in 2017 and then took 90% of that amount. I had to make some corrections for California and New York (which both had some confusing funding/reimbursement issues at the time). I didn't use the "Federal Spending" column from the Kaiser Family Foundation's table because the federal portion of expansion spending is already scheduled to drop to 90% starting in 2020, so it's more reasonable to use the 90% figure.
Finally, for the lost BHP funding in Minnesota and New York, I used this 2017 budget report from the Minnesota state legislature and this report on New York's Essential Plan program from the Empire Center, which I extrapolated forward for 2019 to get an even $4.0 billion. Again, these numbers are not exact but should be pretty close to the actual 2019 amounts.
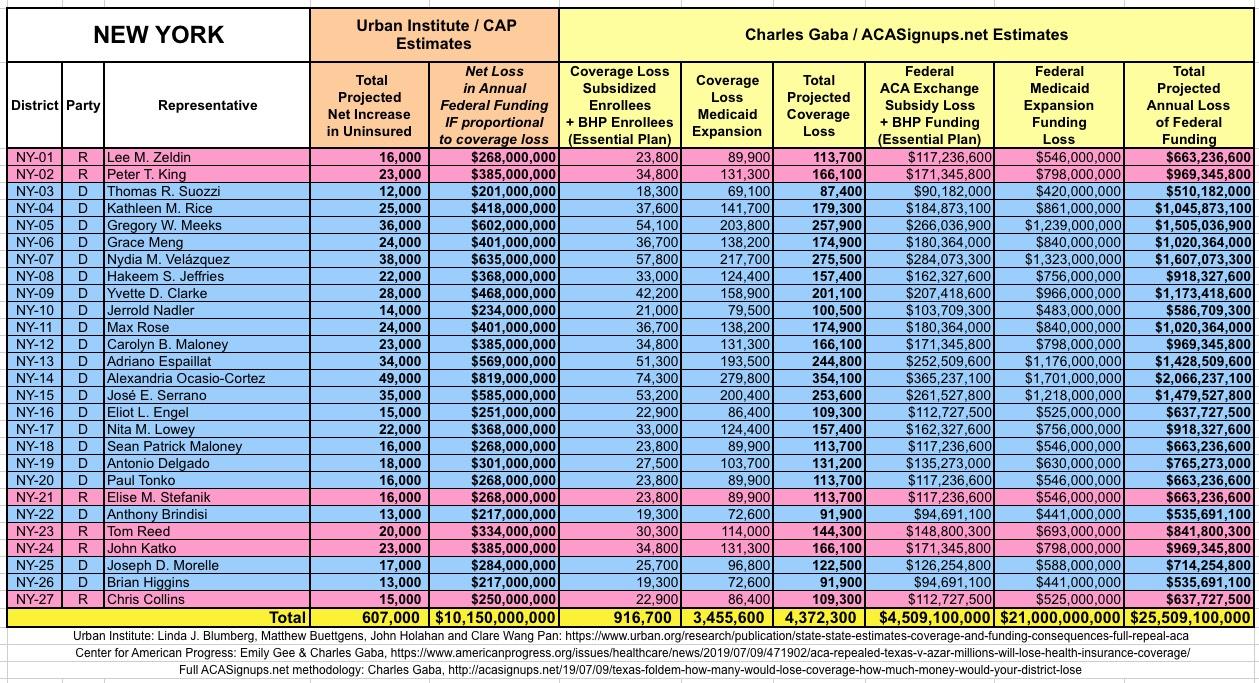
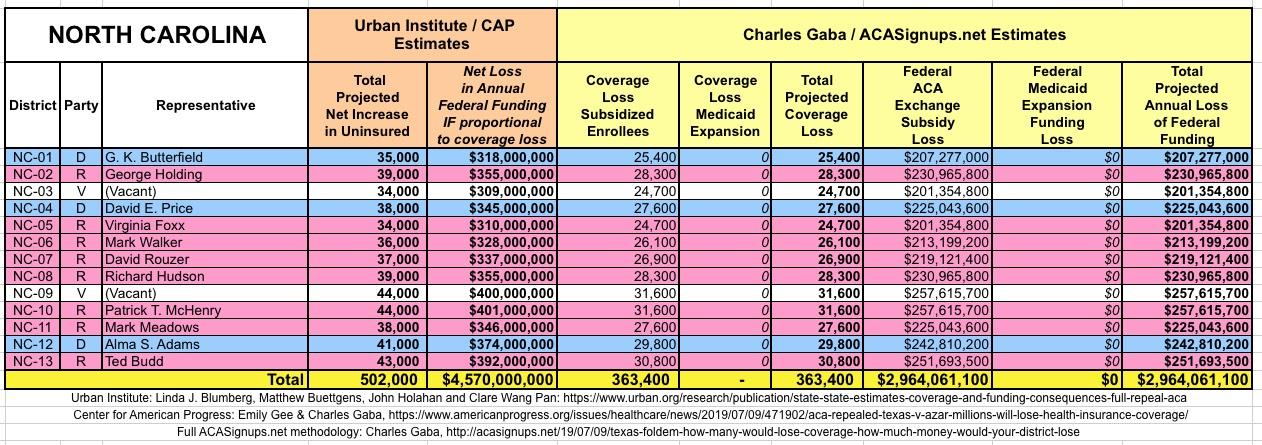
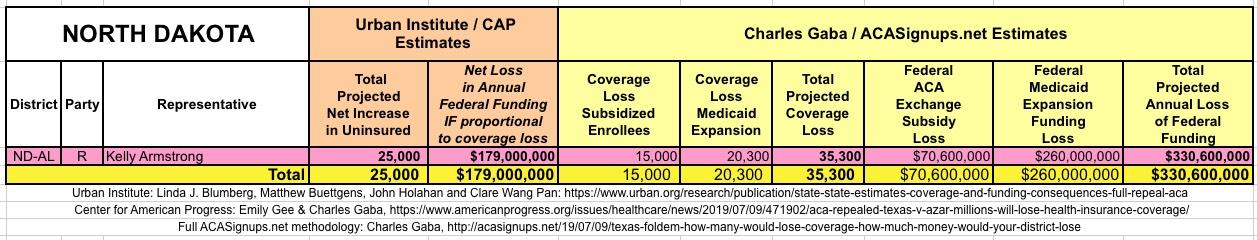
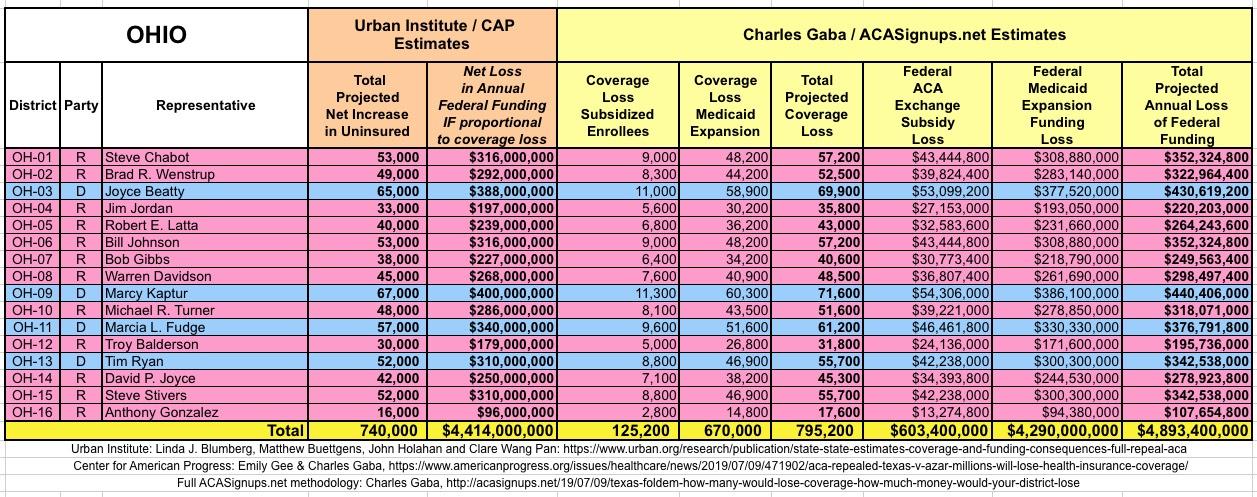
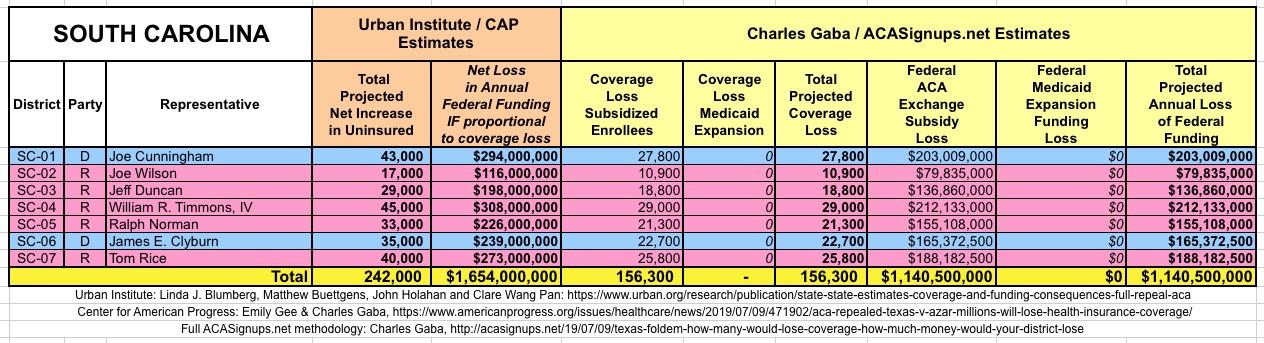
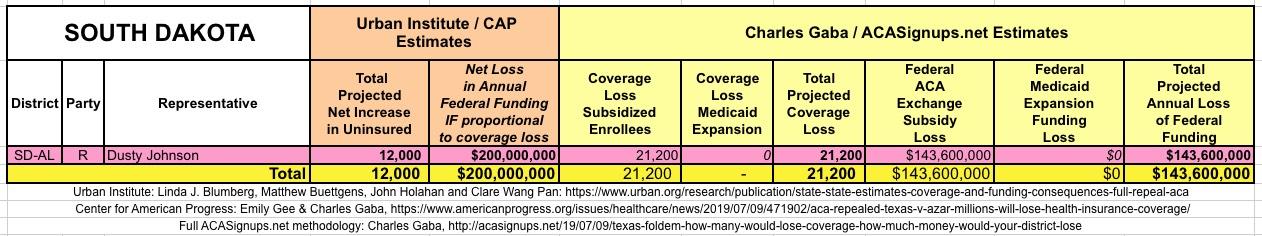
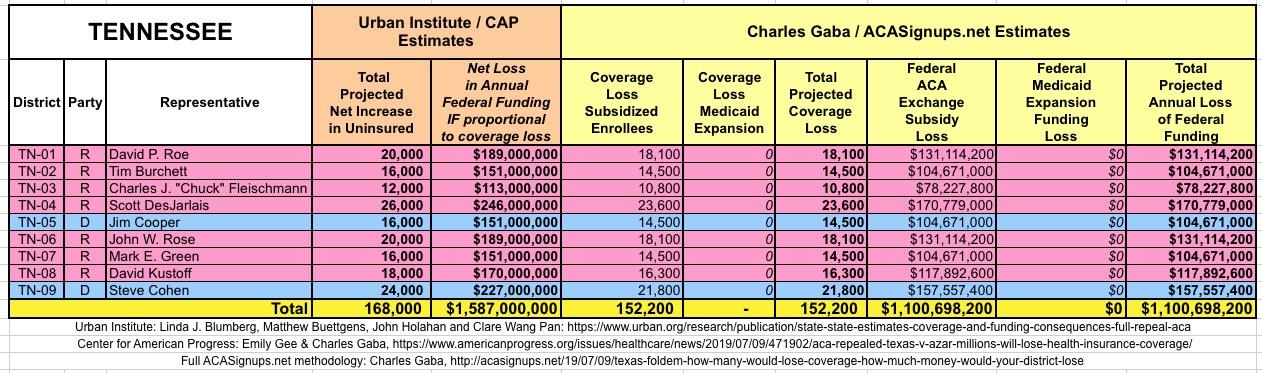
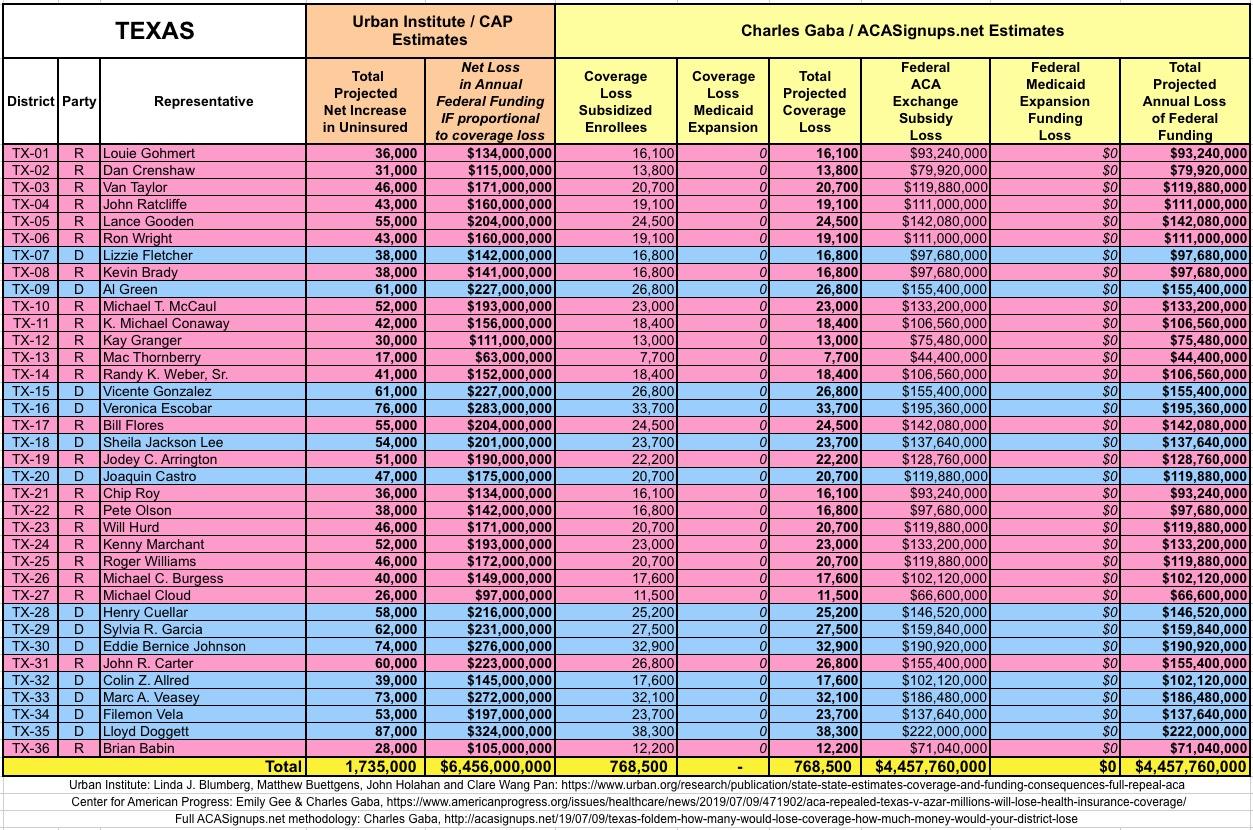
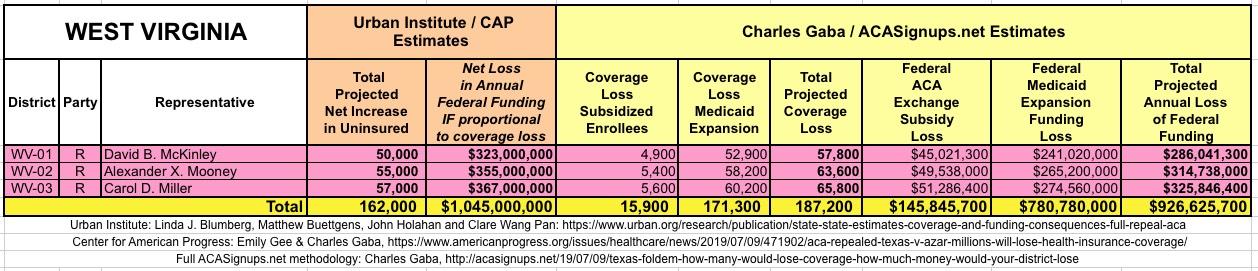
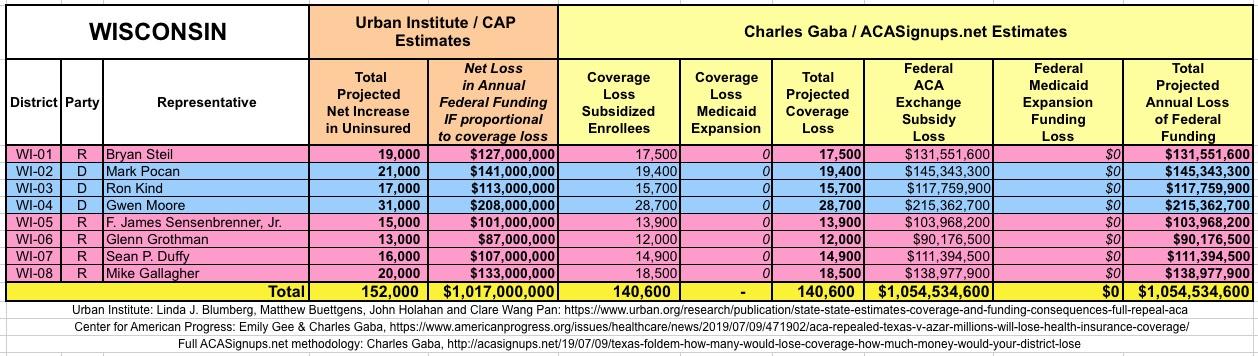
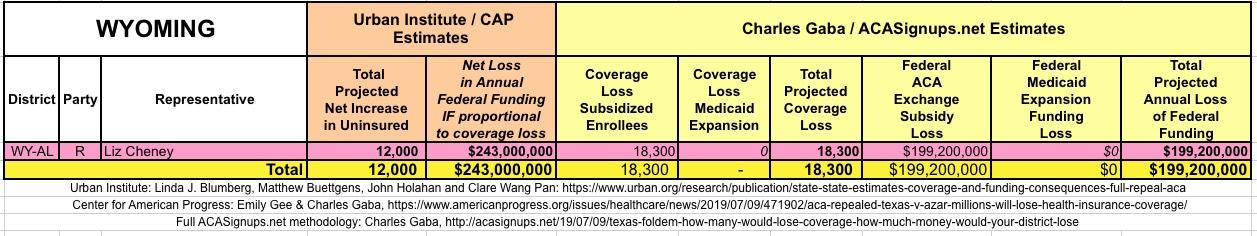
Given the different methodologies between Urban/CAP and myself, some of my numbers (both coverage and funding losses) are quite different from Urban's/CAPs. For instance, nationally, I put the coverage losses over 5 million higher than Urban/CAP (25.4 million) because I didn't include some people shifting to employer or non-ACA compliant plans. Similarly, my estimate of the loss of federal funding came in around $10 billion higher than Urban/CAP ($145 billion vs. $134.7 billion).
The Urban/CAP numbers are probably more accurate, but mine have one advantage: I've broken out both the coverage losses and funding losses by category (Individual Exchange Market/BHP and Medicaid Expansion). In addition, I've color-coded the Congressional Districts by which party each U.S. Representative is a member of.
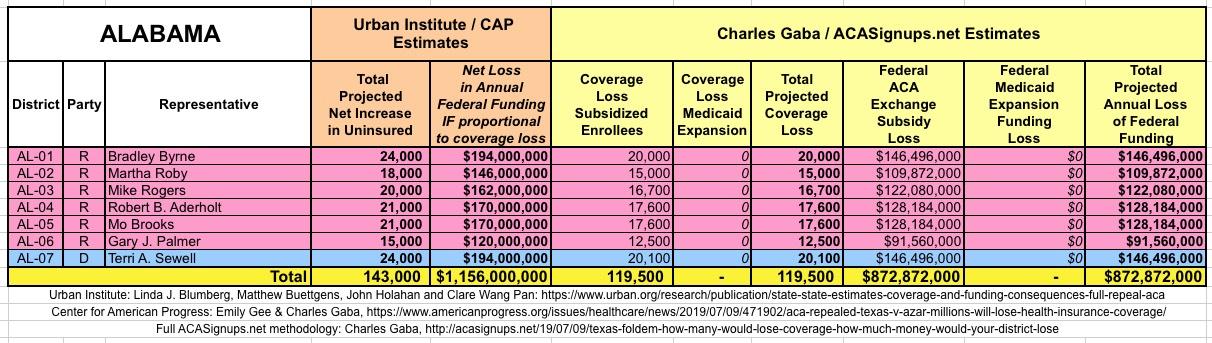
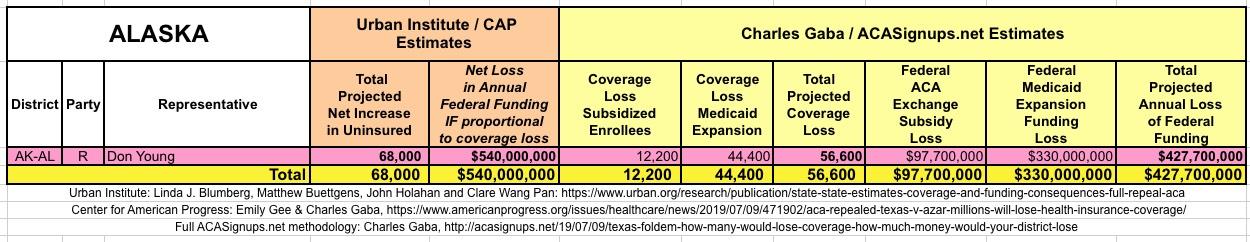
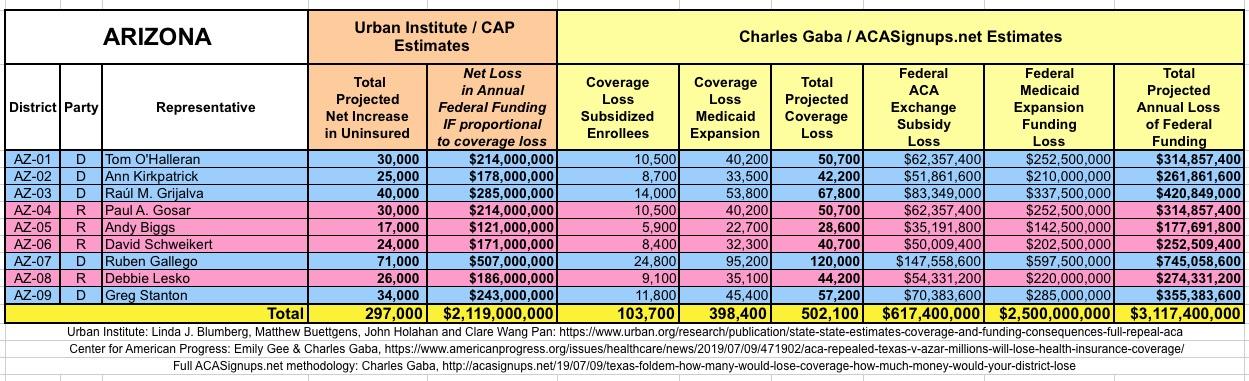
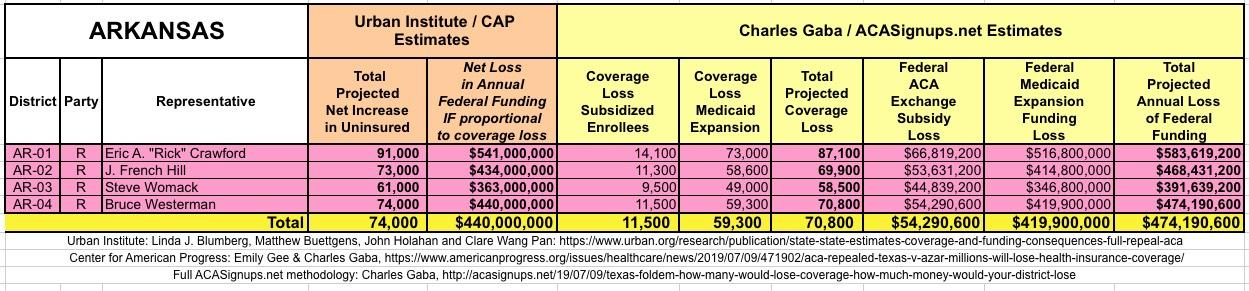
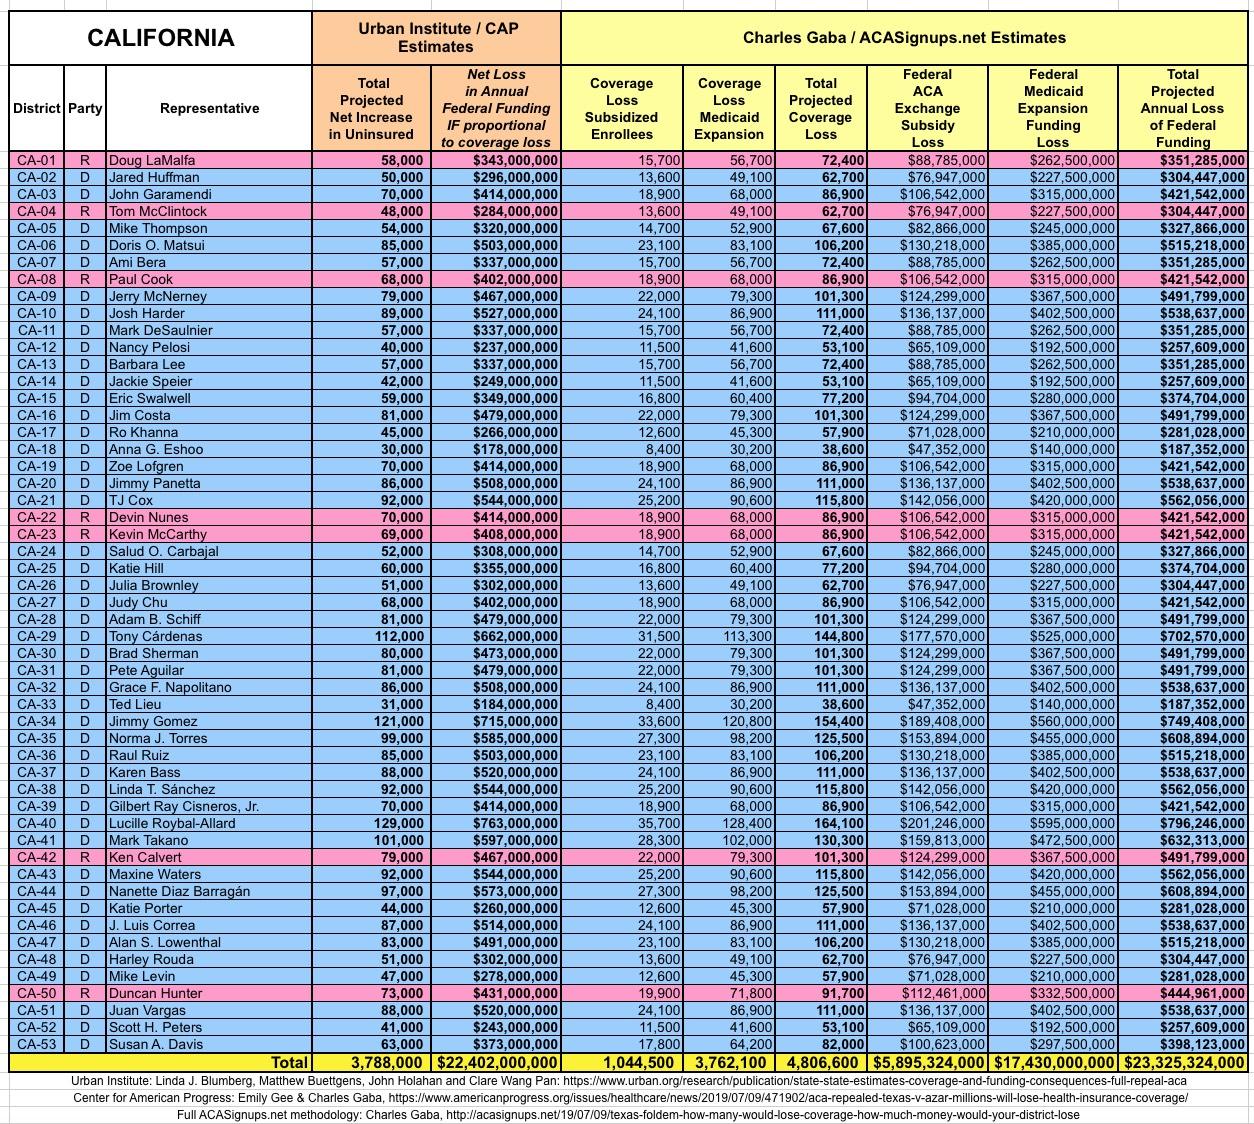
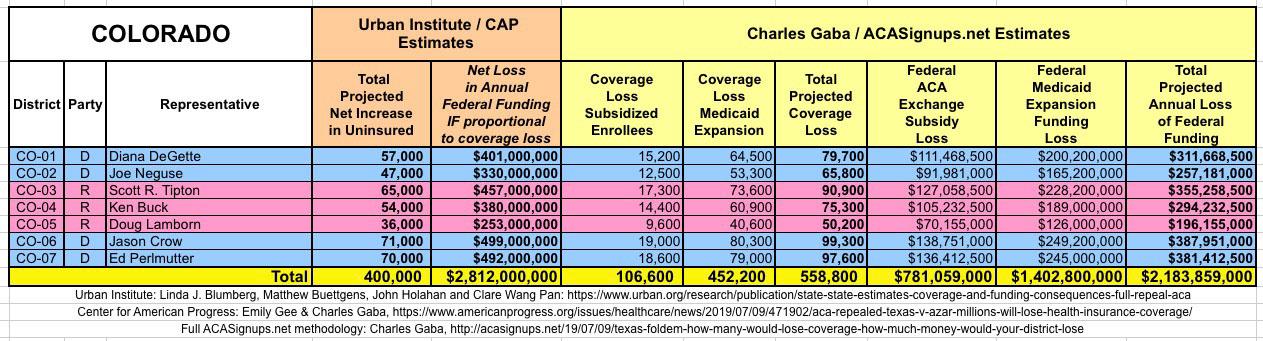
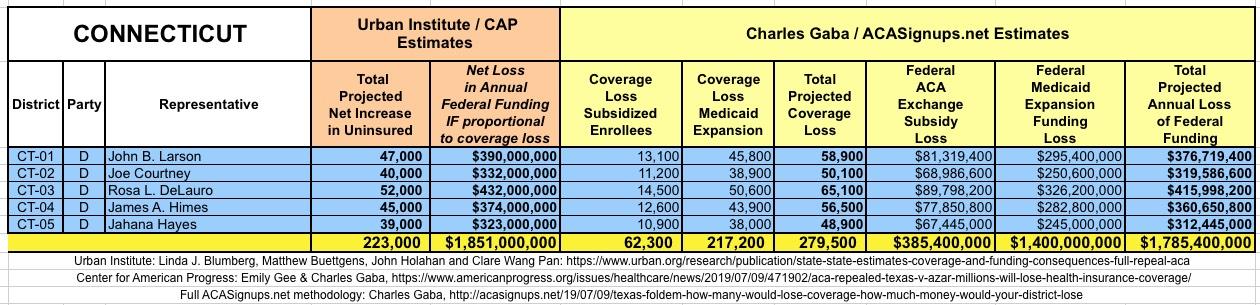
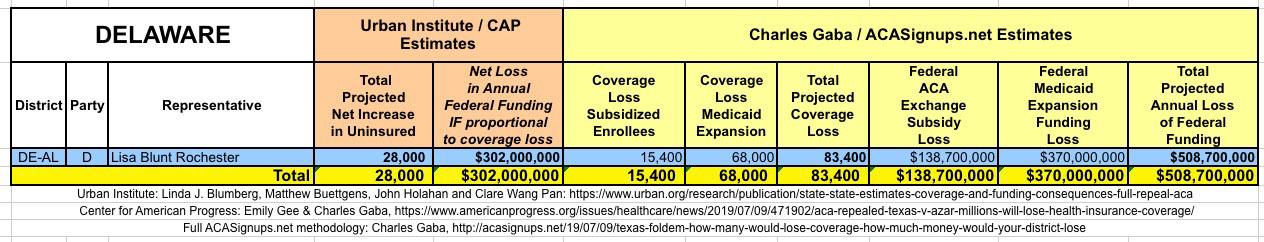
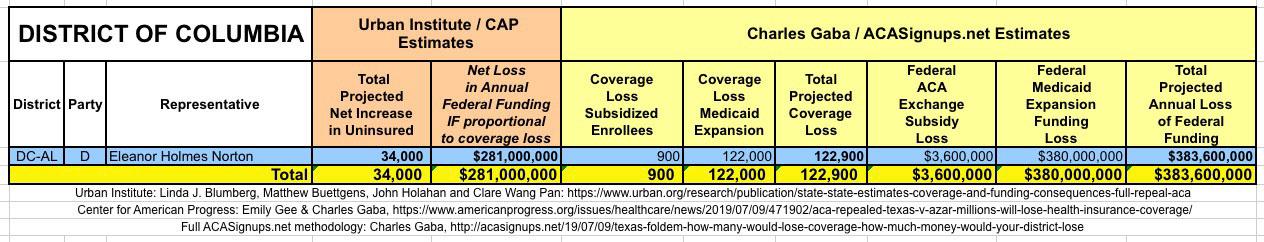
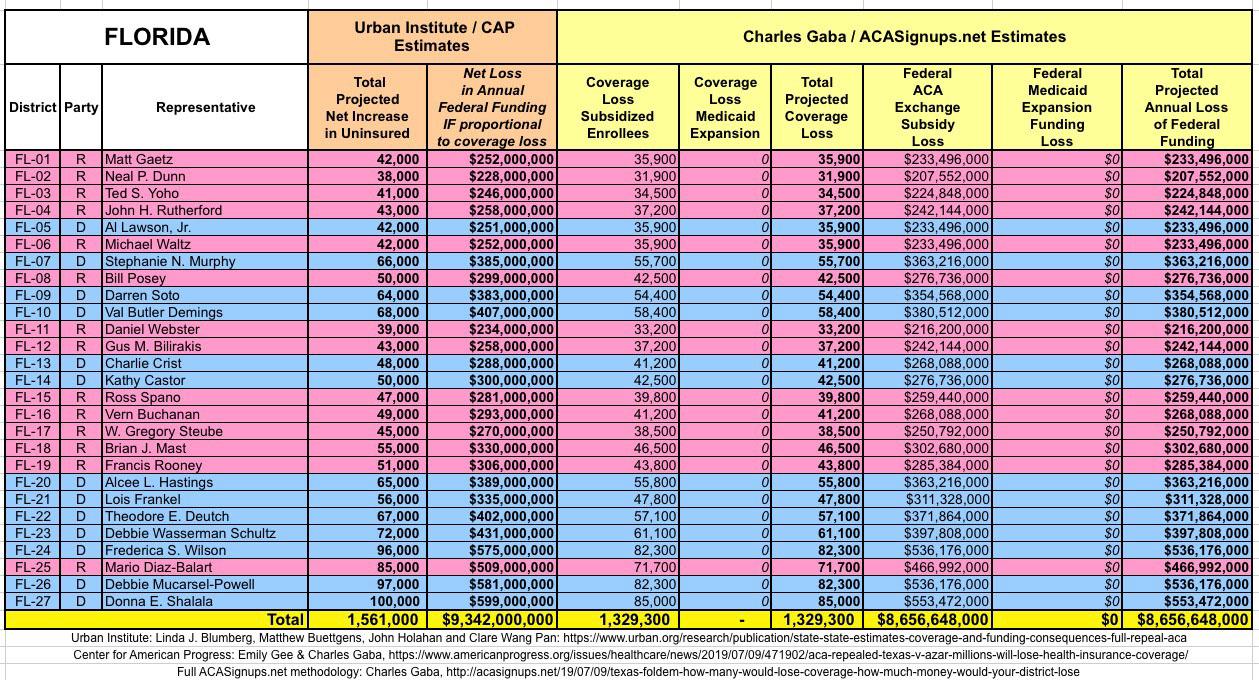
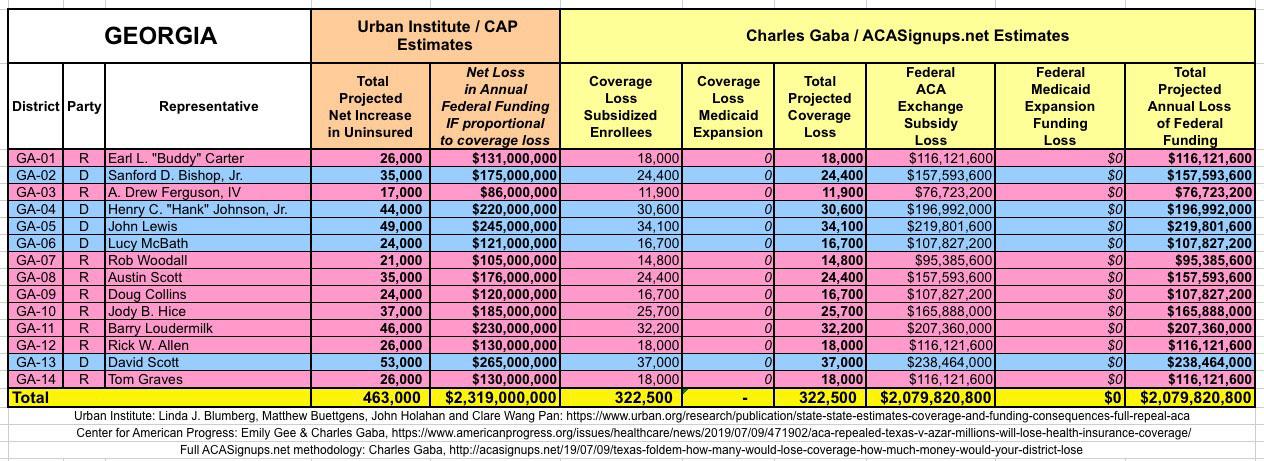
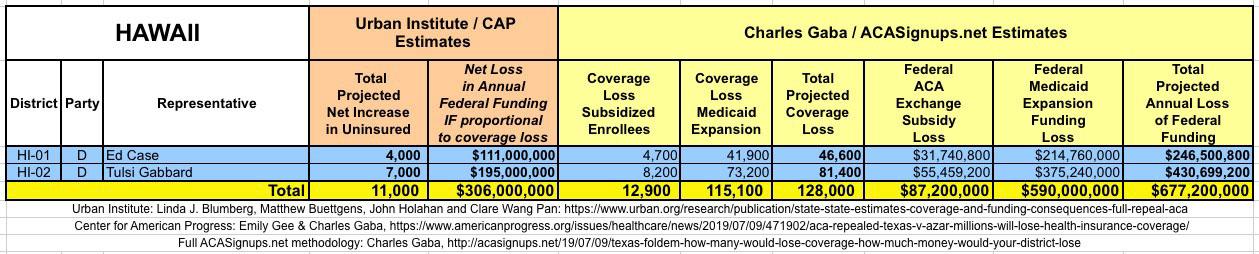
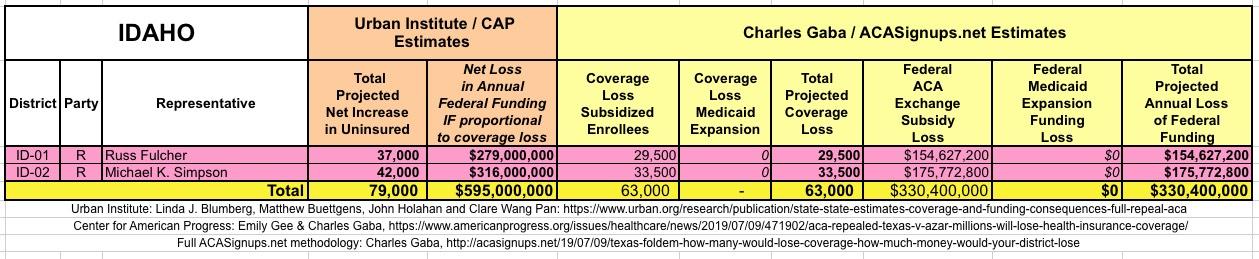
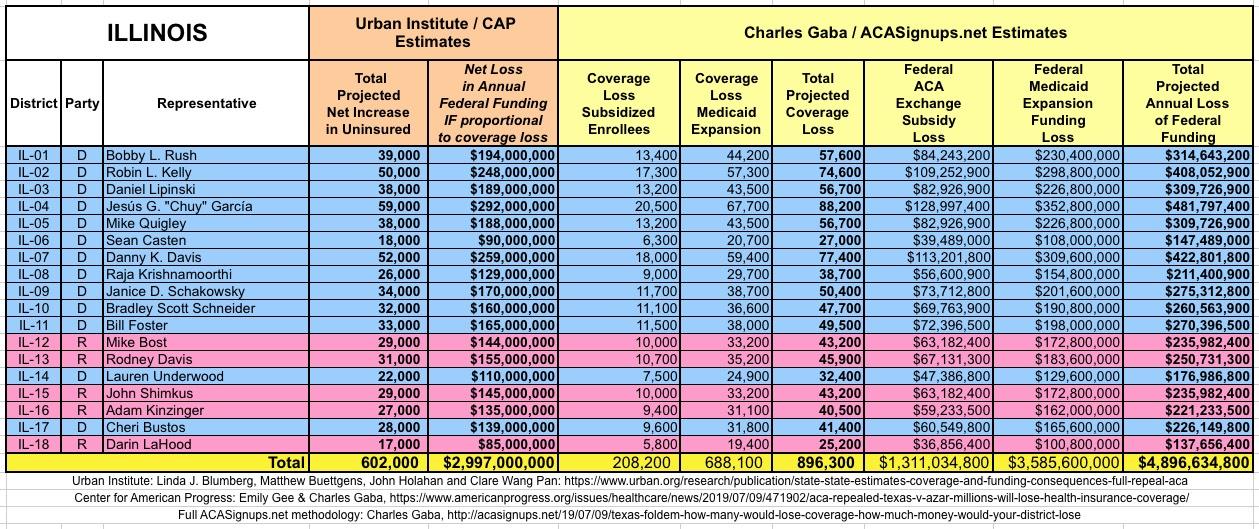
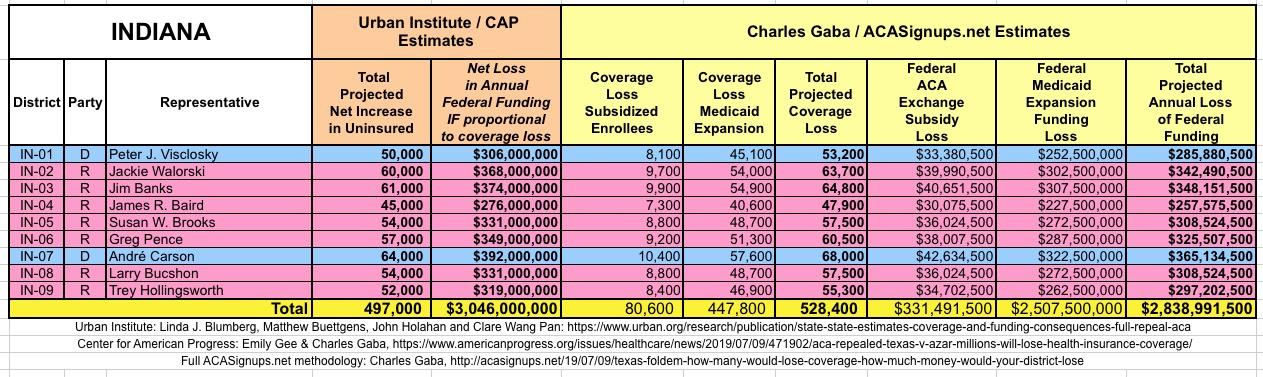
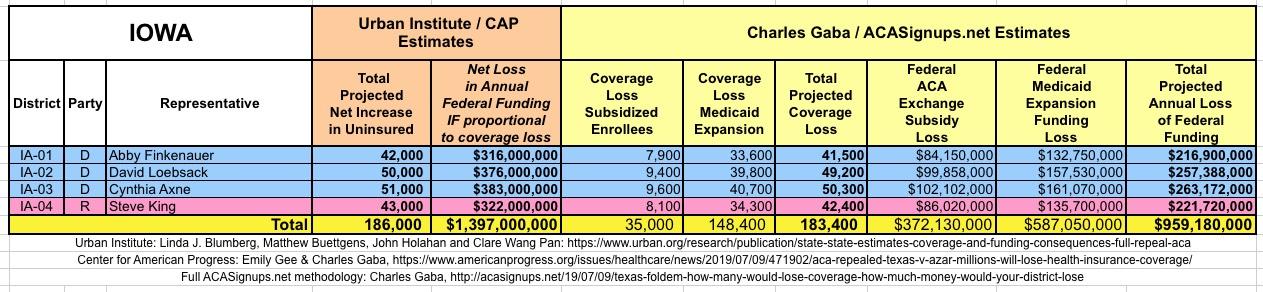
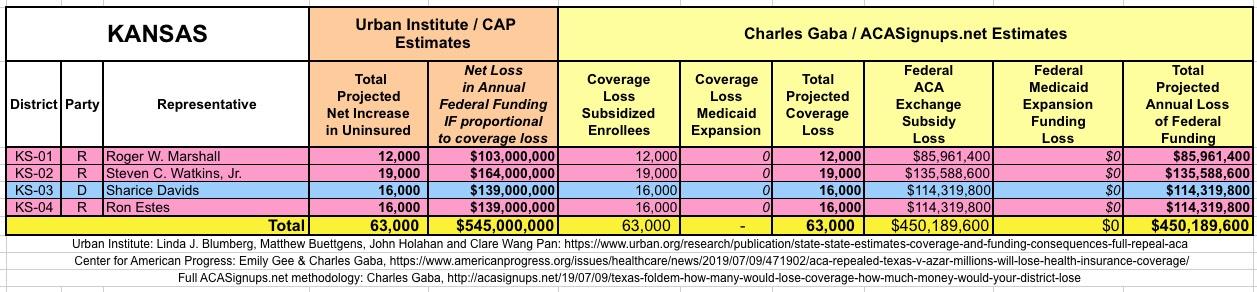
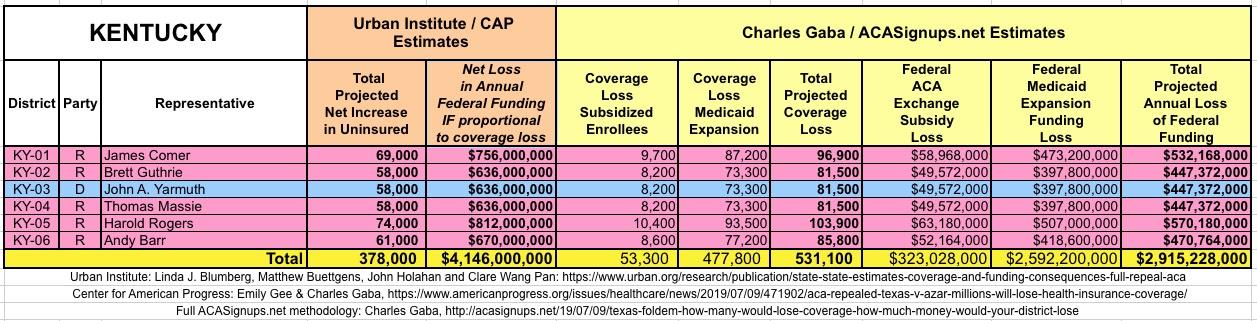
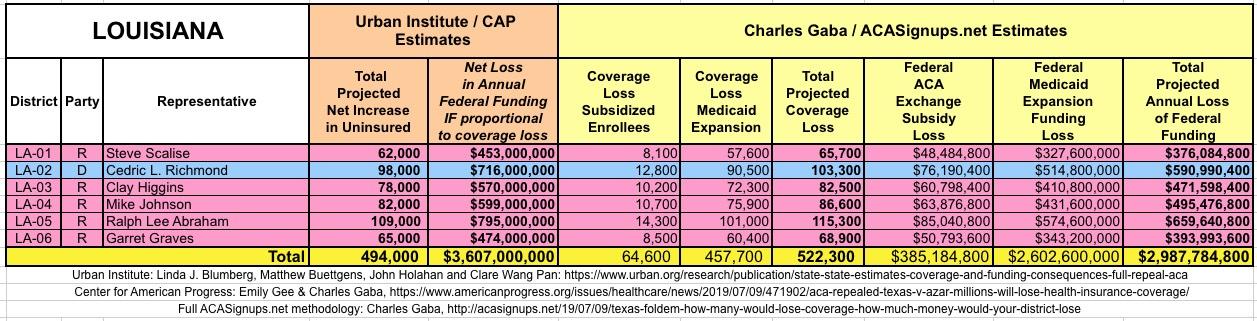
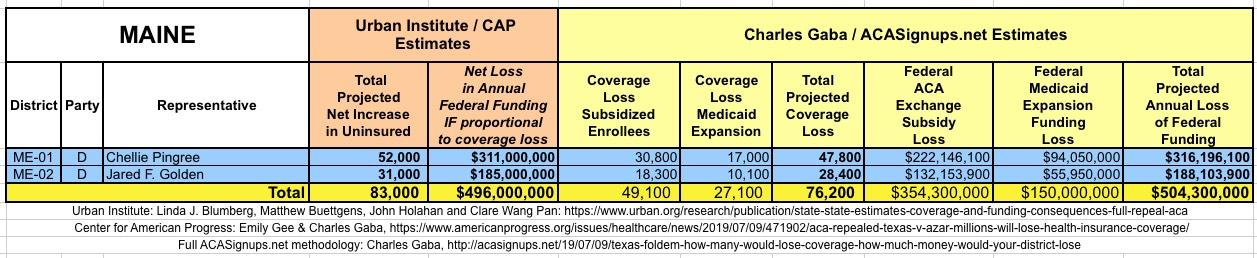
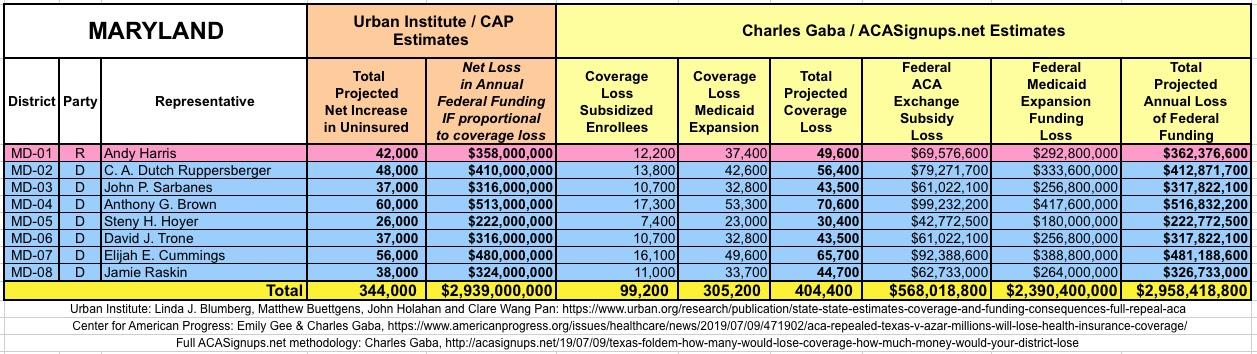
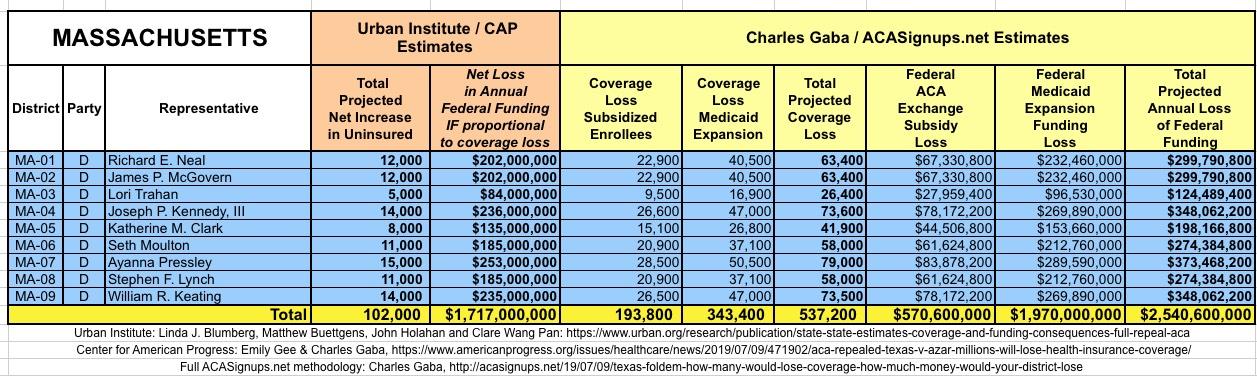
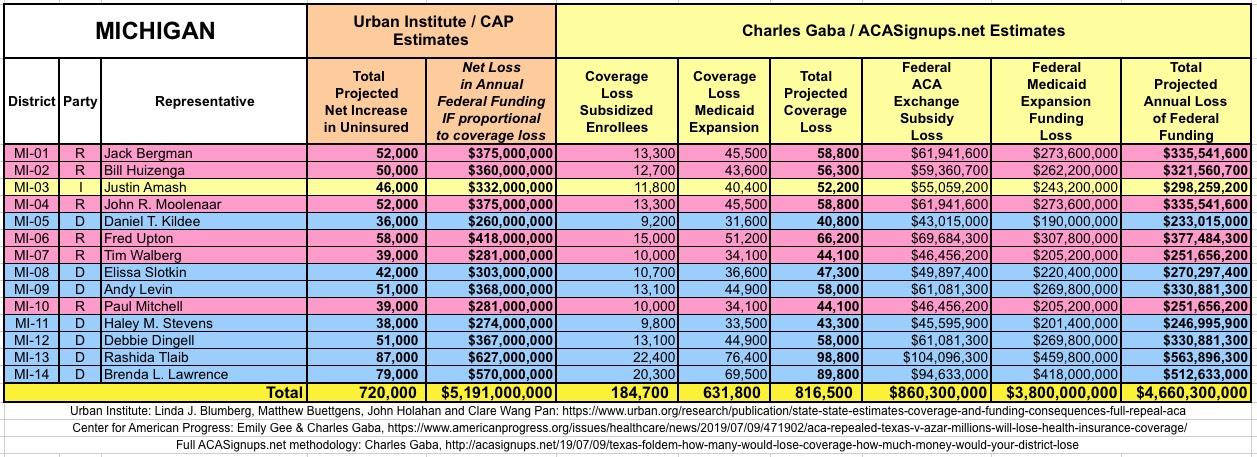
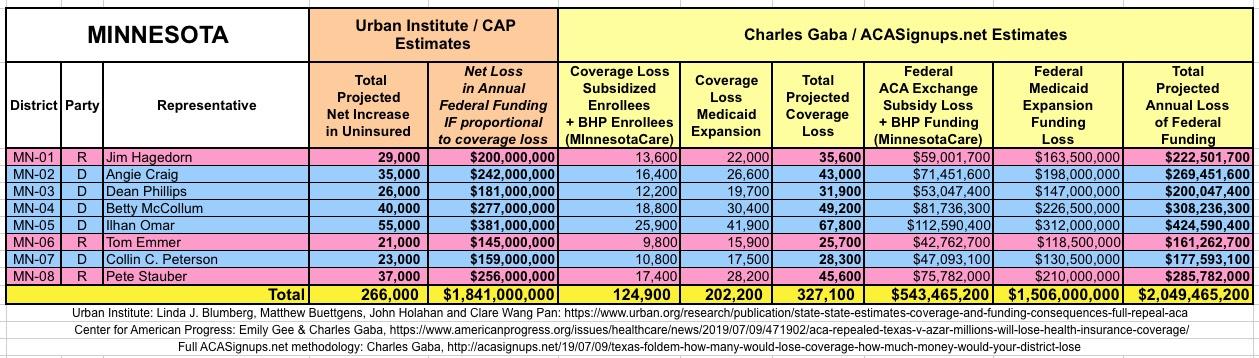
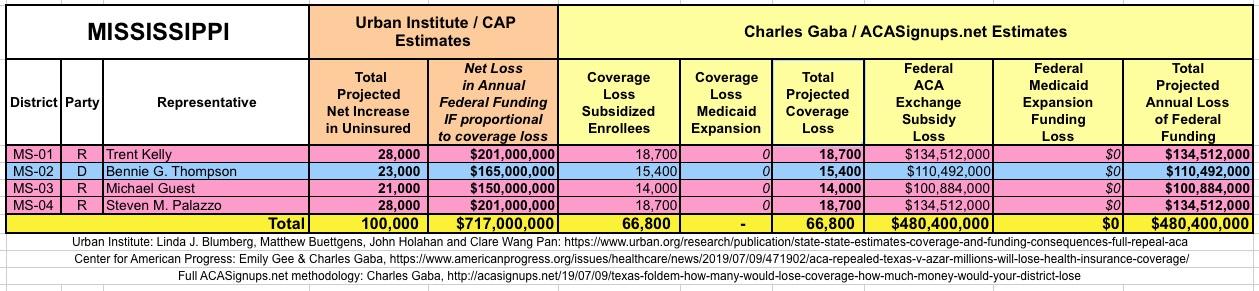
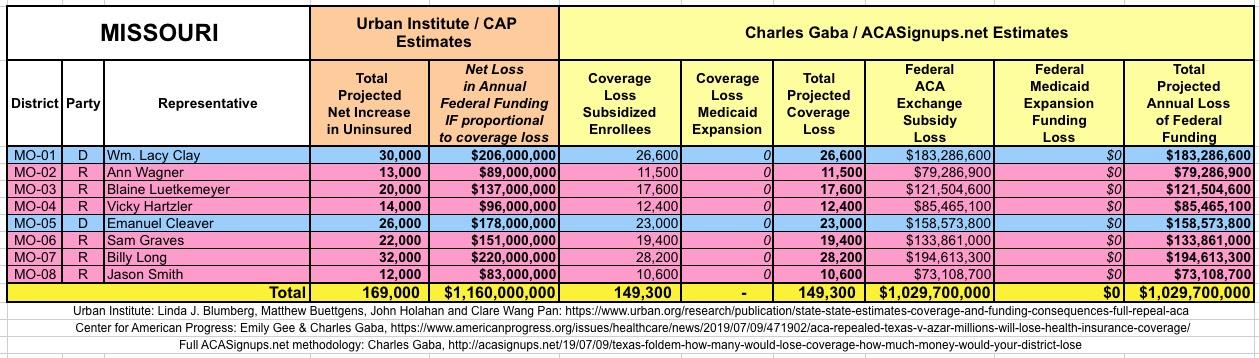
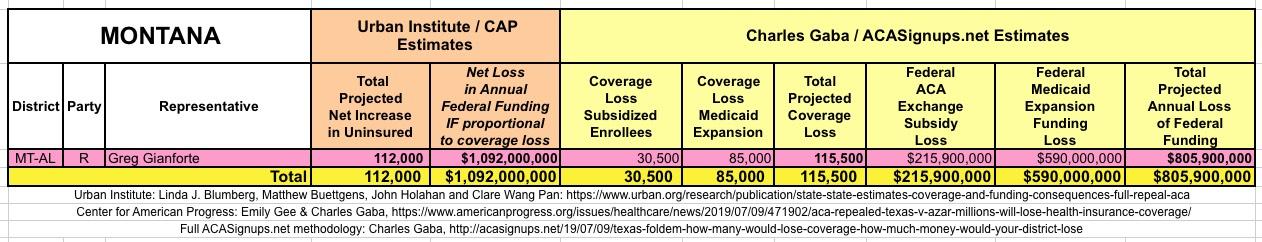
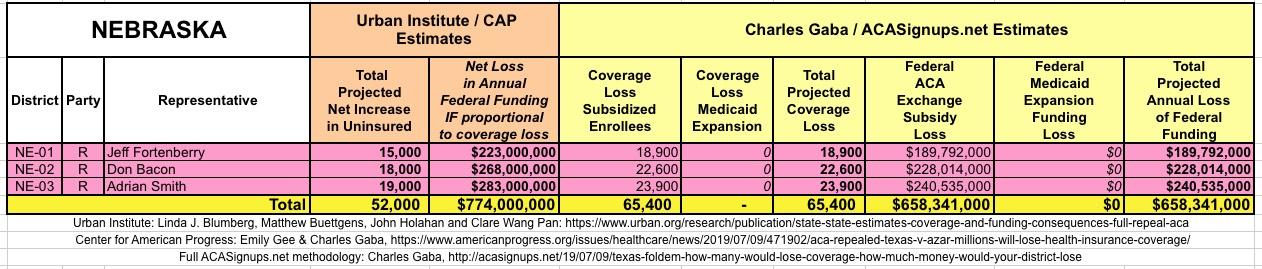
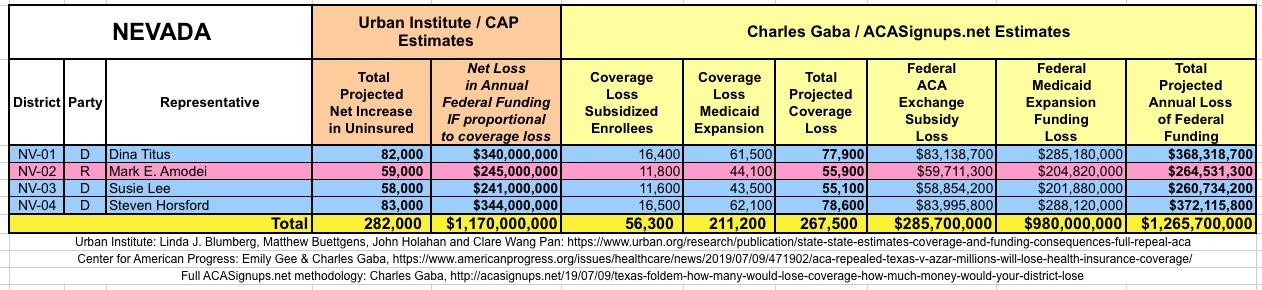
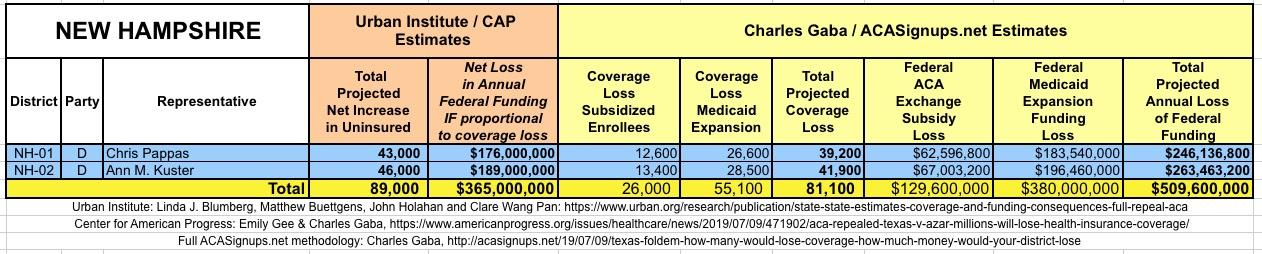
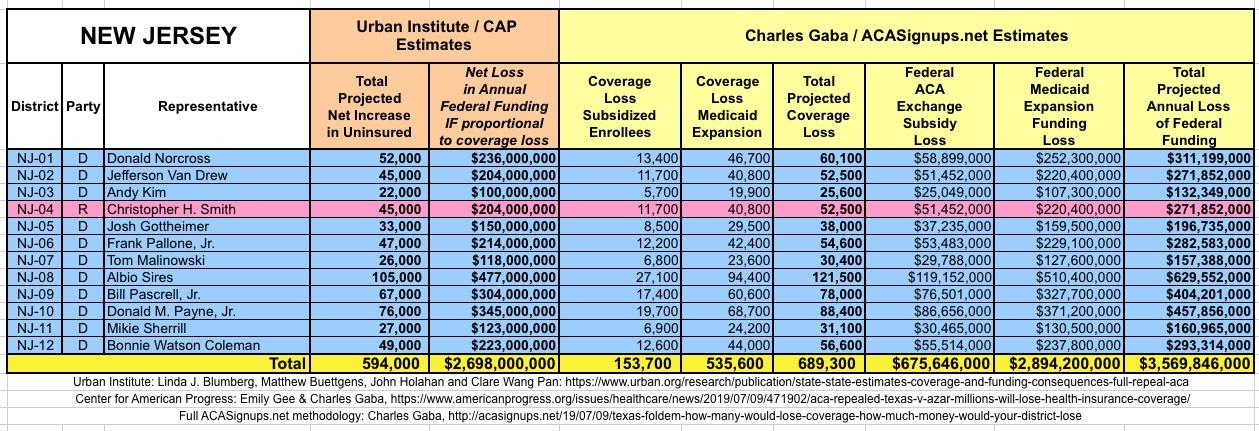
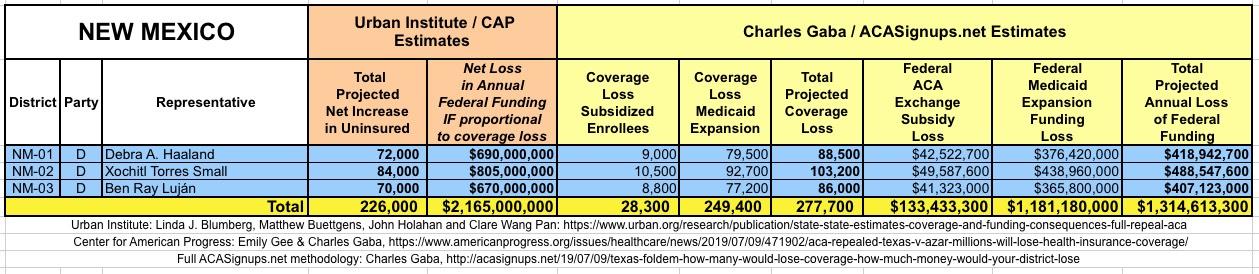
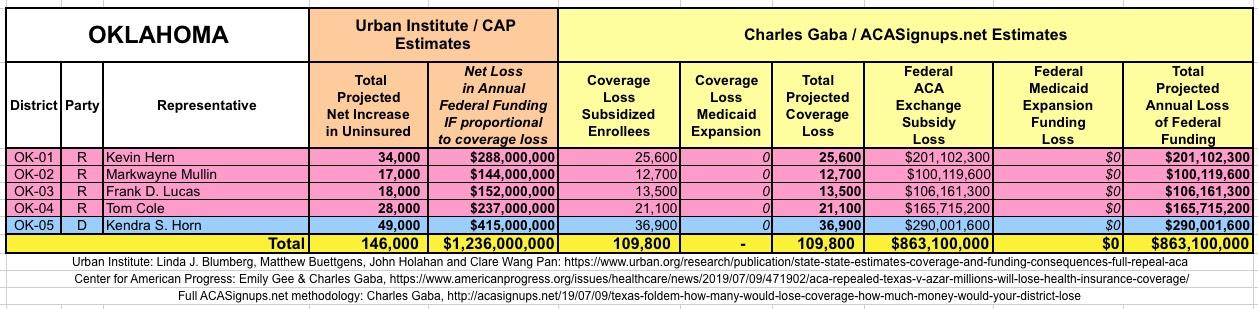
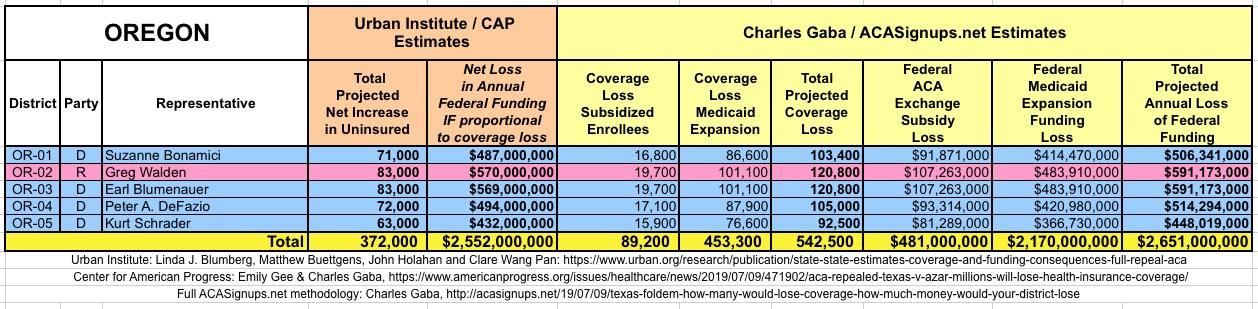
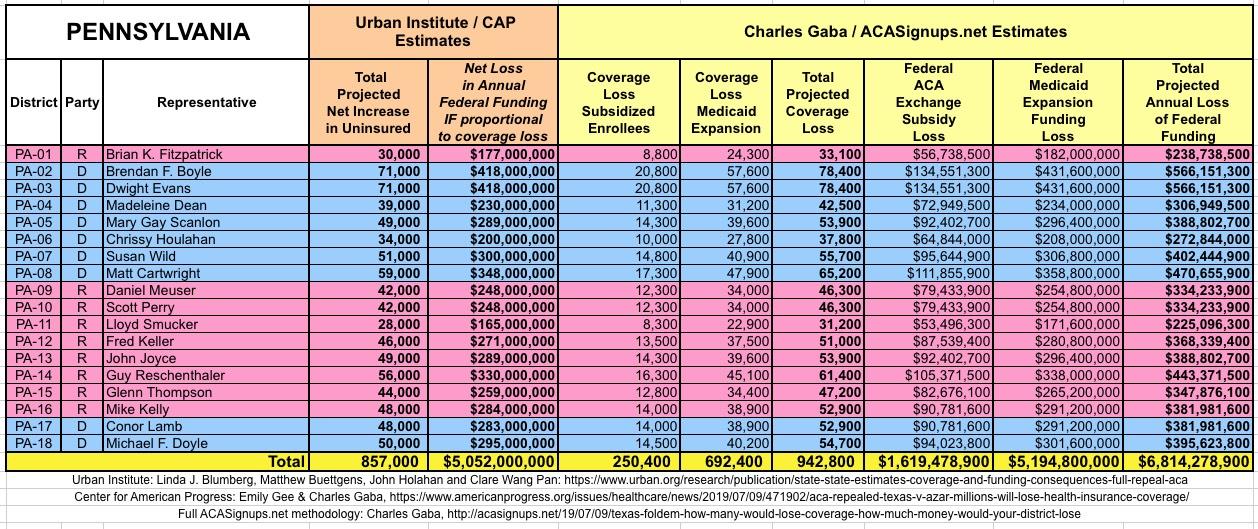
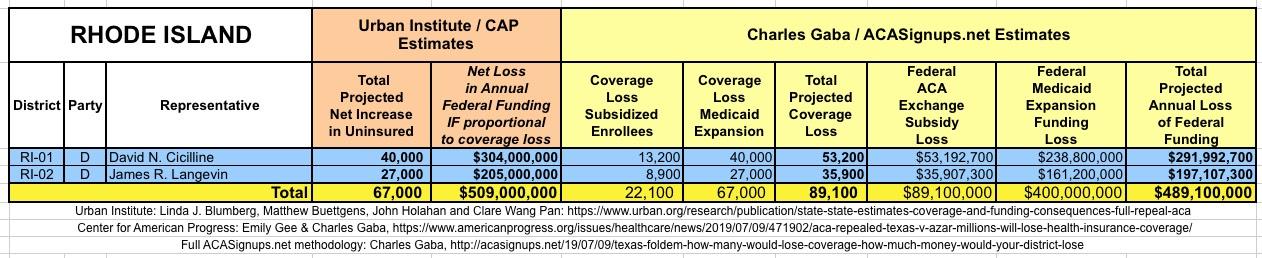
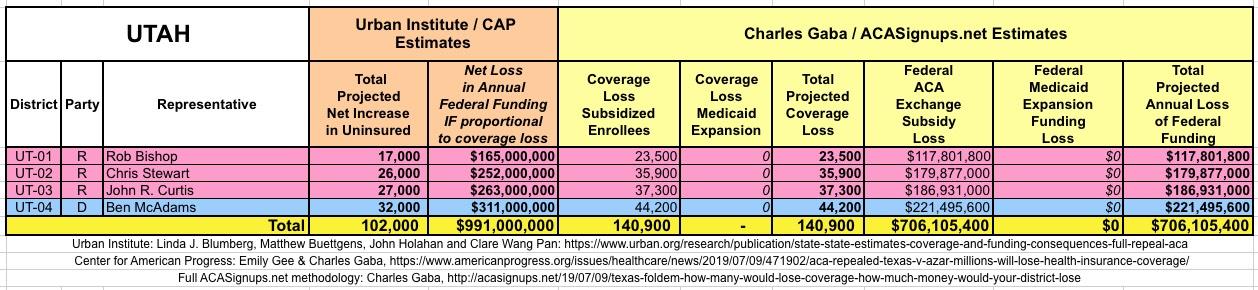
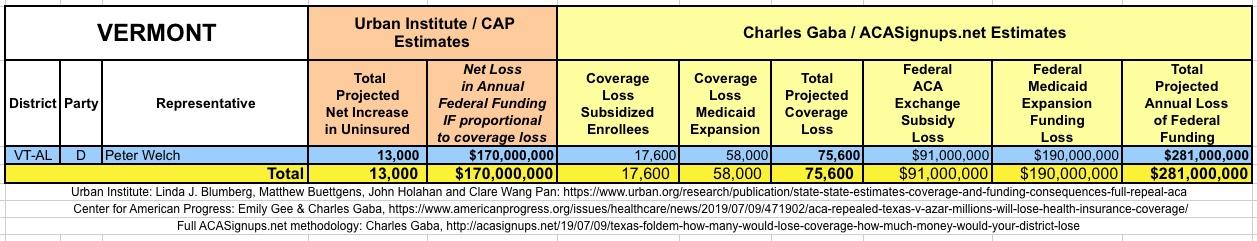
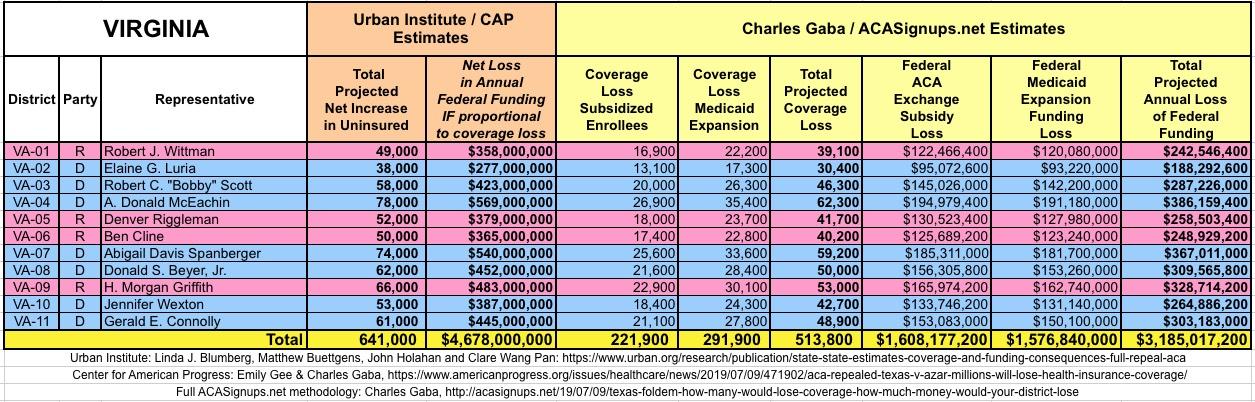
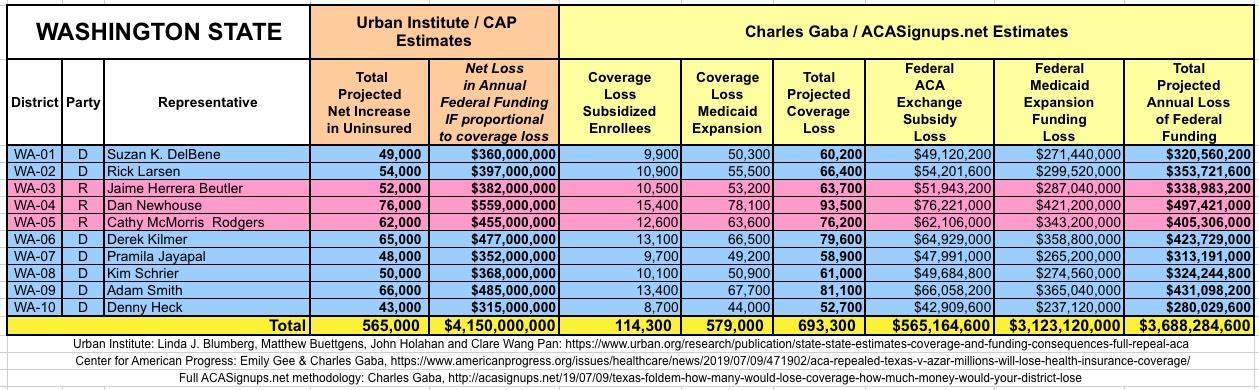
WITH ALL OF THIS IN MIND, I hereby present the (reformatted) Urban/CAP estimates side by side with my own estimates for every state. For Minnesota and New York I've rolled the BHP enrollment numbers and funding losses in with the subsidized Individual Market numbers. I'll be adding state tables throughout the day, so please refresh the browser later if your state isn't posted yet:
(click images for high-res version)
Advertisement
