

My half-assed attempt to explain the ACA's 3:1 "Age Band"
Sat, 03/30/2019 - 12:51pm
Over the past week or so, I've written several posts explaining how the new ACA 2.0 bill rolled out by the House Democrats would improve the law. So far I've mainly focused on the impact on health insurance policy premiums, since that's the single most obvious improvement.
In particular, I posted an extensive explainer, with colorful graphs and tables, showing how single adults at various ages would fare under ACA 2.0 compared to current law (households with more than one person would follow a similar patter, with the dollar amounts simply being higher across the board).
However, it's probably a good idea for people to also understand how age bands work. The age band is the reason an (unsubsidized) 64-year old pays so much more than a 21-year old.
In short: Before the Affordable Care Act, insurance carriers would typically charge older enrollees up to 5-6 times as much as younger ones, since older people generaly require a lot more healthcare services than younger ones. In two states (New York and Vermont), state law has long prohibited any age-based pricing variations; everyone is charged exactly the same amount for a given insurance policy regardless of their age.
UPDATE: Thanks to my friend Mina for reminding me that Vermont is actually considering abandoning their 1:1 age band policy.
In Massachusetts, state law only allows a 2:1 ratio: A 64-year old can only be charged up to twice as much as a 21-year old (note that in every state besides NY & VT, including MA, enrollees yonger than 21 are charged less regardless of the official ratio).
The Affordable Care Act basically split the difference between 5:1 and 1:1 with a 3:1 age band for enrollees aged 21 - 64; again, children up to age 20 pay somewhat less using a different formula.
The "age band" issue came up a lot during the 2017 GOP "repeal/replace" saga, with Democrats (and the AARP) accusing Republicans of trying to impose an "age tax" on older people, since the various "replace" bills (AHCA, BCRAP, etc) generally reset the band back out to 5:1. This attack was only partly accurate, of course, since the ACA itself already includes an "age tax"...just a smaller one.
As an aside, this also lead to one of the more idiotic elements of the House GOP's "AHCA" bill, however. They converted the subsidy formula from income-based to age-based, offering older enrollees twice as much financial assistance as younger ones (a flat $4,000/year vs. a flat $2,000)...while having the premiums on a 5:1 ratio. Basic math makes it clear that this...would not have been a good idea. Let's leave it at that.
Anyway, for a long time I assumed that the ACA's 3:1 age band was a straight formula: If a 21-year old's premium was priced at, say, $300/month, it would rise at an even pace until it reached $900/month at 64 years old. However, it turns out that's not quite the case--the actual formula ebbs & flows at different rates depending on the age bracket. Here's the official age band formula since 2018.
I've included examples of the national average benchmark Silver plan premiums according to HealthPocket.com. There are very slight variations in the dollar amounts (which are based on HealthPocket data), but overall the actual average rates are virtually identical to what they should be according to the formula. I also included a column showing how much a given enrollee's premium would increase year over year for the same policy as they age even if the official premium didn't change at all:
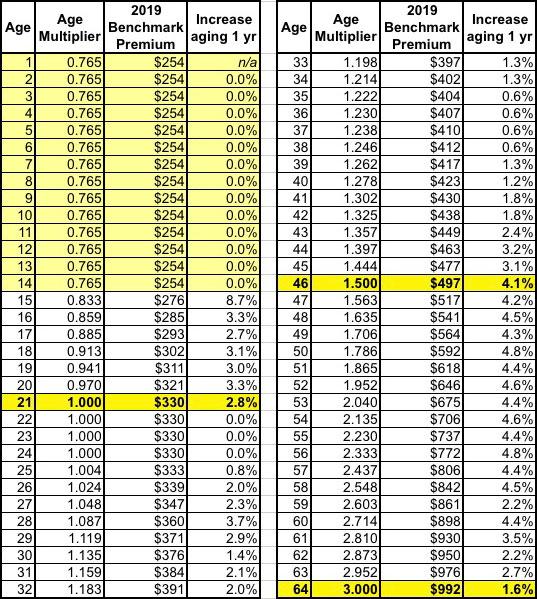
I turned 48 years old last year. That means that even if I keep the exact same policy, and even if the premium for that policy stays exactly the same, my premium for 2020 will still increase around 4.3% simply because I'll be 49 years old and therefore a slightly higher actuarial risk.
As I noted above, this isn't an even increase at all. Aside from there being no change for children up to 14 years old, the rate stays the same from 21-24 before it starts to increase at 25. It holds at a steady 0.6% per year from 35 - 38, but increases by 4.1% when you go from 45 to 46 years old. The biggest single-year jump comes when someone turns 50, and then again at 56.
Why these weird fits & starts? Beats the hell out of me; that's a question for an actuary.
Anyway, here's what it looks like visually (click the image for a full-size version:
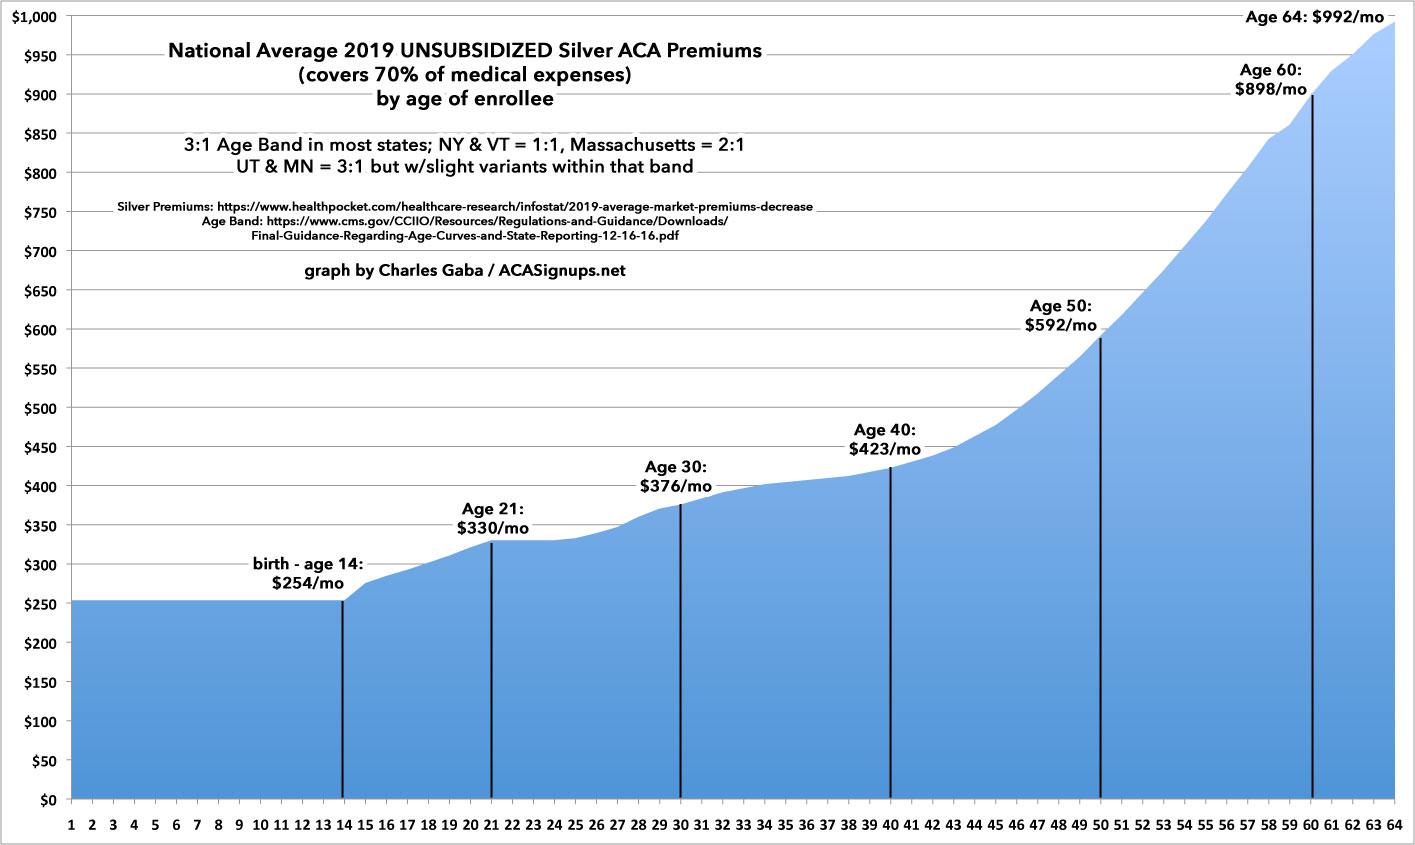
Hopefully this makes the "Subsidy Cliff" tables and graphs make more sense...this helps explain why a 30- or 40-year old earning $50,000/year under the current ACA formula (just over the subsidy limit) sees their premiums increase only slightly (or not at all), while a 60-year old earning the same $50,000/year get hit with a shocking premium increase.
This is the major reason why removing (or at the very least, raising) the 400% FPL cap is so vitally important.
Advertisement
