

BREAKING: CMS releases official 2019 Open Enrollment Period Report
Mon, 03/25/2019 - 4:11pm
UPDATE 3/26/19: In light of last night's bombshell announcement that the Trump DOJ is now officially calling for the entire ACA to be repealed in the #TexasFoldEm lawsuit, the wording of yesterday's press release from Trump's CMS division is straight out of 1984 territory:
CMS Issues the 2019 Exchange Open Enrollment Period Final Report
Agency also extends the policy allowing issuers to continue “grandmothered” plansThe Centers for Medicare & Medicaid Services (CMS) today released the Health Insurance Exchanges 2019 Open Enrollment Report. With the Trump Administration’s focus on making healthcare more affordable, the report confirms another successful open enrollment period coinciding with a stabilization of premiums after years of substantial increases. Specifically, the report shows plan selections in Exchange plans in the 50 states and D.C. remained steady at 11.4 million. This represents a minimal decline of around 300,000 plan selections from the same time last year. Also, as outlined in the report, average total premiums for plans selected through HealthCare.gov dropped by 1.5 percent from the prior year, the first decline since the Exchanges began operations in 2014.
Of course, the 1.5% avg. premium drop would have been more like a 9% drop if not for Congressional Republicans and Trump repealing the individual mandate (which also triggered the #TexasFoldEm law suit in the first place, I might add).
In addition to this report, as part of the Administration’s commitment to ensure access to affordable coverage options, CMS is also issuing guidance extending for one additional year, the non-enforcement policy to allow issuers to continue certain health plans, often referred to as “grandmothered” plans, which do not meet all the many mandates and restrictions in the Patient Protection and Affordable Care Act (PPACA). These plans can be more affordable for people who choose to renew coverage with them. Extending these grandmothered policies will allow consumers to maintain more affordable coverage than they would have access to through PPACA plans.
“Not extending the grandmothered plan policy would cancel plans that are meeting people’s needs today and, as a result, force people to decide between buying coverage they cannot afford on the individual market or going uninsured,” said CMS Administrator Seema Verma. “By extending the grandmothered plan policy, we are following through on our commitment to protect those left behind by Obamacare.”
I'm surprised at the amount of attention Verma is giving to Yet Another One-Year Extension of "transitional" (or "grandmothered") policies. To the best of my knowledge, there should only be a few hundred thousand people still enrolled in these policies as of now, and the "bump them out another year" thing has been happening for so long it's become a running joke. Huh.
While the overall number of plan selections decreased from the previous year, this decrease in plan selections could likely be attributed to a lower demand for Exchange coverage. The strong economy and growing employment likely increased the number of people with access to employer-sponsored coverage and, in turn, reduced demand for subsidized health coverage offered on the Exchanges. Another factor that reduced demand for Exchange coverage, were the roughly 100,000 people who were enrolled in the Exchange in Virginia at the end of 2018 and reported incomes that would make them eligible for the new Virginia Medicaid expansion in 2019.
Or, it could be attributed to the removal of the individual mandate penalty, which is a common and accepted method of preventing people from gaming other types of insurance such as auto insurance and homeowner's insurance.
On the other hand, the part about Virginia's Medicaid expansion is absolutely correct (in fact, 100K is higher than the 85,000 or so I estimated). Again, the irony here is that if Trump gets his way, Virginia's Medicaid expansion program would be wiped out right along with the rest of the ACA.
Demographic data provided in the report also demonstrate stability on the Exchanges. The percent of young adults aged 18-34 who selected a plan through HealthCare.gov remained unchanged from the prior year at 26 percent. The demographic proportions by gender, race, income, and rural and non-rural also remained largely unchanged.
“Another year of stable enrollment through the Exchanges directly reflects the strong work CMS staff put into ensuring that Exchange consumers experience a seamless enrollment process free from unnecessary hurdles and IT glitches,” said Administrator Verma. “It is no coincidence enrollment remained strong when the Exchange call center maintained a record high 90 percent satisfaction rate and no waiting rooms were needed in the final, busiest days of enrollment.”
Once again: You have the Trump Administration talking out of both sides of their mouths with a split tongue: "The ACA sucks and is horrible and needs to be repealed! Also, the ACA is awesome and doing great!"
The report also shows the average monthly premiums for plans purchased through HealthCare.gov before taking advantage of advanced payments of the premium tax credits available to eligible consumers was $612, down from $621 for the previous open enrollment period (OEP). After these advanced payments are applied, the average premium was $87 compared to $89 for the prior OEP.
This decline in premiums, however, follows a 23 percent average premium increase in 2017 and another 31 percent increase in 2018. Such large premium increases in previous years made premiums substantially less affordable for people who do not qualify for subsidies. This small decline in premiums in 2019 moves in the right direction, but, for unsubsidized people, premiums remain considerably higher than before the PPACA’s main requirements were implemented in 2014.
Yes, and what caused that 31% increase in 2018? Oh, that's right: Over half of it was caused by Trump's 2017 sabotage efforts, primarily his cutting off CSR reimbursement payments. The mendacity here is stunning, as is typical for the Trump Admin.
Recognizing individual health insurance premiums are no longer affordable for a great many Americans, the Trump Administration is committed to expanding more affordable coverage options to this group of people left behind by the PPACA, which spurred recent actions to expand access to association health plans and short-term health plans, as well as the extension of the grandmothered plan policy issued in guidance today.
One More Time: Expanding #ShortAssPlans mainly serves to increase ACA premiums even further while also exposing those who enroll in them to catastrophic coverage gaps.
------------
HEALTH INSURANCE EXCHANGES 2019 OPEN ENROLLMENT REPORT - Mar 25, 2019
The Health Insurance Exchanges 2019 Open Enrollment Report summarizes health plan selections made on the individual Exchanges during the 2019 Open Enrollment Period (2019 OEP) for the 39 states that use the HealthCare.gov eligibility and enrollment platform, as well as for the 12 State-Based Exchanges (SBEs) that use their own eligibility and enrollment platforms.[1] Additional data are reported for the 39 states that use the HealthCare.gov platform, including age, gender, rural location, self-reported race and ethnicity, household income as a percent of the federal poverty level (FPL), and the average premiums among consumers with and without advance premium tax credits (APTC).
More information on applications and plan selections are available in a suite of accompanying public use files (PUFs). The PUFs contain information on applications submitted and the number of medical and stand-alone dental plan selections by state, county and ZIP code.[2] Other plan and demographic information in the PUFs include the metal level of selected plans, premium and financial assistance information, age, gender, rural location, self-reported race and ethnicity, and household income as a percent of FPL. Data are also stratified by new, returning and automatically re-enrolled consumers and by plan metal level in the state PUF. The methodology for this report and detailed metric definitions are included with the PUF.
Key findings from this report include:
- Plan Selections: Approximately 11.4 million consumers selected or were automatically re-enrolled in an Exchange plan during the 2019 OEP in the 50 states, plus DC. This is a decrease from 11.8 million consumers during the 2018 OEP.
The exact, official number is 11,444,141 QHP selections nationally, which is about 21,000 lower than my unofficial estimate from mid-February. I'll have to compare each state side by side and read the footnotes to figure out where those 21,186 enrollees disappeared to; I presume they'll be somewhere in the state-based exchange data.
- New Consumers: Nationally, 24 percent of consumers with a plan selection during the 2019 OEP were new to the Exchange through which they enrolled. This is a decrease from 27 percent during the 2018 OEP.
- Average Premiums: Among all consumers in the 39 states that use the HealthCare.gov platform, the average premium before application of the tax credit was $612 in the 2019 OEP. This is a decrease from $621 in the 2018 OEP.
Wait...$612/month on average? Gee, who called that? (OK, to be fair, $612 only includes 39 states; the national average is likely a few bucks higher or lower when you average in the other 12 states. Still pretty damned good, I'd say.)
- Financial Assistance: Eighty-seven percent of consumers in states that use the HealthCare.gov platform received APTC in the 2019 OEP, compared to 85 percent in the 2018 OEP; the average premium after application of APTC for these consumers was $87 in the 2019 OEP, compared to $89 in the 2018 OEP.
Consumers Selecting Plans through the Exchanges: 50 States, plus DC
Approximately 11.4 million[3] consumers selected or were automatically re-enrolled[4]in an Exchange plan during the 2019 OEP. This includes 8.4 million consumers in the 39 states using the HealthCare.gov platform and 3.0 million consumers in SBEs (see Figure 1).
The bar graph CMS uses is crude and doesn't make it easy to compare state-based exchange performance vs. federal exchange performance, so I'm gonna use my own version:
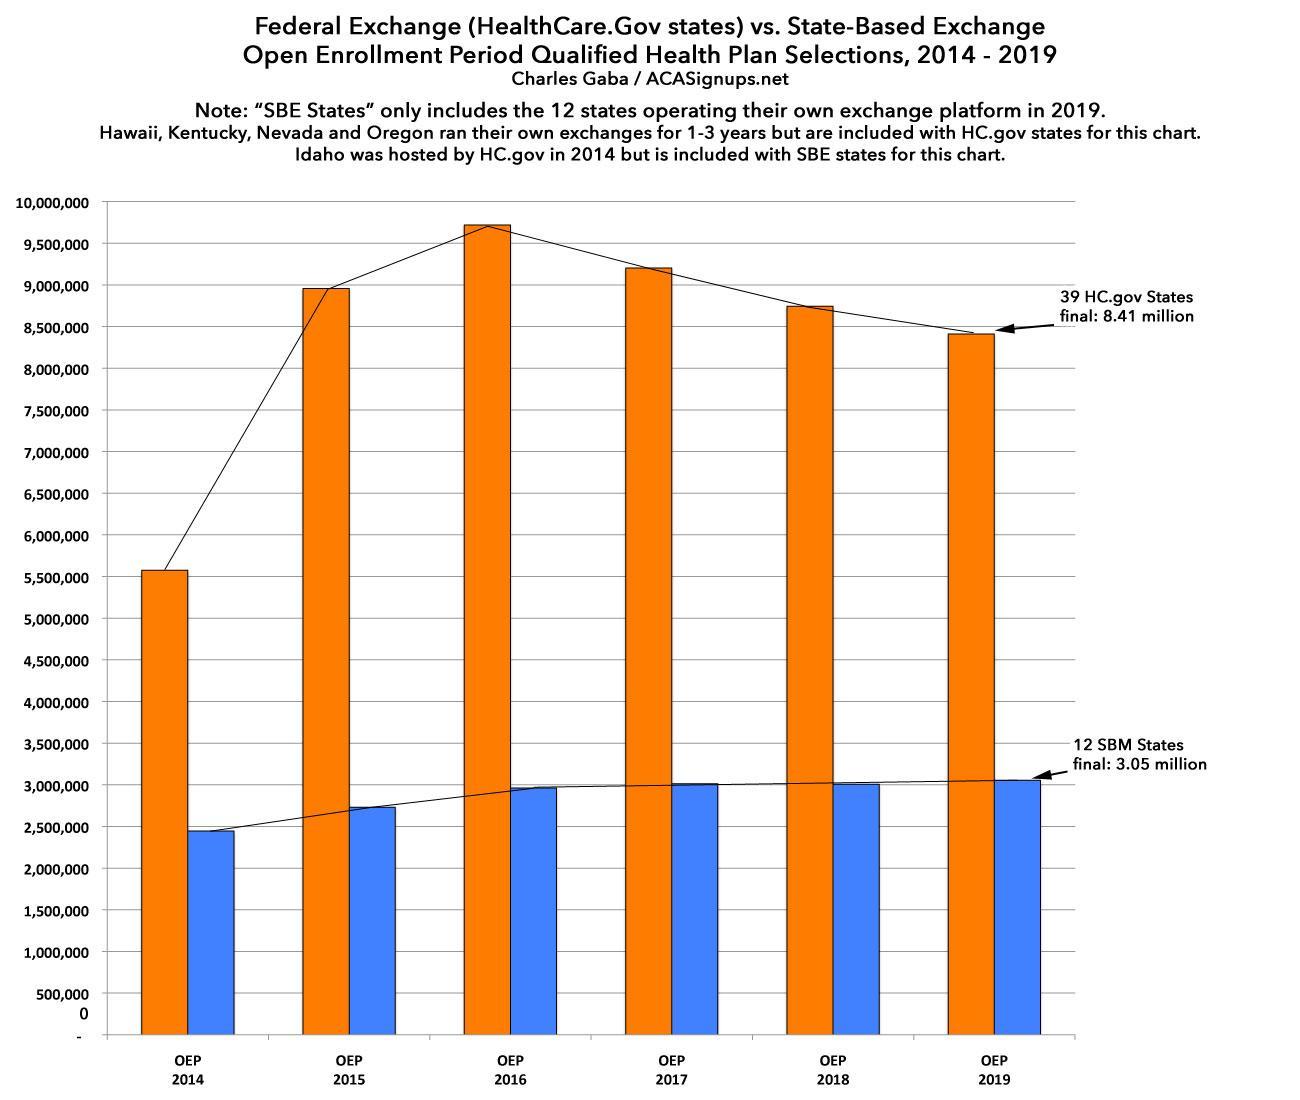
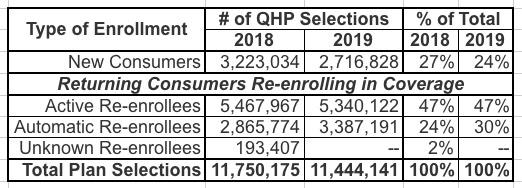
Table 1 summarizes the types of consumers who enrolled during the 2019 OEP. Twenty-four percent of consumers with a plan selection were new to the Exchanges and 47 percent of consumers actively returned to select a 2019 plan on the Exchanges. Additional plan selection and demographic data for all 50 states plus DC are contained in the accompanying public use file.
Consumers Selecting Plans through the HealthCare.gov Platform
Reported below is additional information for consumers in states that use HealthCare.gov. Table 2 shows demographic and plan characteristics among consumers who selected or were automatically re-enrolled in a plan during the 2018 and 2019 OEPs. Similar to the 2018 OEP, 18 percent of HealthCare.gov consumers resided in a rural location in the 2019 OEP. The percent of consumers with reported household incomes between 100% and 250% FPL increased from 70 percent in the 2018 OEP to 71 percent in the 2019 OEP.[7] Likewise, the percent of consumers who had their premiums reduced by APTC increased from 85 percent in the 2018 OEP to 87 percent in the 2019 OEP. The percent of consumers who selected a silver plan decreased from 65 percent in the 2018 OEP to 61 percent in the 2019 OEP, while bronze plan selections increased from 28 percent to 30 percent.
Table 2: Demographic and Plan Characteristics of Consumers with 2018 and 2019 OEP Plan Selections on HealthCare.gov
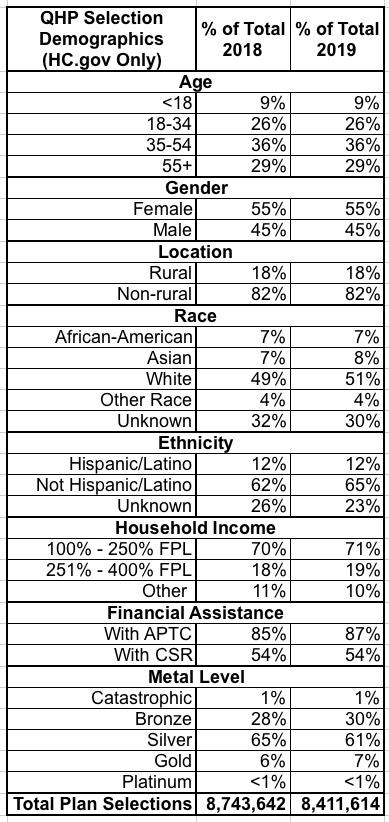
Not a whole lot to report here...most of the demographic specs for the 39 HC.gov states stayed pretty much the same. Subsidized enrollment (APTC) increased slightly, but that's to be expected as several more states took advantage of Silver Loading this year, which also likely explains the several-point shift away from Silver plans to Bronze and Gold. Otherwise, not much new under the sun.
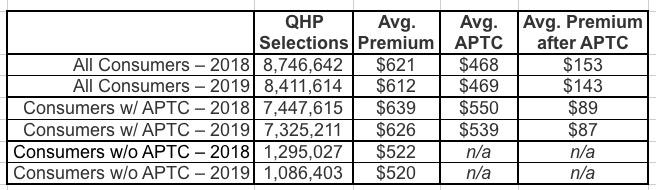
Table 3 contains information on premiums for consumers in states that used HealthCare.gov in 2018 and 2019 OEPs. The average premium before application of the tax credit decreased by 1 percent, from $621 in the 2018 OEP to $612 in the 2019 OEP. Among consumers with APTC, the average tax credit covered about 86 percent of the total premium in both the 2018 and 2019 OEPs; the average premium after APTC for these consumers decreased from $89 in the 2018 OEP to $87 in the 2019 OEP.
Table 3: Average Premium and Average Net Premium after APTC for Consumers with 2018 and 2019 OEP Plan Selections on HealthCare.gov

[1] Data for SBEs that use their own eligibility and enrollment platforms are retrieved from the respective states’ information systems and have not been validated by CMS, thus metric calculations for these states may vary. The 12 SBEs that use their own eligibility and enrollment platforms are California, Colorado, Connecticut, the District of Columbia, Idaho, Maryland, Massachusetts, Minnesota, New York, Rhode Island, Vermont, and Washington.
This presumably explains the 21,000 QHP selection discrepancy, but I'll have to run thorugh each of the 12 state numbers to see where they match up and where they don't.
[2] The state-level PUF can be found here. For the 39 states that use the HealthCare.gov eligibility and enrollment platform, public use files with information on plan selections at the county and zip code levels are also available.
[3] In addition to the total plan selections in this report there were 822,713 individuals in New York and Minnesota who signed up for coverage through a Basic Health Plan (BHP). States have the option of establishing BHPs to provide health coverage for low-income residents who might otherwise be eligible for Exchange coverage.
Hmm...I have the NY + MN BHP enrollment total down as 868,367...a difference of over 45,000 people. Huh.
[4] As in prior years, consumers with coverage at the end of 2018 who did not make an active selection were generally automatically re-enrolled for 2019. When consumers had 2019 Exchange plans available to them from their 2018 issuer, they were automatically re-enrolled into the same plan as 2018 or a different plan from the same issuer; depending on the Exchange, they could also be automatically re-enrolled into a suggested alternate plan from a different issuer.
[5] The data for the 2015 OEP was from 11/15/2014 to 2/22/2015; the 2016 OEP was from 11/1/2015 to 2/1/2016 (1/31/2016 for some states); the 2017 OEP was from 11/1/2016 to 1/31/2017; for HealthCare.gov states the 2018 OEP was from 11/1/2017 to 12/15/2017 with data reported through 12/23/2017, for HealthCare.gov states the 2019 OEP was from 11/1/2018 to 12/15/2018 with data reported through 12/22/2018 (data through dates vary for SBEs; see the PUF methodology for detailed information). Plan selections by Exchange platform for each OEP reflects the status of the state’s Exchange platform at the time of that OEP. Caution should be used when comparing plan selections across OEPs since some states have transitioned platforms between years, and state expansion of Medicaid may affect enrollment figures from year to year. Additionally, the rate at which issuers submitted plan cancellations may have varied from year to year and caution should be used in interpreting these data as they do not reflect plan effectuations.
[6] Totals may not sum to 100% due to rounding.
[7] For a family of four, a household income between 100% and 250% FPL generally corresponds to an annual household income of between $24,600 and $61,500 for coverage year 2018 and between $25,100 and $62,750 for coverage year 2019.
[8] Note that Table 2 in this report is not directly comparable to Table 2 in the previous 2018 report. SBEs do not collect and report data across all of the demographic factors that HealthCare.gov states report. In the 2018 report, Table 2 reported on the demographic and plan characteristic factors that are consistently reported across all states for both HealthCare.gov states and SBEs. The 2018 report included a separate table for the demographic factors that are limited to Healthcare.gov. This year, Table 2 consolidates those tables and reports HealthCare.gov states only. The demographic and plan characteristic data for SBEs is available in the PUFs.
[9] Totals may not sum to 100% due to rounding.
[10] Other Race includes multiracial, American Indian/Alaska Native, and Native Hawaiian/Pacific Islander.
[11] Other household income includes plan selections for which consumers were not requesting financial assistance, incomes below 100% FPL, incomes above 400% FPL, and unknown income. Please see the public use file for more information.
[12] Note that these findings may not be generalizable to the entire population of consumers who selected an ACA compliant plan without APTC, as many consumers in this population purchase plans off of the Exchange.
This last footnote (#12) refers to the "Consumers without APTC" rows in both 2018 and 2019. I find it very interesting that they included this note. I'll have to check and see whether there was a similar note last year, which I doubt. This appears to be CMS's recognition of the impact of the Silver Switcharoo...that some people enrolled in on-exchange Silver plans switched to off-exchange Silver plans to avoid taking the CSR premium hit. It's also a recognition of the off-exchange ACA-compliant market in general, which has been a rare thing for either the Obama or Trump Administrations to take note of.
Advertisement
